
Toward the beginning of each school year, BLS issues a new set of Employment Projections, looking at projected growth and decline in occupations over the next decade. These estimates are important for understanding structural changes in the workforce over time. But to identify opportunities for new workers, we need to look beyond occupational growth and decline, to a concept we call “occupational openings.”
Occupational openings are the sum of the following:
- Projected job growth (or decline)
- Occupational separations — workers leaving an occupation, which includes:
- Labor force exits — workers who leave the labor force entirely, perhaps to retire
- Occupational transfers — workers who leave one occupation and transfer to a different occupation.
This video explains the concept of occupational openings further.
BLS publishes the projected number of occupational openings for over 800 occupations. Not surprisingly, some of the largest occupations in the country have some of the largest number of openings. For example, certain food service jobs, which include fast food workers, are projected to have nearly 800,000 openings per year over the next decade. I guess this isn’t a surprise in an occupation with over 3.7 million workers.
But when we delve into the information on occupational openings a little further, more stories emerge. Some related occupations have very different patterns of openings. And some occupations have similar levels of openings for different reasons. Let’s take a look at a few examples.
In 2018, there were over 800,000 lawyers in the U.S., and a projected 45,000 annual openings for lawyers, about 5.5 percent of employment. At the same time, there were fewer than half the number of paralegals and legal assistants (325,000), with projected annual openings around 40,000 per year – 12.4 percent of employment. These two related occupations had similar numbers of projected openings, but those openings represented different proportions of current employment. Such differences reflect required education, demographics, compensation, and other variables. Lawyers tend to have professional degrees that are specialized for that occupation and are therefore more closely tied to their occupation than paralegals, who have more diverse educational backgrounds. You can find out more about how worker characteristics affect these numbers in the Monthly Labor Review.
Now let’s look at the sources of occupational openings. In this first example, we compare two occupational groups: installation, maintenance, and repair occupations and healthcare support occupations. These are broad categories that include a number of different individual occupations.
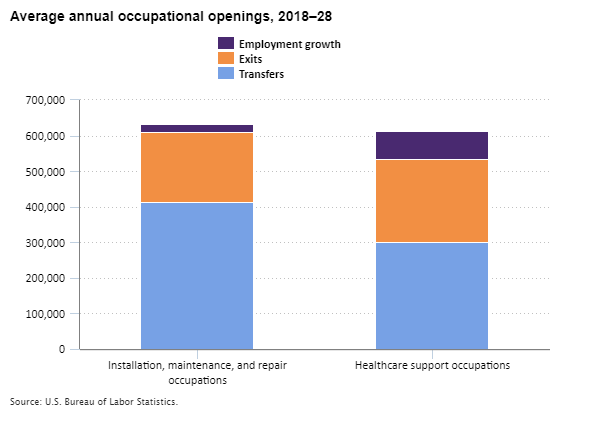
Editor’s note: Data for this chart are available in the table below.
In this example, both occupational groups have projected annual openings of a little over 600,000 per year, yet they come from different sources. Two-thirds of the openings among installation occupations result from workers leaving to go to other occupations; in contrast, just under half the openings among healthcare support occupations are from people moving to other occupations. Looking at projected job growth, BLS projects that healthcare support occupations, the fastest growing occupational group, will add more than three times as many new jobs as installation occupations, annually over the next decade (78,520 versus 23,320).
Now let’s look at two individual occupations — web developers and court, municipal, and license clerks. These are very different jobs, but both are projected to have about 15,000 annual openings over the next decade. Here, too, occupational openings come from very different places, as this chart shows:
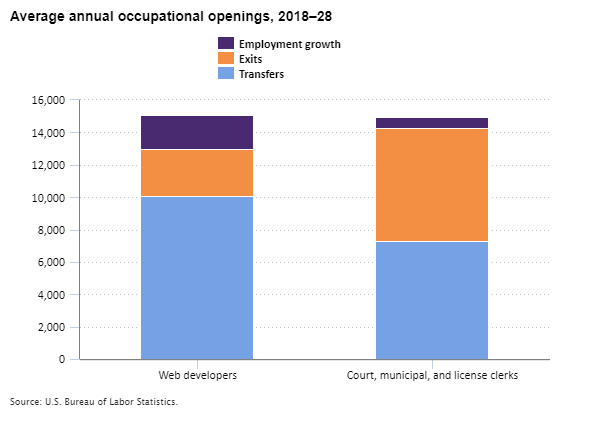
Editor’s note: Data for this chart are available in the table below.
In this case, around 67 percent of openings for web developer jobs come from workers transferring to other jobs, compared with only 49 percent transfers for clerks. But a greater share of clerks are exiting the labor force. Once again, differences are due to a variety of factors, although the age of workers is a significant factor in this case — web developers have a median age of 38.3, while clerks tend to be older, with a median age of 49.1. Younger workers are more likely to transfer occupations, while older workers are more likely to exit the labor force, as for retirement.
So what does all this really mean? If nothing else, you can see that the thousands of individual data elements available through the BLS Employment Projections program tell a thousand different stories, and more. Whether large or small, growing or declining, there’s information about hundreds of occupations that can be helpful to students looking for careers, counselors helping those students and others, workers wanting to change jobs, employers thinking about their future, policymakers considering where to put job training resources, and on and on. These examples just scratch the surface of what BLS Employment Projections information can tell us. Take a look for yourself.
| Occupation | Employment growth | Exits | Transfers |
|---|---|---|---|
Installation, maintenance, and repair occupations | 23,320 | 195,700 | 413,900 |
Healthcare support occupations | 78,520 | 235,500 | 299,600 |
| Occupation | Employment growth | Exits | Transfers |
|---|---|---|---|
Web developers | 2,090 | 2,900 | 10,100 |
Court, municipal, and license clerks | 670 | 7,000 | 7,300 |