
Soon after I became Commissioner, the top-notch BLS staff shared with me their vision to expand the Job Openings and Labor Turnover Survey (JOLTS). The JOLTS program publishes data each month on the number and rate of job openings, hires, and separations (broken out by quits, layoffs and discharges, and other separations). These data are available at the national level and for the four large geographic regions—Northeast, Midwest, South, and West.
That left a major data gap on labor demand, hires, and separations for states and metropolitan areas. BLS provides data on labor supply for states and metro areas each month from the Local Area Unemployment Statistics program. We also provide data on employment change in states and metro areas each month from the Current Employment Statistics survey. Employment change is the net effect of hires and separations, but it doesn’t show the underlying flow of job creation and destruction. Having better, timelier state and metro JOLTS data would provide a quicker signal about whether labor demand is accelerating or weakening in local economies.
About 2 months after the staff briefed me, the JOLTS program published experimental state estimates for the first time on May 24, 2019. We have been updating those estimates on a quarterly basis since then. We use a statistical model to help us produce the most current state estimates. We then improve those estimates during an annual benchmark process by taking advantage of data available from the Quarterly Census of Employment and Wages. The JOLTS program is well on its way to moving these state estimates into its official, monthly data stream. Look for that to happen in the second half of 2021!
The President’s proposed budget for fiscal year 2021 includes three improvements to the JOLTS program.
- Expand the sample to support direct sample-based estimates for each state.
- Accelerate the review and publication of the estimates.
- Add questions to provide more information about job openings, hires, and separations.
If funded, this proposal would allow BLS to improve the data quality available from the current JOLTS state estimates. It also would let us add very broad industry detail for each state and more industry detail at the national level.
The proposed larger sample size may also let us produce model-assisted JOLTS estimates for many metro areas. To demonstrate this potential, the JOLTS team produced a one-time set of research estimates for the 18 largest metropolitan statistical areas, those with 1.5 million or more employees. These research estimates show the potential for data that would be available regularly with a larger JOLTS sample. I encourage you to explore this exciting new research series and let us know what you think.
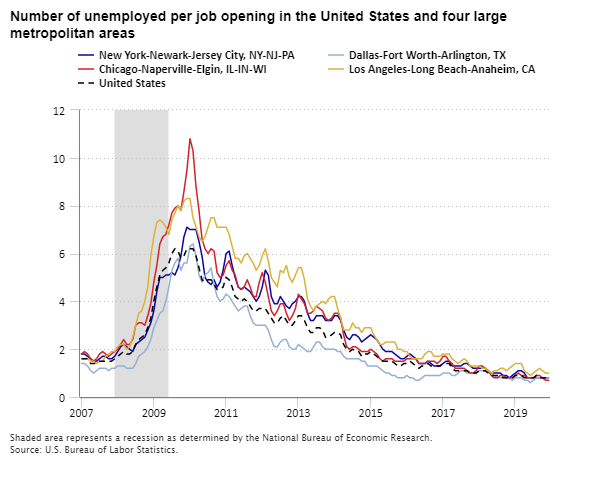
Editor’s note: Data for this chart are available in the table below.
This is just one example of the excellent work I see at BLS every day. The BLS staff are consummate professionals who continue to do outstanding work even in the most trying of times. The entire BLS staff has been teleworking now for several months due to COVID-19, and every program continues to produce high quality data on schedule! Even in these extraordinary circumstances, BLS professionals continue to innovate and find ways to improve quality and develop new gold standard data products to help the policymakers, businesses, and the public make better-informed decisions.
| Date | New York-Newark-Jersey City, NY-NJ-PA | Dallas-Fort Worth-Arlington, TX | Chicago-Naperville-Elgin, IL-IN-WI | Los Angeles-Long Beach-Anaheim, CA | United States |
|---|---|---|---|---|---|
Jan 2007 | 1.8 | 1.4 | 1.8 | 1.6 | 1.6 |
Feb 2007 | 1.8 | 1.4 | 1.9 | 1.6 | 1.6 |
Mar 2007 | 1.7 | 1.3 | 1.8 | 1.6 | 1.6 |
Apr 2007 | 1.6 | 1.1 | 1.6 | 1.5 | 1.4 |
May 2007 | 1.5 | 1.0 | 1.5 | 1.5 | 1.4 |
Jun 2007 | 1.5 | 1.1 | 1.6 | 1.4 | 1.4 |
Jul 2007 | 1.6 | 1.2 | 1.8 | 1.5 | 1.5 |
Aug 2007 | 1.7 | 1.2 | 1.9 | 1.5 | 1.5 |
Sep 2007 | 1.7 | 1.2 | 1.8 | 1.7 | 1.5 |
Oct 2007 | 1.6 | 1.1 | 1.7 | 1.8 | 1.5 |
Nov 2007 | 1.6 | 1.2 | 1.8 | 1.9 | 1.5 |
Dec 2007 | 1.7 | 1.2 | 1.9 | 1.9 | 1.6 |
Jan 2008 | 1.9 | 1.3 | 2.0 | 2.1 | 1.7 |
Feb 2008 | 2.1 | 1.3 | 2.2 | 2.2 | 1.8 |
Mar 2008 | 2.2 | 1.3 | 2.4 | 2.2 | 1.9 |
Apr 2008 | 2.1 | 1.2 | 2.2 | 2.0 | 1.8 |
May 2008 | 2.0 | 1.2 | 2.2 | 2.1 | 1.8 |
Jun 2008 | 1.9 | 1.2 | 2.4 | 2.5 | 1.9 |
Jul 2008 | 2.2 | 1.4 | 3.0 | 3.0 | 2.2 |
Aug 2008 | 2.3 | 1.7 | 3.1 | 3.5 | 2.4 |
Sep 2008 | 2.4 | 1.8 | 3.1 | 3.6 | 2.5 |
Oct 2008 | 2.5 | 1.9 | 3.0 | 4.0 | 2.6 |
Nov 2008 | 2.8 | 2.1 | 3.4 | 4.6 | 2.9 |
Dec 2008 | 3.1 | 2.4 | 3.9 | 5.9 | 3.3 |
Jan 2009 | 3.6 | 2.9 | 4.8 | 6.7 | 4.0 |
Feb 2009 | 4.4 | 3.2 | 5.5 | 7.3 | 4.6 |
Mar 2009 | 5.0 | 3.5 | 6.4 | 7.4 | 5.1 |
Apr 2009 | 5.0 | 3.6 | 6.7 | 7.3 | 5.3 |
May 2009 | 5.1 | 4.0 | 6.8 | 7.1 | 5.4 |
Jun 2009 | 5.1 | 4.6 | 7.2 | 6.8 | 5.6 |
Jul 2009 | 5.2 | 5.3 | 7.7 | 7.4 | 6.0 |
Aug 2009 | 5.1 | 5.6 | 7.9 | 7.7 | 6.2 |
Sep 2009 | 5.4 | 5.8 | 8.0 | 8.0 | 6.1 |
Oct 2009 | 5.9 | 5.3 | 7.8 | 7.8 | 5.8 |
Nov 2009 | 6.7 | 5.6 | 8.6 | 8.2 | 5.9 |
Dec 2009 | 7.1 | 5.6 | 9.5 | 8.3 | 6.2 |
Jan 2010 | 7.0 | 6.3 | 10.8 | 8.3 | 6.2 |
Feb 2010 | 7.0 | 6.4 | 10.3 | 7.5 | 6.2 |
Mar 2010 | 7.0 | 5.9 | 8.8 | 7.1 | 5.9 |
Apr 2010 | 6.5 | 5.1 | 7.8 | 6.7 | 5.4 |
May 2010 | 5.9 | 4.8 | 6.6 | 6.5 | 4.9 |
Jun 2010 | 5.0 | 5.1 | 6.2 | 6.7 | 4.8 |
Jul 2010 | 4.8 | 5.2 | 6.0 | 7.1 | 4.9 |
Aug 2010 | 4.7 | 5.4 | 6.2 | 7.5 | 4.9 |
Sep 2010 | 4.9 | 4.7 | 6.1 | 7.5 | 4.7 |
Oct 2010 | 4.6 | 4.2 | 5.2 | 7.1 | 4.5 |
Nov 2010 | 4.8 | 4.0 | 5.0 | 7.1 | 4.5 |
Dec 2010 | 5.3 | 4.1 | 5.1 | 7.1 | 4.6 |
Jan 2011 | 6.0 | 4.3 | 5.5 | 7.1 | 5.0 |
Feb 2011 | 6.1 | 4.2 | 5.7 | 6.8 | 4.9 |
Mar 2011 | 5.5 | 4.0 | 5.3 | 6.3 | 4.6 |
Apr 2011 | 5.0 | 3.8 | 5.1 | 5.8 | 4.2 |
May 2011 | 4.6 | 3.6 | 4.6 | 5.8 | 4.1 |
Jun 2011 | 4.5 | 3.7 | 4.5 | 5.6 | 4.0 |
Jul 2011 | 4.6 | 3.8 | 4.6 | 5.9 | 4.1 |
Aug 2011 | 4.5 | 3.8 | 4.9 | 6.0 | 4.0 |
Sep 2011 | 4.4 | 3.4 | 4.6 | 5.8 | 3.8 |
Oct 2011 | 4.2 | 3.1 | 4.2 | 5.6 | 3.6 |
Nov 2011 | 4.0 | 3.0 | 4.2 | 5.3 | 3.6 |
Dec 2011 | 4.2 | 3.0 | 4.8 | 5.5 | 3.7 |
Jan 2012 | 4.6 | 3.0 | 5.2 | 5.9 | 3.7 |
Feb 2012 | 5.3 | 3.0 | 4.8 | 6.2 | 3.7 |
Mar 2012 | 5.1 | 2.8 | 4.2 | 5.7 | 3.5 |
Apr 2012 | 4.2 | 2.4 | 3.6 | 5.0 | 3.3 |
May 2012 | 3.9 | 2.1 | 3.4 | 4.8 | 3.1 |
Jun 2012 | 3.9 | 2.1 | 3.6 | 4.6 | 3.1 |
Jul 2012 | 4.2 | 2.3 | 3.9 | 5.3 | 3.3 |
Aug 2012 | 4.0 | 2.4 | 3.9 | 5.2 | 3.4 |
Sep 2012 | 3.8 | 2.4 | 3.5 | 5.5 | 3.2 |
Oct 2012 | 3.7 | 2.1 | 3.2 | 5.0 | 3.0 |
Nov 2012 | 3.9 | 2.0 | 3.4 | 4.8 | 3.0 |
Dec 2012 | 4.0 | 2.0 | 3.7 | 5.1 | 3.2 |
Jan 2013 | 4.2 | 2.2 | 4.3 | 5.4 | 3.4 |
Feb 2013 | 4.2 | 2.1 | 4.1 | 5.4 | 3.4 |
Mar 2013 | 4.0 | 2.0 | 3.9 | 4.9 | 3.2 |
Apr 2013 | 3.5 | 1.9 | 3.5 | 4.1 | 2.9 |
May 2013 | 3.2 | 1.9 | 3.5 | 3.8 | 2.7 |
Jun 2013 | 3.2 | 2.1 | 3.6 | 3.6 | 2.7 |
Jul 2013 | 3.4 | 2.3 | 3.8 | 3.8 | 2.9 |
Aug 2013 | 3.4 | 2.3 | 3.7 | 3.9 | 2.9 |
Sep 2013 | 3.4 | 2.1 | 3.6 | 4.0 | 2.8 |
Oct 2013 | 3.2 | 2.0 | 3.3 | 3.9 | 2.5 |
Nov 2013 | 3.2 | 2.0 | 3.2 | 4.1 | 2.5 |
Dec 2013 | 3.2 | 2.0 | 3.3 | 4.2 | 2.6 |
Jan 2014 | 3.4 | 2.0 | 3.5 | 4.2 | 2.7 |
Feb 2014 | 3.4 | 1.9 | 3.5 | 3.7 | 2.7 |
Mar 2014 | 3.2 | 1.9 | 3.3 | 3.3 | 2.6 |
Apr 2014 | 2.8 | 1.7 | 2.6 | 2.8 | 2.2 |
May 2014 | 2.5 | 1.6 | 2.1 | 2.8 | 2.0 |
Jun 2014 | 2.4 | 1.6 | 2.0 | 2.8 | 1.9 |
Jul 2014 | 2.6 | 1.6 | 2.1 | 3.1 | 2.0 |
Aug 2014 | 2.6 | 1.6 | 2.1 | 2.9 | 1.9 |
Sep 2014 | 2.5 | 1.6 | 2.0 | 2.9 | 1.9 |
Oct 2014 | 2.3 | 1.5 | 1.9 | 2.7 | 1.7 |
Nov 2014 | 2.4 | 1.5 | 1.9 | 2.9 | 1.8 |
Dec 2014 | 2.5 | 1.3 | 1.9 | 2.9 | 1.8 |
Jan 2015 | 2.6 | 1.3 | 2.0 | 2.9 | 1.9 |
Feb 2015 | 2.5 | 1.3 | 1.9 | 2.6 | 1.8 |
Mar 2015 | 2.4 | 1.3 | 1.8 | 2.4 | 1.7 |
Apr 2015 | 2.2 | 1.2 | 1.6 | 2.2 | 1.6 |
May 2015 | 2.0 | 1.1 | 1.5 | 2.2 | 1.5 |
Jun 2015 | 1.9 | 1.0 | 1.6 | 2.3 | 1.5 |
Jul 2015 | 1.9 | 1.0 | 1.6 | 2.3 | 1.5 |
Aug 2015 | 1.9 | 0.9 | 1.6 | 2.3 | 1.5 |
Sep 2015 | 1.8 | 0.9 | 1.5 | 2.3 | 1.4 |
Oct 2015 | 1.7 | 0.8 | 1.5 | 2.0 | 1.3 |
Nov 2015 | 1.6 | 0.8 | 1.5 | 2.0 | 1.3 |
Dec 2015 | 1.6 | 0.8 | 1.5 | 1.9 | 1.4 |
Jan 2016 | 1.7 | 0.9 | 1.6 | 1.9 | 1.4 |
Feb 2016 | 1.8 | 0.8 | 1.6 | 1.7 | 1.5 |
Mar 2016 | 1.7 | 0.8 | 1.6 | 1.6 | 1.4 |
Apr 2016 | 1.6 | 0.7 | 1.6 | 1.6 | 1.3 |
May 2016 | 1.4 | 0.7 | 1.4 | 1.6 | 1.2 |
Jun 2016 | 1.4 | 0.8 | 1.4 | 1.6 | 1.3 |
Jul 2016 | 1.4 | 0.9 | 1.4 | 1.8 | 1.3 |
Aug 2016 | 1.5 | 0.9 | 1.5 | 1.9 | 1.4 |
Sep 2016 | 1.4 | 0.9 | 1.5 | 1.9 | 1.3 |
Oct 2016 | 1.3 | 0.9 | 1.5 | 1.7 | 1.3 |
Nov 2016 | 1.3 | 0.9 | 1.4 | 1.7 | 1.3 |
Dec 2016 | 1.3 | 0.9 | 1.5 | 1.7 | 1.3 |
Jan 2017 | 1.4 | 1.0 | 1.7 | 1.8 | 1.4 |
Feb 2017 | 1.5 | 1.0 | 1.7 | 1.8 | 1.4 |
Mar 2017 | 1.5 | 1.0 | 1.5 | 1.8 | 1.4 |
Apr 2017 | 1.3 | 0.9 | 1.4 | 1.6 | 1.2 |
May 2017 | 1.3 | 0.9 | 1.2 | 1.5 | 1.1 |
Jun 2017 | 1.3 | 1.0 | 1.2 | 1.4 | 1.1 |
Jul 2017 | 1.3 | 1.1 | 1.2 | 1.5 | 1.1 |
Aug 2017 | 1.4 | 1.1 | 1.2 | 1.6 | 1.1 |
Sep 2017 | 1.4 | 1.0 | 1.1 | 1.5 | 1.1 |
Oct 2017 | 1.3 | 1.0 | 1.0 | 1.3 | 1.0 |
Nov 2017 | 1.2 | 1.0 | 1.0 | 1.3 | 1.0 |
Dec 2017 | 1.2 | 1.0 | 1.1 | 1.3 | 1.0 |
Jan 2018 | 1.2 | 1.1 | 1.3 | 1.3 | 1.1 |
Feb 2018 | 1.2 | 1.1 | 1.3 | 1.2 | 1.1 |
Mar 2018 | 1.2 | 1.1 | 1.2 | 1.2 | 1.1 |
Apr 2018 | 1.1 | 1.0 | 1.1 | 1.1 | 1.0 |
May 2018 | 1.0 | 1.0 | 0.9 | 1.0 | 0.9 |
Jun 2018 | 1.0 | 0.9 | 0.8 | 1.1 | 0.9 |
Jul 2018 | 1.0 | 0.8 | 0.8 | 1.1 | 0.9 |
Aug 2018 | 1.0 | 0.8 | 0.9 | 1.2 | 0.9 |
Sep 2018 | 0.9 | 0.8 | 0.9 | 1.2 | 0.8 |
Oct 2018 | 0.9 | 0.8 | 0.8 | 1.1 | 0.8 |
Nov 2018 | 0.8 | 0.8 | 0.8 | 1.2 | 0.8 |
Dec 2018 | 0.9 | 0.7 | 0.8 | 1.3 | 0.8 |
Jan 2019 | 1.0 | 0.8 | 0.9 | 1.4 | 0.9 |
Feb 2019 | 1.1 | 0.8 | 1.0 | 1.4 | 0.9 |
Mar 2019 | 1.1 | 0.8 | 0.9 | 1.4 | 0.9 |
Apr 2019 | 1.0 | 0.7 | 0.9 | 1.1 | 0.8 |
May 2019 | 0.8 | 0.7 | 0.8 | 1.0 | 0.8 |
Jun 2019 | 0.8 | 0.6 | 0.8 | 0.9 | 0.8 |
Jul 2019 | 0.8 | 0.7 | 0.8 | 1.0 | 0.8 |
Aug 2019 | 0.8 | 0.8 | 0.9 | 1.1 | 0.9 |
Sep 2019 | 0.8 | 0.8 | 0.9 | 1.2 | 0.8 |
Oct 2019 | 0.8 | 0.8 | 0.8 | 1.1 | 0.8 |
Nov 2019 | 0.8 | 0.8 | 0.7 | 1.0 | 0.8 |
Dec 2019 | 0.8 | 0.8 | 0.7 | 1.0 | 0.8 |