
Ever wonder how many accountants there are in the United States? Or how much an occupational therapist gets paid? Or maybe you already have a job, but you’re thinking about working somewhere new. What areas or industries have the highest pay for your occupation?
We have the answers to these questions, plus much, much more!
The Occupational Employment Statistics (OES) survey publishes hundreds of thousands of estimates for employment and wages covering around 800 detailed occupations in 600 areas spanning all 50 states, the District of Columbia, and three territories: Guam, Puerto Rico, and the U.S. Virgin Islands.
That sounds impressive, but what does it mean? It means you can see employment and wages for occupations where you live or in the type of business where you work. OES provides specific information on the types of jobs found in each industry or area and their wages.
OES building blocks: occupation and industry
Before we dive into the deep end with data, let’s wade in a little by clarifying some terms. In our everyday lives, occupation and industry may be interchangeable, but in fact occupation refers to the worker and industry refers to the employer.
Occupation refers to what people do and the jobs people have. BLS uses the Standard Occupational Classification system to code workers into more than 800 different occupations based on their job duties. This system is the standard used by federal agencies to classify workers into occupations.
Industry refers to the types of businesses where people work. BLS uses the North American Industry Classification System to code business establishments into industries based on what they produce or sell. This also is the standard used by federal agencies to classify business establishments into industries.
Because we use these federally mandated coding structures, data users can easily compare OES data with other federal statistical programs.
Why does OES data count?
For this blog post, we will only focus on national level data. We’re saving state and area data for a later post. Let’s take a closer look at the occupational data for the United States and in certain industries.
People count on OES data to see employment by occupation
Did you know that the largest occupation in the United States is retail salespersons? This chart shows the 10 largest occupations, which together account for more than one in five jobs in the United States.

Editor’s note: Data for this chart are available in the table below.
According to May 2017 OES data, there were 4.4 million retail salespersons in the United States, accounting for 3 percent of all jobs. The largest three occupations combined account for 8 percent of all U.S. jobs and also include cashiers and combined food preparation and serving workers (each 3.6 million).
We also have data on some of the smallest occupations in the country, such as geographers, watch repairers, astronomers, fabric menders, and mine shuttle car operators. Each of these occupations has fewer than 5,000 jobs.
People count on OES data for wages by occupation
Eight of the 10 largest occupations in the United States had below-average wages. Retail salespersons ($27,460), combined food preparation and serving workers ($21,230), and cashiers ($22,130) had annual mean wages significantly below the average for all occupations of $50,620.
Registered nurses ($73,550) and general and operations managers ($123,460) were the largest occupations with above-average wages.
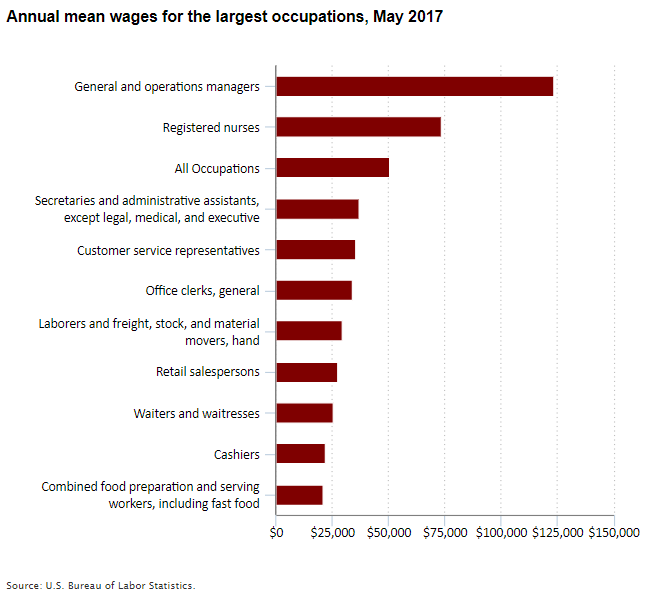
Editor’s note: Data for this chart are available in the table below.
People count on OES data to compare occupations
Occupational employment and wage information is useful to students and schools making investments in education. They can see which fields have the best prospects for getting a job with good wages.
The pairs of related occupations in the table below show wages are generally higher for the occupation with more education and training requirements. In many cases employment is higher in the occupation with more education or training, and in some cases employment is lower.
Median wage and employment data by select occupations, May 2017
| Occupation | Median hourly wage | Employment |
| Mechanical Drafters | $26.50 | 58,190 |
| Mechanical Engineers | $41.29 | 291,290 |
| Cooks, Restaurant | $12.10 | 1,276,510 |
| Chefs and Head Cooks | $22.09 | 131,430 |
| Shampooers | $9.77 | 13,330 |
| Hairdressers, Hairstylists, and Cosmetologists | $11.95 | 351,910 |
| Retail Salespersons | $11.16 | 4,442,090 |
| First-Line Supervisors of Retail Sales Workers | $18.54 | 1,200,180 |
| Bookkeeping, Accounting, and Auditing Clerks | $18.87 | 1,532,340 |
| Accountants and Auditors | $33.34 | 1,241,000 |
| Dental Assistants | $18.09 | 337,160 |
| Dental Hygienists | $35.61 | 211,600 |
| Light Truck or Delivery Services Drivers | $15.12 | 877,670 |
| Heavy and Tractor-Trailer Truck Drivers | $20.42 | 1,748,140 |
People count on OES data to see the types of jobs in each industry
OES data can complement other BLS data by showing the different types of jobs in each industry. For example, healthcare and social assistance is one of the largest industries in the United States. OES data show the types of jobs in this industry. This chart shows the 10 largest occupations in the health care and social assistance industry.
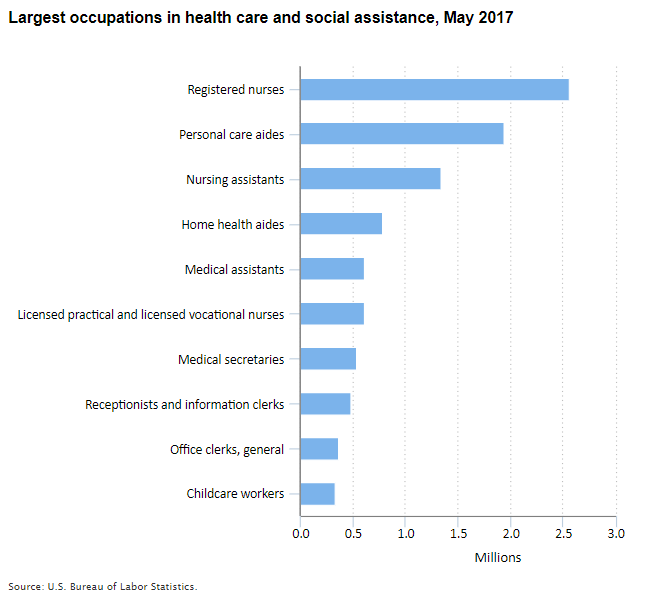
Editor’s note: Data for this chart are available in the table below.
Although many of the largest occupations in health care and social assistance are concentrated in this industry, some of the largest occupations in this sector, such as childcare workers, general office clerks, and receptionists and information clerks, can be found in many other industries as well. Jobseekers or workers wanting to increase their wage can use OES data to see which industries pay more by occupation.
The top paying industries for receptionists and information clerks include utilities ($34,780), construction ($31,070), and manufacturing ($30,900), in addition to health care and social assistance ($30,840). According to the May 2017 OES estimates, the national average annual wage for receptionists and information clerks was $29,640.

Editor’s note: Data for this chart are available in the table below.
Who uses OES data?
Employers frequently use OES data for their industry. Business startups and entrepreneurs use the data to help determine typical staffing needs and expenses for businesses similar to theirs. Established businesses use occupational wage distributions to ensure they remain competitive and retain and attract good workers. In addition, OES data are used by students, jobseekers, and career advisors to help with career planning.
You may also encounter OES data in other places, because the data are used by a number of other federal agencies. The BLS Employment Projections program uses industry staffing patterns and wages from OES to produce estimates of future job growth. The U.S. Department of Labor Office of Foreign Labor Certification uses OES data to set prevailing wages for visa applicants. The Bureau of Economic Analysis uses OES wages to estimate social security receipts. The Centers for Medicare and Medicaid Services use the data to set reimbursement rates for health care providers. These are just a few of the ways OES data are used by other government programs and agencies.
Want to know more?
You can further explore all of the reasons why OES data count at the OES homepage. Read the latest OES news release, get answers to frequently asked questions and check out our maps. Also, contact the OES information staff with questions by email or call (202) 691-6569.
Use these gold-standard data to learn more about your current occupation or to find out about new ones. Whatever your occupational employment question, “We have a stat for that!”
| Occupation | Employment |
|---|---|
| Retail salespersons | 4,442,090 |
| Combined food preparation and serving workers, including fast food | 3,576,220 |
| Cashiers | 3,564,920 |
| Office clerks, general | 2,967,620 |
| Registered nurses | 2,906,840 |
| Customer service representatives | 2,767,790 |
| Laborers and freight, stock, and material movers, hand | 2,711,320 |
| Waiters and waitresses | 2,584,220 |
| Secretaries and administrative assistants, except legal, medical, and executive | 2,254,820 |
| General and operations managers | 2,212,200 |
| Occupation | Annual mean wage |
|---|---|
| General and operations managers | $123,460 |
| Registered nurses | 73,550 |
| All Occupations | 50,620 |
| Secretaries and administrative assistants, except legal, medical, and executive | 36,920 |
| Customer service representatives | 35,650 |
| Office clerks, general | 33,910 |
| Laborers and freight, stock, and material movers, hand | 29,690 |
| Retail salespersons | 27,460 |
| Waiters and waitresses | 25,280 |
| Cashiers | 22,130 |
| Combined food preparation and serving workers, including fast food | 21,230 |
| Occupation | Employment |
|---|---|
| Registered nurses | 2,557,530 |
| Personal care aides | 1,944,270 |
| Nursing assistants | 1,344,390 |
| Home health aides | 783,910 |
| Medical assistants | 614,180 |
| Licensed practical and licensed vocational nurses | 608,080 |
| Medical secretaries | 539,680 |
| Receptionists and information clerks | 478,800 |
| Office clerks, general | 364,060 |
| Childcare workers | 330,090 |
| Industry | Annual mean wage |
|---|---|
| Utilities | $34,780 |
| Management of companies and enterprises | 31,970 |
| Finance and insurance | 31,180 |
| Transportation and warehousing | 31,110 |
| Wholesale trade | 31,080 |
| Construction | 31,070 |
| Manufacturing | 30,900 |
| Health care and social assistance | 30,840 |
| Federal, state, and local government, excluding state and local schools and hospitals and the U.S. Postal Service | 30,710 |
| Mining, quarrying, and oil and gas extraction | 30,710 |