
Strikes and lockouts? Aren’t those 1940s-50s-60s economic activities? Sounds like we are taking a trip to the distant past with Sherman and Mr. Peabody in the WABAC machine. (For you younger readers, these characters can be found in the Adventures of Rocky and Bullwinkle and Friends, a TV show from the early 1960s.) BLS first collected data on labor and management disputes (work stoppages) in the 1880s. BLS has continuously published work stoppage information since 1947, for events covering at least 1,000 workers. Recently, high profile work stoppages by public school teachers and others have kept these types of activities in the news.
What are work stoppages?
The work stoppages program provides monthly and annual data on major work stoppages involving 1,000 or more workers and lasting one full shift or longer. For this report, BLS does not differentiate between strikes and lockouts.
- Strikes are a temporary stoppage of work by a group of employees to express a grievance, enforce a demand, or protest the terms, conditions, or provisions of a contract.
- Lockouts are a temporary denial of employment by management.
Detailed monthly reports from 1993 to the present provide the organizations and unions involved, along with the locations, industries, number of workers directly involved, and days of idleness.
Who uses these data?
Work stoppages provide media, researchers, labor relations specialists, unions, and government agencies with information about labor-management disputes. While the work stoppages program does not report on the nature of the dispute, identifying the details of parties involved helps users assess the impact of compensation trends, union membership and activity, and legislation.
Has work stoppage activity changed over time?
Since BLS began reporting on work stoppages, declines in union membership, the growth of the service industry, technological changes, and other factors have led to a significant reduction in the number of work stoppages. Between 1947 and 1956, there were 3,438 work stoppages. In the decade from 2007 to 2016, there were 143 stoppages. In 2017, there were 7 work stoppages, and in 2018 there were 20.
Editor’s note: Data for this chart are available in the table below.
Editor’s note: Data for this chart are available in the table below.
Decreases in the number of work stoppages and the number of workers involved are especially noticeable during recessions. These levels reached an all-time low at the end of the 2007–09 recession. In 1952, there were 2,746,000 workers involved in work stoppages, whereas in 2018 there were 485,000 workers involved.
Editor’s note: Data for this chart are available in the table below.
Another way to evaluate the impact of work stoppages on the national economy is by looking at the number of days workers are away from work because of strikes or lockouts. The number of days of idleness reached a peak in 1959, at about 60,850,000 days. The second largest number was in 1970, with 52,761,000 of days of idleness. In 2018, there were 2,815,400 days of idleness. 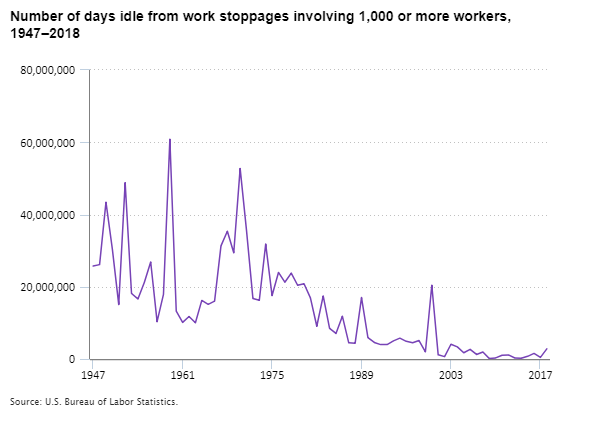
Editor’s note: Data for this chart are available in the table below.
Where are work stoppages most prevalent?
Of the 559 major work stoppages between 1993 and 2018, 423 occurred in private industry, 95 in local government, 40 in state government, and 1 in both state and local government. Most stoppages during that period, 458, occurred within individual states, while 101 occurred in two or more states. California, the state with the largest share of national employment (13.6 percent), had the largest share of work stoppages, 24.2 percent. Texas, which accounts for 9.6 percent of national employment, accounted for 2.9 percent of all work stoppages (excluding interstate and nationally reported stoppages).
Editor’s note: Data for this chart are available in the table below.
These data also allow users to evaluate differences in the number of work stoppages by industry. From 1993 to 2018, there were almost as many stoppages in manufacturing (158) as the next two industries combined. Health care and social assistance had 83 work stoppages, while educational services had 79 work stoppages. Of the 79 educational services stoppages, 75 were in state and local government, with 50 occurring in local government and 25 in state government.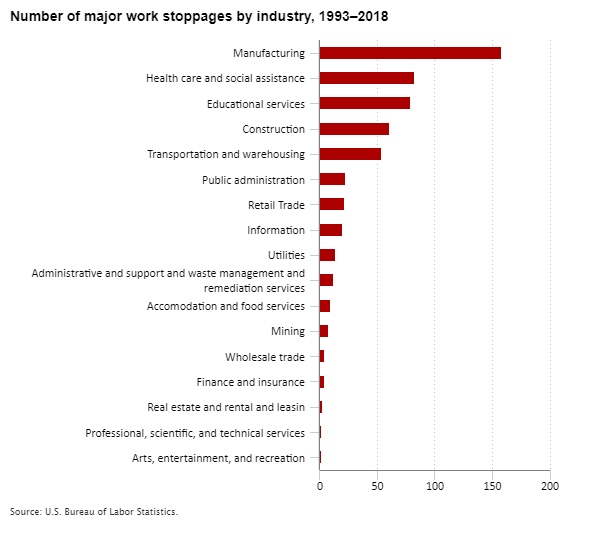
Editor’s note: Data for this chart are available in the table below.
Want to know more?
- Read the latest work stoppages news release.
- Get answers to frequently asked questions.
- Contact staff directly by email or call (202) 691-6199.
We hope this discussion of work stoppages and a look to the past was almost as good as using the WABAC machine!
| Decade | Number |
|---|---|
| 1947–1956 | 3,438 |
| 1957– 1966 | 2,500 |
| 1967–1976 | 3,321 |
| 1977–1986 | 1,446 |
| 1987–1996 | 404 |
| 1997–2006 | 240 |
| 2007–2016 | 140 |
| Year | Number of work stoppages | Number of workers involved | Number of days idle |
|---|---|---|---|
| 1947 | 270 | 1,629,000 | 25,720,000 |
| 1948 | 245 | 1,435,000 | 26,127,000 |
| 1949 | 262 | 2,537,000 | 43,420,000 |
| 1950 | 424 | 1,698,000 | 30,390,000 |
| 1951 | 415 | 1,462,000 | 15,070,000 |
| 1952 | 470 | 2,746,000 | 48,820,000 |
| 1953 | 437 | 1,623,000 | 18,130,000 |
| 1954 | 265 | 1,075,000 | 16,630,000 |
| 1955 | 363 | 2,055,000 | 21,180,000 |
| 1956 | 287 | 1,370,000 | 26,840,000 |
| 1957 | 279 | 887,000 | 10,340,000 |
| 1958 | 332 | 1,587,000 | 17,900,000 |
| 1959 | 245 | 1,381,000 | 60,850,000 |
| 1960 | 222 | 896,000 | 13,260,000 |
| 1961 | 195 | 1,031,000 | 10,140,000 |
| 1962 | 211 | 793,000 | 11,760,000 |
| 1963 | 181 | 512,000 | 10,020,000 |
| 1964 | 246 | 1,183,000 | 16,220,000 |
| 1965 | 268 | 999,000 | 15,140,000 |
| 1966 | 321 | 1,300,000 | 16,000,000 |
| 1967 | 381 | 2,192,000 | 31,320,000 |
| 1968 | 392 | 1,855,000 | 35,367,000 |
| 1969 | 412 | 1,576,000 | 29,397,000 |
| 1970 | 381 | 2,468,000 | 52,761,000 |
| 1971 | 298 | 2,516,000 | 35,538,000 |
| 1972 | 250 | 975,000 | 16,764,000 |
| 1973 | 317 | 1,400,000 | 16,260,000 |
| 1974 | 424 | 1,796,000 | 31,809,000 |
| 1975 | 235 | 965,000 | 17,563,000 |
| 1976 | 231 | 1,519,000 | 23,962,000 |
| 1977 | 298 | 1,212,000 | 21,258,000 |
| 1978 | 219 | 1,006,000 | 23,774,000 |
| 1979 | 235 | 1,021,000 | 20,409,000 |
| 1980 | 187 | 795,000 | 20,844,000 |
| 1981 | 145 | 729,000 | 16,908,000 |
| 1982 | 96 | 656,000 | 9,061,000 |
| 1983 | 81 | 909,000 | 17,461,000 |
| 1984 | 62 | 376,000 | 8,499,000 |
| 1985 | 54 | 324,000 | 7,079,000 |
| 1986 | 69 | 533,000 | 11,861,000 |
| 1987 | 46 | 174,000 | 4,481,000 |
| 1988 | 40 | 118,000 | 4,381,000 |
| 1989 | 51 | 452,000 | 16,996,000 |
| 1990 | 44 | 185,000 | 5,926,000 |
| 1991 | 40 | 392,000 | 4,584,000 |
| 1992 | 35 | 364,000 | 3,989,000 |
| 1993 | 35 | 182,000 | 3,981,000 |
| 1994 | 45 | 322,000 | 5,021,000 |
| 1995 | 31 | 192,000 | 5,771,000 |
| 1996 | 37 | 273,000 | 4,889,000 |
| 1997 | 29 | 339,000 | 4,497,000 |
| 1998 | 34 | 387,000 | 5,116,000 |
| 1999 | 17 | 73,000 | 1,996,000 |
| 2000 | 39 | 394,000 | 20,419,000 |
| 2001 | 29 | 99,000 | 1,151,000 |
| 2002 | 19 | 46,000 | 659,600 |
| 2003 | 14 | 129,200 | 4,091,200 |
| 2004 | 17 | 170,700 | 3,344,100 |
| 2005 | 22 | 99,600 | 1,736,100 |
| 2006 | 20 | 70,100 | 2,687,500 |
| 2007 | 21 | 189,200 | 1,264,800 |
| 2008 | 15 | 72,200 | 1,954,100 |
| 2009 | 5 | 12,500 | 124,100 |
| 2010 | 11 | 44,500 | 302,300 |
| 2011 | 19 | 112,500 | 1,020,200 |
| 2012 | 19 | 148,100 | 1,130,800 |
| 2013 | 15 | 54,500 | 289,900 |
| 2014 | 11 | 34,300 | 200,200 |
| 2015 | 12 | 47,300 | 740,000 |
| 2016 | 15 | 99,400 | 1,543,400 |
| 2017 | 7 | 25,300 | 439,800 |
| 2018 | 20 | 485,200 | 2,815,400 |
| State | Share of national employment | Share of major work stoppages |
|---|---|---|
| California | 13.6% | 24.2% |
| Texas | 9.6 | 2.9 |
| New York | 6.7 | 8.8 |
| Florida | 7.1 | 0.7 |
| Pennsylvania | 4.4 | 8.1 |
| Illinois | 4.4 | 9.1 |
| Ohio | 4.0 | 7.5 |
| Georgia | 3.5 | 1.3 |
| Michigan | 3.4 | 6.3 |
| North Carolina | 3.4 | 1.1 |
| New Jersey | 3.1 | 3.8 |
| Industry | Number of stoppages |
|---|---|
| Manufacturing | 158 |
| Health care and social assistance | 83 |
| Educational services | 79 |
| Construction | 61 |
| Transportation and warehousing | 54 |
| Public administration | 23 |
| Retail Trade | 22 |
| Information | 20 |
| Utilities | 14 |
| Administrative and support and waste management and remediation services | 12 |
| Accomodation and food services | 10 |
| Mining | 8 |
| Wholesale trade | 4 |
| Finance and insurance | 4 |
| Real estate and rental and leasin | 3 |
| Professional, scientific, and technical services | 2 |
| Arts, entertainment, and recreation | 2 |