
On April 16, BLS reported that median weekly earnings for full-time wage and salary workers rose 2.7 percent over the year.
On April 30, BLS reported that the Employment Cost Index for wages of private industry workers rose 3.0 percent over the year.
On May 2, BLS reported that hourly compensation in the nonfarm business sector rose 2.5 percent over the year.
On May 3, BLS reported that average hourly earnings for private industry workers rose 3.2 percent over the year.
What’s going on here? Why so much wage information? And which one is RIGHT?
At BLS, we get questions like this all the time, and the answer is usually “it depends.” There is no one answer that fits every question on wages; there are just different answers depending on what you want to measure. People come to BLS looking for all kinds of answers, and we want to provide as much information as we can. Thus, we have many measures of wages (and other forms of compensation) — a dozen, to be exact.
Do you want to know about wages for an industry? An occupation? By location? For men and women? Based on education? Adjusted for inflation? Including benefits? How wages relate to spending patterns? How wages relate to worker productivity? BLS has it all, and more.
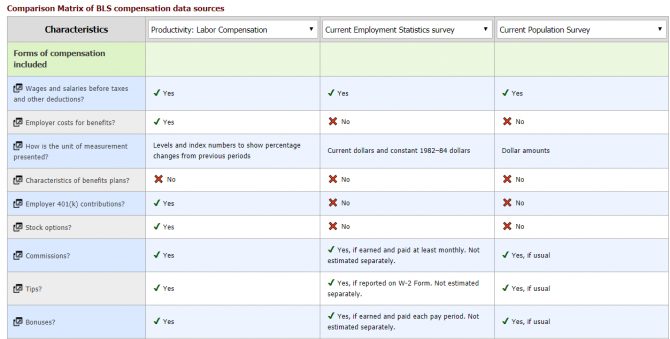
We have so much wage information that even we get confused. So we developed a tool to make the dozen wage series a little easier to understand. It’s an interactive guide that lists all 12 data sources and 32 key details about each of those sources, like how often it is available.
I can hear you now — that’s 384 pieces of information (12 x 32). I’m just looking for one piece of information, not almost 400. And how do you fit all that information on one page, anyway?
The interactive guide limits the display to 3 sources at a time — you pick the sources you want to see.
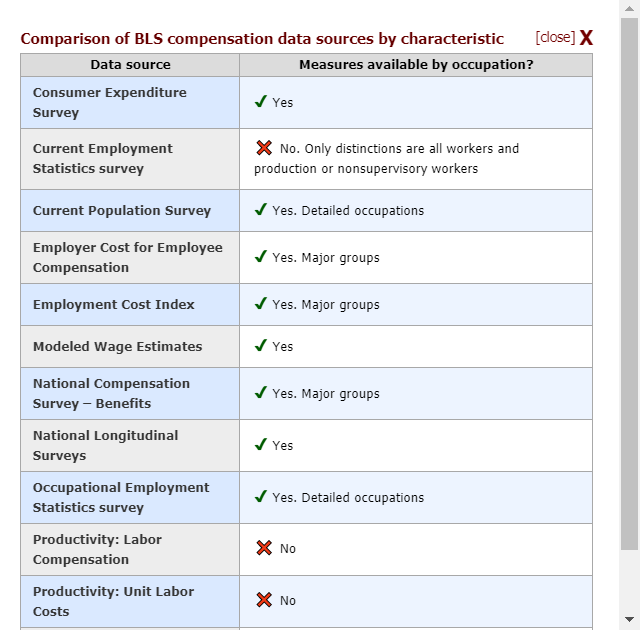
Or you can pick one characteristic, like “measures available by occupation” and get an answer for all 12 data sources.
This tool is on the BLS beta site. We want you to give it a try and provide feedback. Check it out and leave us a comment. Want to know even more? Watch this video that helps make sense of BLS wage information.