
The Current Employment Statistics survey helps us track employment trends in the economy. The headline figures, such as the 164,000 increase in payroll employment in April, are seasonally adjusted. Seasonal adjustment smooths out increases or decreases that occur around the same time each year to make it easier to see the underlying movements in the data.
Consider the construction industry, where employment varies throughout the year, often because of the weather. The chart below shows employment each month in 2017, both seasonally adjusted and not seasonally adjusted. The not seasonally adjusted level ranged from about 6.4 million to 7.2 million jobs, but it is hard to see a trend. The seasonally adjusted level was consistently between 6.8 million and 7.1 million jobs. When we remove the seasonal variation, we can see a slight increase in construction employment over the year.
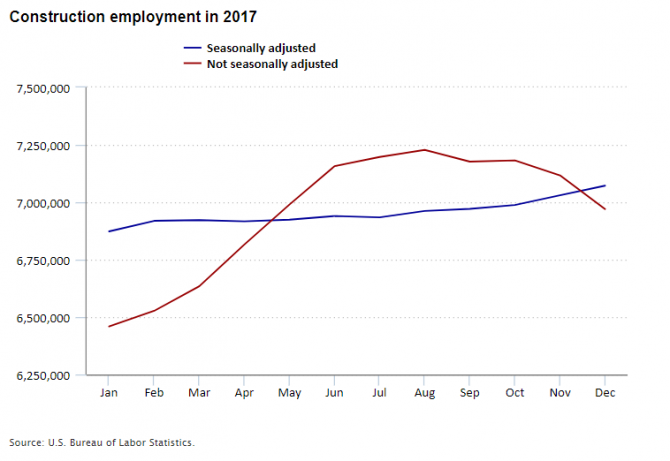
Editor’s note: Data for this chart are available in the table below.
While seasonally adjusted data help us see long-term trends, there are times when short-term trends can provide some insight. One example is holiday-season hiring. Certain industries, such as retail trade and parcel delivery services, ramp up hiring in the fall to prepare for increased business during the holiday season. We can see this holiday-related employment buildup with data that are not seasonally adjusted. For example, employment growth in selected retail trade industries increased by 609,000 from October to December 2017, less than the 650,000 jobs gained in the same months of 2016.
Note: Selected retail trade industries include furniture and home furnishings stores; electronics and appliance stores; health and personal care stores; clothing and clothing accessories stores; sporting goods, hobby, book and music stores; general merchandise stores; miscellaneous store retailers; and nonstore retailers.
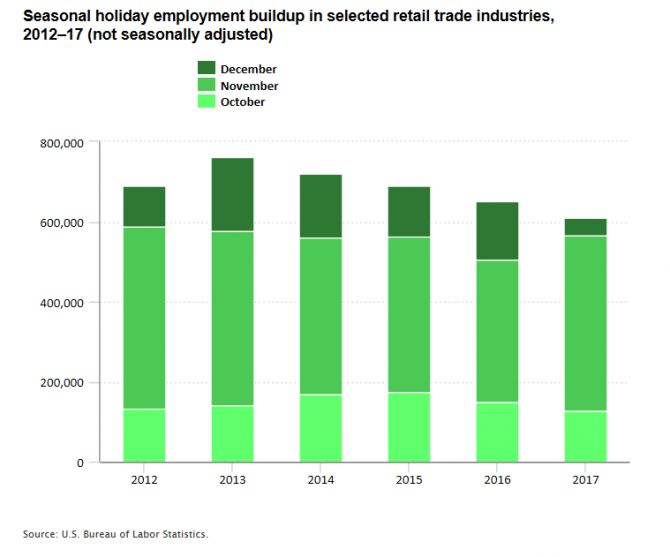
Editor’s note: Data for this chart are available in the table below.
We have to be careful when we use data that are not seasonally adjusted. For example, sometimes there are 4 weeks between monthly surveys and sometimes there are 5 weeks. Seasonal adjustment accounts for these differences. When using not seasonally adjusted data, users must be aware that an extra week between surveys can exaggerate seasonal employment increases or decreases. For example, in 2017, there were 5 weeks between surveys in November, just as there were in 2012 and 2013.
Looking across the October-to-December period, the seasonal employment buildup in retail trade slowed each year following a large increase from 2012 to 2013. In each of the next four holiday seasons, job gains over the 3-month (13-week) period were less than the prior year. But 2017 included some anomalies – a strong November (72 percent of the seasonal total), followed by a weak December (7 percent of the seasonal total).
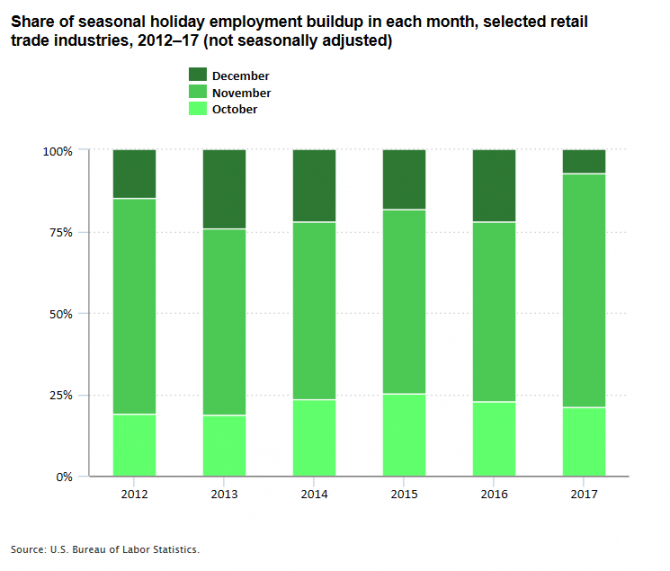
Editor’s note: Data for this chart are available in the table below.
Examining the not seasonally adjusted data may provide some insights into changing hiring patterns, especially in seasonal industries. The 2017 retail trade data suggest declining holiday employment buildup but also earlier holiday employment buildup. Will this pattern continue? We’ll know more when Current Employment Statistics data come out later this year.
We can analyze other industries with seasonal patterns in a similar way. One industry is transportation, and specifically couriers and messengers, which includes parcel delivery services. As the trend in online shopping continues, employment in parcel delivery services has increased, especially during the holiday season. Other seasonal industries include ski resorts in the winter, gardening shops in the spring, and amusement parks in the summer. We can also use not seasonally adjusted data to look at layoff patterns in seasonal industries, such as certain retail industries after the holiday season.
All these data are available from the Current Employment Statistics program.
| Month | Seasonally adjusted | Not seasonally adjusted |
|---|---|---|
| Jan | 6,873,000 | 6,459,000 |
| Feb | 6,919,000 | 6,527,000 |
| Mar | 6,922,000 | 6,634,000 |
| Apr | 6,917,000 | 6,816,000 |
| May | 6,924,000 | 6,990,000 |
| Jun | 6,940,000 | 7,157,000 |
| Jul | 6,934,000 | 7,197,000 |
| Aug | 6,962,000 | 7,228,000 |
| Sep | 6,971,000 | 7,177,000 |
| Oct | 6,988,000 | 7,182,000 |
| Nov | 7,030,000 | 7,117,000 |
| Dec | 7,072,000 | 6,970,000 |
| Year | October | November | December |
|---|---|---|---|
| 2012 | 132,000 | 456,000 | 103,000 |
| 2013 | 142,000 | 435,000 | 184,000 |
| 2014 | 169,000 | 392,000 | 158,000 |
| 2015 | 175,000 | 389,000 | 127,000 |
| 2016 | 148,000 | 358,000 | 144,000 |
| 2017 | 128,000 | 438,000 | 43,000 |
| Year | October | November | December |
|---|---|---|---|
| 2012 | 19.1% | 66.0% | 14.9% |
| 2013 | 18.7 | 57.2 | 24.2 |
| 2014 | 23.5 | 54.5 | 22.0 |
| 2015 | 25.3 | 56.3 | 18.4 |
| 2016 | 22.8 | 55.1 | 22.2 |
| 2017 | 21.0 | 71.9 | 7.1 |