
You may know New Jersey for its Turnpike, its Parkway, and ribbons of highways crisscrossing the state, but new information shows that New Jersey households have fewer vehicles than the U.S. average. New Jersey households have an average of 1.4 vehicles, compared with an average of 1.8 vehicles nationwide.
This is just one of the tidbits we can glean from experimental state weights in the Consumer Expenditure Survey just released for New Jersey. Producing state estimates is part of our continuing plan to expand the use of data on consumer spending. The first available state weights are for New Jersey. We hope to release weights for more states in the coming months.
The survey is a nationwide household survey designed to find out how U.S. consumers spend their money. It is the only federal government survey that provides information on the full range of consumer spending, incomes, and demographic characteristics. One way BLS uses the consumer spending data is to create the market basket of goods and services tracked in the Consumer Price Index. Besides the spending information, the survey also collects the demographic characteristics of survey respondents. The new state weights allow us to examine what the typical New Jersey household looks like.
New Jersey looks similar to the United States as a whole, and even more similar to the New York metro area, which encompasses much of the northern part of New Jersey. One notable difference between New Jersey and other areas is the number of vehicles. Transportation in the Consumer Expenditure Survey includes vehicle purchases and gasoline and other car-related expenses. We would expect to see lower transportation spending in New Jersey compared with the nation because of fewer vehicles present in the state and other reasons.
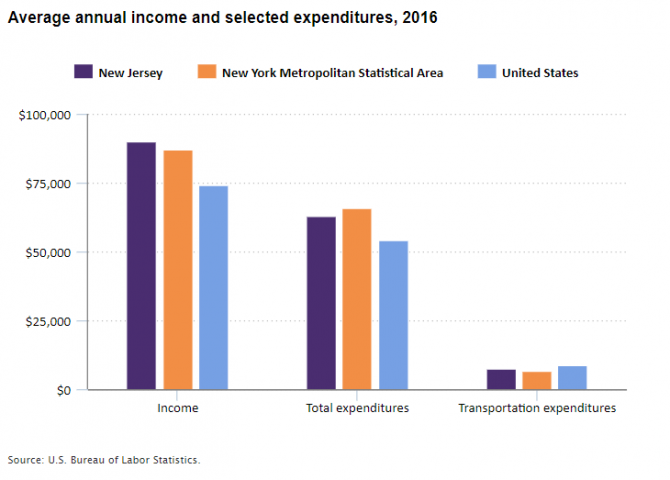
Editor’s note: Data for this chart are available in the table below.
Now that we can produce statistically valid state estimates from the survey, we can answer all kinds of interesting questions. Many researchers look at different spending categories to examine public policies and to evaluate how certain decisions affect consumer behavior. Because we can now use the survey data to make estimates for certain states, researchers can explore these kinds of questions with more geographic detail. The chart below shows how New Jersey compares with the New York metro area and the nation in five of the broadest spending categories.
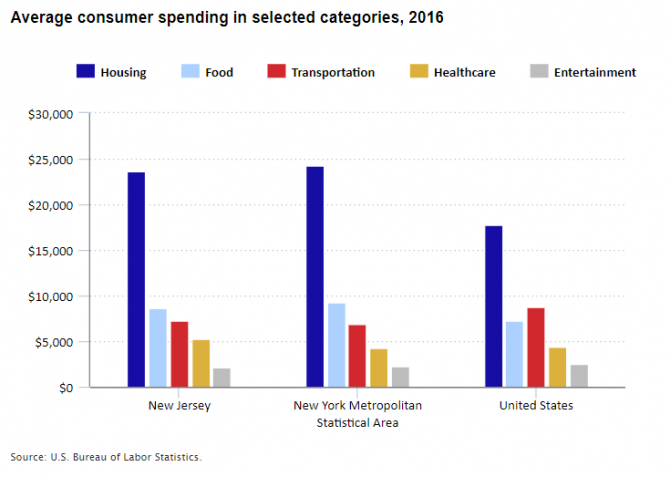
Editor’s note: Data for this chart are available in the table below.
Policymakers, researchers, and other data users have often asked for data about spending habits and income for states. Many times, household surveys just do not have enough sample to provide reliable estimates for all possible user needs. With our continuing improvements to the Consumer Expenditure Survey, we are learning which states provide enough responses for us to produce statistically valid state estimates. Once we create these weights for the states that can support them, data users will be able to explore a wider range of questions about consumer spending.
You can learn more from BLS economist Taylor Wilson’s article, “Consumer spending by state: BLS puts New Jersey to the test.”
| Measure | New Jersey | New York Metropolitan Statistical Area | United States |
|---|---|---|---|
| Income | $89,927 | $87,212 | $74,069 |
| Total expenditures | 63,100 | 65,764 | 54,157 |
| Transportation expenditures | 7,295 | 6,828 | 8,755 |
| Geography | Housing | Food | Transportation | Healthcare | Entertainment |
|---|---|---|---|---|---|
| New Jersey | $23,617 | $8,641 | $7,295 | $5,239 | $2,097 |
| New York Metropolitan Statistical Area | 24,308 | 9,190 | 6,828 | 4,260 | 2,277 |
| United States | 17,774 | 7,203 | 8,755 | 4,373 | 2,497 |