
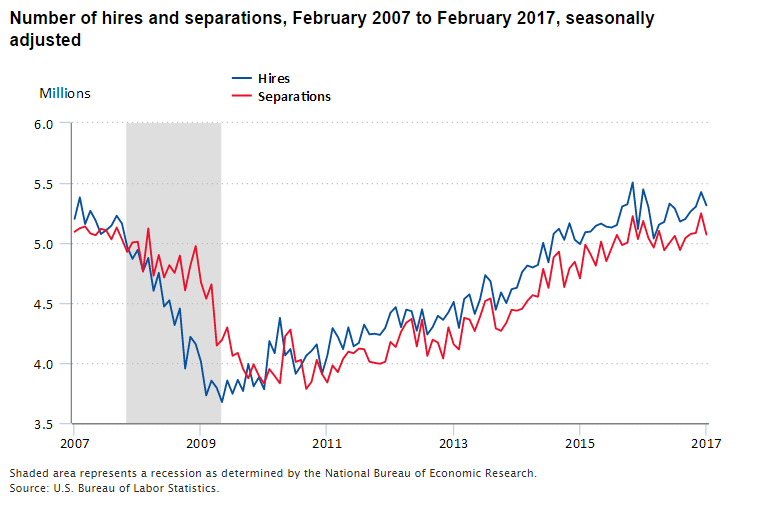
Looking solely at net employment change is similar to looking at the surface of a lake. You’ll see ripples and changes, but there’s a whole lot of activity going on underneath the surface. Using JOLTS data—the Job Openings and Labor Turnover Survey—provides a peek at what’s going on below the surface of net employment change.
The basics
JOLTS is a monthly survey of 16,000 establishments that asks employers to provide information on the number of job openings (as of the last business day of the month) and the total number of hires and separations that occurred throughout the month. By asking for the total number of hires and separations over the entire month, we can get a sense of just how many jobs started and ended within a month. For example, in February 2017 there were 5.3 million hires and 5.1 million separations. That’s approximately the population of Colorado moving in and out of jobs in a single month!
Editor’s note: A text-only version of the graphic is below.
Understanding the churn
You may be familiar with the headline payroll employment number that comes out each month, with information on how many net jobs were gained or lost. However, JOLTS data give us insight on what goes on beyond the monthly employment data. JOLTS data show us just how dynamic the U.S. labor market is and can illuminate which industries have persistent unmet demand for workers.
Movement into and out of jobs is often called “churn.” As the rates of hires and separations climb, this increased “churn” can signal a healthy labor market where workers can move in and out of jobs with relative ease. Similarly, when rates of hires and separations fall, workers may have more difficulty moving from job to job.
JOLTS data can also give us insight into labor market changes before the net employment figures can. In the last recession, the hiring rate started to decelerate before payroll employment slowed.
Further insight into industries
Labor market activity differs by industry. By using the combination of hires and job openings rates, we can explore which industries have persistent low-level demand for workers and which industries may have a high unmet demand for workers. When the openings rate exceeds the hiring rate, the industry has an unmet demand for workers.
Consider jobs in construction, retail trade, and accommodation and food services. There are fewer job openings than hires in these industries, suggesting that employers can easily find workers. Many jobs in these industries require minimal training or experience, which means it is easy to find workers. It may also mean that workers don’t stay with one employer for very long. JOLTS data confirm this. These industries have high churn, with large numbers of hires and large numbers of separations. Trends in hires and separations tend to move together, meaning employers are frequently replacing workers.
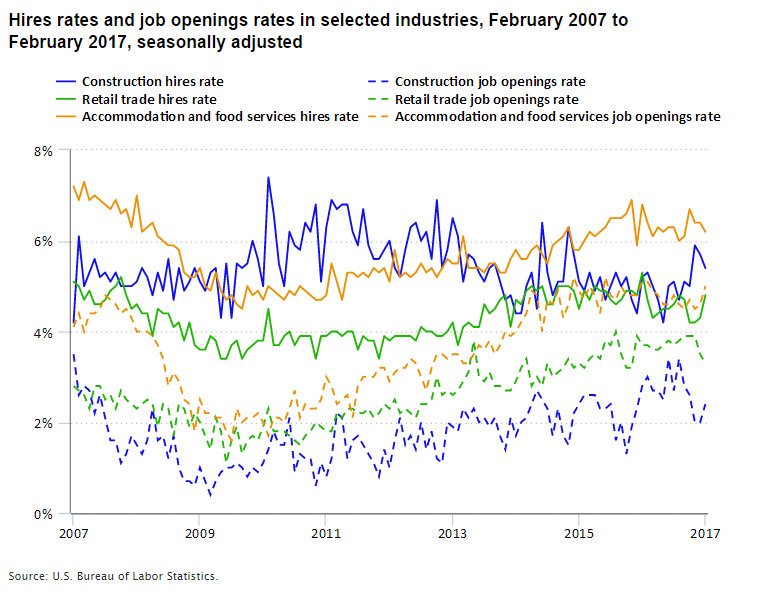
Editor’s note: A text-only version of the graphic is below.
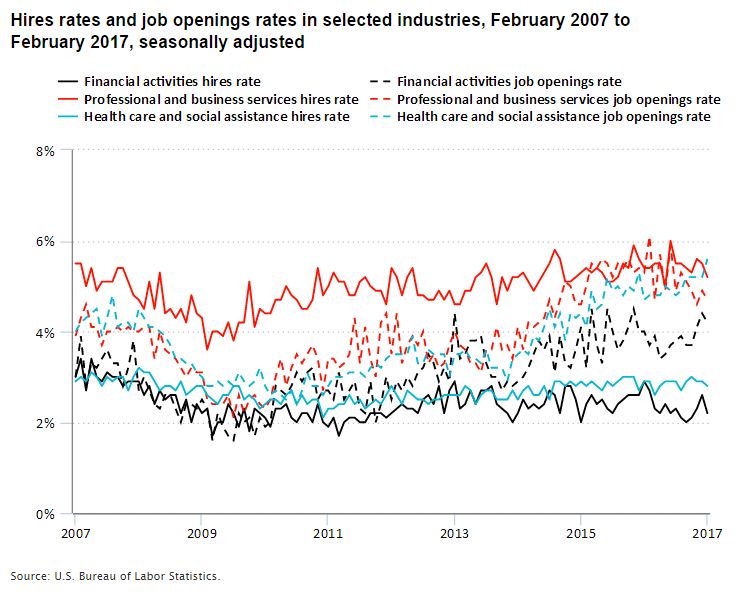
In contrast, many jobs in health care and financial activities require more training and experience, suggesting it may be more difficult to find qualified workers. In these industries, job openings are greater than hires—employers are always looking for qualified workers. These industries also exhibit low churn, stemming from low numbers of hires and separations as a share of industry employment. This suggests workers remain with their employers for longer periods of time.
The professional and business services industry presents an unusual case, perhaps because of the diverse set of occupations within the industry. Included in this industry are many professional service workers, such as those in computer service and engineering firms. But the industry also includes temporary help supply firms and building services, such as janitorial and landscaping firms. Until recently, the industry as a whole had traditionally had more hires than job openings, suggesting an ease in attracting labor. This may be due in part to the number of lower-skilled jobs in this industry. But several times over the past year, job openings have exceeded hires, suggesting that employers need qualified workers. Perhaps this reflects the higher-skilled jobs in this industry. This recent trend bears watching.
Editor’s note: A text-only version of the graphic is below.
Jobs in government and education exhibit both low hiring and low job openings rates. These lower rates indicate that few workers are needed in these industries—workers may tend to stay in these jobs for long periods of time.
For more info on JOLTS, see www.bls.gov/jlt. For more in-depth information on the interaction between job openings and hires, see Charlotte Oslund’s article, “Which industries need workers? Exploring differences in labor market activity.”
| Month | Hires | Separations |
|---|---|---|
| Feb 2007 | 5,202,000 | 5,094,000 |
| Mar 2007 | 5,380,000 | 5,123,000 |
| Apr 2007 | 5,158,000 | 5,138,000 |
| May 2007 | 5,268,000 | 5,080,000 |
| Jun 2007 | 5,187,000 | 5,065,000 |
| Jul 2007 | 5,075,000 | 5,118,000 |
| Aug 2007 | 5,106,000 | 5,105,000 |
| Sep 2007 | 5,145,000 | 5,031,000 |
| Oct 2007 | 5,227,000 | 5,129,000 |
| Nov 2007 | 5,162,000 | 5,031,000 |
| Dec 2007 | 4,968,000 | 4,926,000 |
| Jan 2008 | 4,868,000 | 5,005,000 |
| Feb 2008 | 4,943,000 | 5,010,000 |
| Mar 2008 | 4,766,000 | 4,762,000 |
| Apr 2008 | 4,875,000 | 5,121,000 |
| May 2008 | 4,602,000 | 4,728,000 |
| Jun 2008 | 4,751,000 | 4,900,000 |
| Jul 2008 | 4,471,000 | 4,713,000 |
| Aug 2008 | 4,522,000 | 4,815,000 |
| Sep 2008 | 4,316,000 | 4,751,000 |
| Oct 2008 | 4,454,000 | 4,895,000 |
| Nov 2008 | 3,954,000 | 4,605,000 |
| Dec 2008 | 4,218,000 | 4,814,000 |
| Jan 2009 | 4,158,000 | 4,974,000 |
| Feb 2009 | 4,011,000 | 4,674,000 |
| Mar 2009 | 3,730,000 | 4,536,000 |
| Apr 2009 | 3,853,000 | 4,655,000 |
| May 2009 | 3,793,000 | 4,146,000 |
| Jun 2009 | 3,675,000 | 4,192,000 |
| Jul 2009 | 3,854,000 | 4,297,000 |
| Aug 2009 | 3,744,000 | 4,060,000 |
| Sep 2009 | 3,859,000 | 4,084,000 |
| Oct 2009 | 3,767,000 | 3,951,000 |
| Nov 2009 | 3,992,000 | 3,873,000 |
| Dec 2009 | 3,806,000 | 3,989,000 |
| Jan 2010 | 3,880,000 | 3,894,000 |
| Feb 2010 | 3,781,000 | 3,830,000 |
| Mar 2010 | 4,182,000 | 3,949,000 |
| Apr 2010 | 4,082,000 | 3,892,000 |
| May 2010 | 4,376,000 | 3,831,000 |
| Jun 2010 | 4,064,000 | 4,223,000 |
| Jul 2010 | 4,116,000 | 4,278,000 |
| Aug 2010 | 3,910,000 | 4,009,000 |
| Sep 2010 | 3,978,000 | 4,026,000 |
| Oct 2010 | 4,061,000 | 3,784,000 |
| Nov 2010 | 4,101,000 | 3,843,000 |
| Dec 2010 | 4,155,000 | 4,026,000 |
| Jan 2011 | 3,910,000 | 3,908,000 |
| Feb 2011 | 4,061,000 | 3,838,000 |
| Mar 2011 | 4,291,000 | 3,980,000 |
| Apr 2011 | 4,218,000 | 3,924,000 |
| May 2011 | 4,116,000 | 4,035,000 |
| Jun 2011 | 4,297,000 | 4,094,000 |
| Jul 2011 | 4,139,000 | 4,082,000 |
| Aug 2011 | 4,168,000 | 4,120,000 |
| Sep 2011 | 4,320,000 | 4,115,000 |
| Oct 2011 | 4,239,000 | 4,011,000 |
| Nov 2011 | 4,244,000 | 4,001,000 |
| Dec 2011 | 4,234,000 | 3,994,000 |
| Jan 2012 | 4,292,000 | 4,010,000 |
| Feb 2012 | 4,419,000 | 4,175,000 |
| Mar 2012 | 4,465,000 | 4,134,000 |
| Apr 2012 | 4,299,000 | 4,260,000 |
| May 2012 | 4,445,000 | 4,336,000 |
| Jun 2012 | 4,432,000 | 4,367,000 |
| Jul 2012 | 4,269,000 | 4,138,000 |
| Aug 2012 | 4,447,000 | 4,360,000 |
| Sep 2012 | 4,238,000 | 4,059,000 |
| Oct 2012 | 4,299,000 | 4,194,000 |
| Nov 2012 | 4,393,000 | 4,171,000 |
| Dec 2012 | 4,360,000 | 4,038,000 |
| Jan 2013 | 4,422,000 | 4,297,000 |
| Feb 2013 | 4,509,000 | 4,156,000 |
| Mar 2013 | 4,293,000 | 4,113,000 |
| Apr 2013 | 4,533,000 | 4,376,000 |
| May 2013 | 4,572,000 | 4,363,000 |
| Jun 2013 | 4,409,000 | 4,267,000 |
| Jul 2013 | 4,529,000 | 4,384,000 |
| Aug 2013 | 4,732,000 | 4,517,000 |
| Sep 2013 | 4,681,000 | 4,537,000 |
| Oct 2013 | 4,444,000 | 4,288,000 |
| Nov 2013 | 4,588,000 | 4,268,000 |
| Dec 2013 | 4,500,000 | 4,335,000 |
| Jan 2014 | 4,615,000 | 4,443,000 |
| Feb 2014 | 4,627,000 | 4,436,000 |
| Mar 2014 | 4,758,000 | 4,452,000 |
| Apr 2014 | 4,812,000 | 4,518,000 |
| May 2014 | 4,796,000 | 4,565,000 |
| Jun 2014 | 4,817,000 | 4,552,000 |
| Jul 2014 | 5,001,000 | 4,784,000 |
| Aug 2014 | 4,839,000 | 4,627,000 |
| Sep 2014 | 5,078,000 | 4,882,000 |
| Oct 2014 | 5,118,000 | 4,927,000 |
| Nov 2014 | 5,027,000 | 4,633,000 |
| Dec 2014 | 5,165,000 | 4,789,000 |
| Jan 2015 | 5,027,000 | 4,843,000 |
| Feb 2015 | 4,991,000 | 4,705,000 |
| Mar 2015 | 5,090,000 | 4,986,000 |
| Apr 2015 | 5,095,000 | 4,906,000 |
| May 2015 | 5,143,000 | 4,812,000 |
| Jun 2015 | 5,162,000 | 5,011,000 |
| Jul 2015 | 5,136,000 | 4,849,000 |
| Aug 2015 | 5,129,000 | 4,958,000 |
| Sep 2015 | 5,150,000 | 5,067,000 |
| Oct 2015 | 5,304,000 | 4,983,000 |
| Nov 2015 | 5,323,000 | 5,003,000 |
| Dec 2015 | 5,504,000 | 5,223,000 |
| Jan 2016 | 5,117,000 | 5,033,000 |
| Feb 2016 | 5,447,000 | 5,183,000 |
| Mar 2016 | 5,297,000 | 5,040,000 |
| Apr 2016 | 5,038,000 | 4,962,000 |
| May 2016 | 5,153,000 | 5,101,000 |
| Jun 2016 | 5,176,000 | 4,940,000 |
| Jul 2016 | 5,328,000 | 5,001,000 |
| Aug 2016 | 5,288,000 | 5,059,000 |
| Sep 2016 | 5,179,000 | 4,942,000 |
| Oct 2016 | 5,200,000 | 5,041,000 |
| Nov 2016 | 5,263,000 | 5,075,000 |
| Dec 2016 | 5,303,000 | 5,084,000 |
| Jan 2017 | 5,424,000 | 5,247,000 |
| Feb 2017 | 5,314,000 | 5,071,000 |
| Month | Construction hires rate | Construction job openings rate | Retail trade hires rate | Retail trade job openings rate | Accommodation and food services hires rate | Accommodation and food services job openings rate |
|---|---|---|---|---|---|---|
| Feb 2007 | 4.2 | 3.5 | 5.1 | 2.8 | 7.2 | 4.1 |
| Mar 2007 | 6.1 | 2.6 | 5.0 | 2.7 | 6.9 | 4.4 |
| Apr 2007 | 5.0 | 2.8 | 4.7 | 2.6 | 7.3 | 4.0 |
| May 2007 | 5.3 | 2.7 | 4.9 | 2.3 | 6.9 | 4.4 |
| Jun 2007 | 5.6 | 2.2 | 4.6 | 2.8 | 7.0 | 4.4 |
| Jul 2007 | 5.2 | 2.6 | 4.6 | 2.8 | 6.9 | 4.5 |
| Aug 2007 | 5.3 | 2.1 | 4.7 | 2.5 | 6.8 | 4.8 |
| Sep 2007 | 5.1 | 1.6 | 4.9 | 2.6 | 6.7 | 4.7 |
| Oct 2007 | 5.3 | 1.6 | 5.0 | 2.3 | 6.9 | 4.6 |
| Nov 2007 | 5.0 | 1.1 | 5.2 | 2.7 | 6.6 | 4.4 |
| Dec 2007 | 5.0 | 1.3 | 4.8 | 2.5 | 6.7 | 4.5 |
| Jan 2008 | 5.0 | 1.7 | 4.5 | 2.4 | 6.3 | 4.3 |
| Feb 2008 | 5.1 | 1.5 | 4.6 | 2.3 | 7.0 | 4.0 |
| Mar 2008 | 5.4 | 1.3 | 4.4 | 2.4 | 6.2 | 4.0 |
| Apr 2008 | 5.2 | 1.6 | 4.4 | 2.5 | 6.3 | 4.0 |
| May 2008 | 4.8 | 2.3 | 3.9 | 2.4 | 6.4 | 3.9 |
| Jun 2008 | 5.3 | 1.6 | 4.5 | 1.9 | 6.1 | 3.7 |
| Jul 2008 | 4.9 | 1.7 | 4.4 | 2.4 | 6.0 | 3.4 |
| Aug 2008 | 5.6 | 1.2 | 4.4 | 2.3 | 5.9 | 2.8 |
| Sep 2008 | 4.7 | 1.7 | 4.1 | 1.7 | 5.9 | 3.1 |
| Oct 2008 | 5.4 | 1.0 | 4.2 | 2.4 | 5.8 | 2.9 |
| Nov 2008 | 4.9 | 0.7 | 3.8 | 2.3 | 5.3 | 2.5 |
| Dec 2008 | 5.1 | 0.7 | 4.2 | 1.9 | 5.2 | 2.4 |
| Jan 2009 | 5.4 | 0.6 | 3.7 | 2.2 | 5.2 | 1.8 |
| Feb 2009 | 5.1 | 1.0 | 3.6 | 2.0 | 5.4 | 2.5 |
| Mar 2009 | 4.9 | 0.7 | 3.6 | 1.7 | 5.0 | 2.2 |
| Apr 2009 | 5.3 | 0.4 | 3.9 | 1.4 | 4.9 | 2.2 |
| May 2009 | 5.4 | 0.7 | 3.8 | 2.1 | 5.3 | 2.1 |
| Jun 2009 | 4.3 | 0.9 | 3.4 | 1.8 | 4.9 | 2.1 |
| Jul 2009 | 5.5 | 1.0 | 3.4 | 1.1 | 4.7 | 1.8 |
| Aug 2009 | 4.3 | 1.0 | 3.7 | 1.6 | 4.8 | 1.6 |
| Sep 2009 | 5.5 | 1.1 | 3.8 | 1.9 | 4.6 | 2.3 |
| Oct 2009 | 5.4 | 1.0 | 3.4 | 1.3 | 4.5 | 2.0 |
| Nov 2009 | 5.5 | 0.8 | 3.6 | 1.6 | 5.0 | 2.1 |
| Dec 2009 | 6.0 | 1.0 | 3.7 | 1.7 | 4.8 | 2.1 |
| Jan 2010 | 5.6 | 0.9 | 3.8 | 1.6 | 4.9 | 2.2 |
| Feb 2010 | 5.0 | 1.1 | 3.8 | 1.9 | 4.7 | 2.0 |
| Mar 2010 | 7.4 | 1.4 | 4.5 | 2.3 | 5.0 | 1.7 |
| Apr 2010 | 6.6 | 1.8 | 3.7 | 1.8 | 4.9 | 2.1 |
| May 2010 | 5.5 | 1.5 | 3.7 | 1.8 | 4.8 | 2.1 |
| Jun 2010 | 5.0 | 1.5 | 3.9 | 1.8 | 4.7 | 2.0 |
| Jul 2010 | 6.2 | 2.1 | 4.0 | 1.7 | 4.9 | 2.3 |
| Aug 2010 | 5.9 | 0.9 | 3.7 | 1.6 | 4.8 | 2.7 |
| Sep 2010 | 5.8 | 1.3 | 3.9 | 1.5 | 5.0 | 2.1 |
| Oct 2010 | 6.4 | 1.2 | 3.9 | 1.7 | 4.9 | 2.4 |
| Nov 2010 | 6.2 | 1.2 | 3.9 | 1.8 | 4.8 | 2.3 |
| Dec 2010 | 6.8 | 0.6 | 3.4 | 2.0 | 4.7 | 2.3 |
| Jan 2011 | 5.1 | 1.1 | 3.9 | 1.9 | 4.7 | 2.5 |
| Feb 2011 | 6.3 | 0.8 | 3.9 | 1.8 | 4.8 | 3.0 |
| Mar 2011 | 6.9 | 1.2 | 4.0 | 1.8 | 5.5 | 2.8 |
| Apr 2011 | 6.7 | 2.2 | 4.0 | 2.2 | 5.1 | 2.4 |
| May 2011 | 6.8 | 2.1 | 3.9 | 2.1 | 4.7 | 2.5 |
| Jun 2011 | 6.8 | 1.2 | 4.0 | 2.3 | 5.3 | 2.6 |
| Jul 2011 | 6.2 | 1.6 | 4.0 | 2.3 | 5.3 | 2.1 |
| Aug 2011 | 5.9 | 1.7 | 3.6 | 2.2 | 5.2 | 2.8 |
| Sep 2011 | 6.7 | 1.5 | 3.9 | 2.2 | 5.3 | 3.0 |
| Oct 2011 | 5.9 | 1.3 | 3.8 | 2.3 | 5.2 | 3.0 |
| Nov 2011 | 5.6 | 1.1 | 3.8 | 2.1 | 5.4 | 3.0 |
| Dec 2011 | 5.6 | 0.8 | 3.4 | 2.2 | 5.3 | 3.2 |
| Jan 2012 | 5.8 | 1.4 | 3.9 | 2.4 | 5.4 | 3.2 |
| Feb 2012 | 6.0 | 1.0 | 3.8 | 2.3 | 5.1 | 2.9 |
| Mar 2012 | 5.4 | 1.6 | 3.9 | 2.5 | 5.8 | 3.1 |
| Apr 2012 | 5.2 | 2.1 | 3.9 | 2.2 | 5.2 | 3.2 |
| May 2012 | 5.8 | 1.5 | 3.9 | 2.3 | 5.3 | 3.2 |
| Jun 2012 | 6.3 | 1.7 | 3.9 | 2.2 | 5.2 | 3.4 |
| Jul 2012 | 6.4 | 1.4 | 3.8 | 2.1 | 5.3 | 3.3 |
| Aug 2012 | 6.0 | 2.0 | 4.1 | 2.4 | 5.5 | 3.0 |
| Sep 2012 | 6.2 | 1.4 | 4.0 | 2.4 | 5.3 | 2.7 |
| Oct 2012 | 5.6 | 1.8 | 4.0 | 2.5 | 5.4 | 3.2 |
| Nov 2012 | 6.9 | 1.2 | 3.9 | 3.0 | 5.2 | 3.5 |
| Dec 2012 | 5.4 | 1.1 | 3.9 | 2.6 | 5.4 | 3.5 |
| Jan 2013 | 5.8 | 2.0 | 4.0 | 2.7 | 5.6 | 3.4 |
| Feb 2013 | 6.5 | 1.9 | 4.2 | 2.6 | 5.5 | 3.5 |
| Mar 2013 | 6.1 | 1.8 | 3.7 | 2.7 | 5.5 | 3.5 |
| Apr 2013 | 5.1 | 2.3 | 4.1 | 2.9 | 6.1 | 3.3 |
| May 2013 | 5.7 | 2.1 | 4.2 | 3.1 | 5.4 | 3.3 |
| Jun 2013 | 5.6 | 2.3 | 4.1 | 3.8 | 5.4 | 3.5 |
| Jul 2013 | 5.3 | 2.0 | 4.1 | 3.0 | 5.4 | 3.7 |
| Aug 2013 | 5.1 | 2.1 | 4.6 | 2.9 | 5.3 | 3.6 |
| Sep 2013 | 5.4 | 1.9 | 4.4 | 3.1 | 5.5 | 3.8 |
| Oct 2013 | 5.5 | 2.1 | 4.5 | 2.8 | 5.5 | 3.5 |
| Nov 2013 | 5.1 | 1.7 | 4.7 | 2.8 | 5.3 | 3.7 |
| Dec 2013 | 4.7 | 1.4 | 4.8 | 2.7 | 5.3 | 4.0 |
| Jan 2014 | 4.8 | 2.1 | 4.1 | 2.7 | 5.6 | 3.9 |
| Feb 2014 | 4.4 | 1.7 | 4.7 | 2.9 | 5.8 | 4.0 |
| Mar 2014 | 4.4 | 2.0 | 4.6 | 3.2 | 5.6 | 4.2 |
| Apr 2014 | 5.0 | 2.1 | 4.9 | 3.4 | 5.6 | 4.4 |
| May 2014 | 5.3 | 2.4 | 5.0 | 2.8 | 5.8 | 4.9 |
| Jun 2014 | 4.5 | 2.7 | 4.9 | 3.0 | 5.9 | 4.8 |
| Jul 2014 | 6.4 | 2.5 | 5.0 | 2.8 | 5.7 | 4.0 |
| Aug 2014 | 5.3 | 2.3 | 4.6 | 3.3 | 5.5 | 4.7 |
| Sep 2014 | 4.8 | 1.7 | 4.6 | 3.0 | 5.9 | 4.6 |
| Oct 2014 | 5.1 | 2.3 | 5.0 | 3.1 | 6.0 | 4.9 |
| Nov 2014 | 5.1 | 1.7 | 5.0 | 3.2 | 6.1 | 4.3 |
| Dec 2014 | 6.3 | 1.5 | 5.0 | 3.4 | 6.3 | 4.6 |
| Jan 2015 | 5.7 | 2.2 | 4.9 | 3.2 | 5.8 | 5.2 |
| Feb 2015 | 5.1 | 2.4 | 4.5 | 3.3 | 5.8 | 4.9 |
| Mar 2015 | 4.9 | 2.6 | 4.9 | 3.2 | 6.0 | 4.7 |
| Apr 2015 | 5.3 | 2.6 | 4.7 | 3.4 | 6.2 | 5.0 |
| May 2015 | 4.9 | 2.6 | 5.0 | 3.5 | 6.1 | 4.8 |
| Jun 2015 | 5.2 | 2.3 | 4.9 | 3.4 | 6.2 | 4.4 |
| Jul 2015 | 4.7 | 2.3 | 4.9 | 3.8 | 6.3 | 5.2 |
| Aug 2015 | 5.0 | 2.4 | 4.7 | 3.7 | 6.5 | 4.8 |
| Sep 2015 | 5.3 | 1.6 | 4.6 | 4.0 | 6.5 | 4.7 |
| Oct 2015 | 5.0 | 2.0 | 4.7 | 3.5 | 6.5 | 5.0 |
| Nov 2015 | 5.2 | 1.3 | 4.9 | 3.2 | 6.6 | 4.8 |
| Dec 2015 | 4.7 | 1.9 | 4.9 | 3.2 | 6.9 | 4.8 |
| Jan 2016 | 4.4 | 2.3 | 4.8 | 3.9 | 5.9 | 4.8 |
| Feb 2016 | 5.2 | 2.8 | 5.3 | 3.7 | 6.8 | 5.1 |
| Mar 2016 | 5.3 | 3.0 | 4.7 | 3.7 | 6.4 | 5.1 |
| Apr 2016 | 5.0 | 2.7 | 4.3 | 3.6 | 6.1 | 4.9 |
| May 2016 | 4.7 | 2.7 | 4.4 | 3.6 | 6.3 | 4.8 |
| Jun 2016 | 4.2 | 2.5 | 4.5 | 3.7 | 6.2 | 4.6 |
| Jul 2016 | 5.0 | 3.4 | 4.5 | 3.8 | 6.3 | 4.6 |
| Aug 2016 | 5.1 | 2.7 | 4.6 | 3.7 | 6.3 | 4.8 |
| Sep 2016 | 4.7 | 3.4 | 4.8 | 3.8 | 6.0 | 4.6 |
| Oct 2016 | 5.1 | 2.8 | 4.7 | 3.9 | 6.1 | 4.5 |
| Nov 2016 | 5.0 | 2.6 | 4.2 | 3.9 | 6.7 | 4.7 |
| Dec 2016 | 5.9 | 2.0 | 4.2 | 3.9 | 6.4 | 4.5 |
| Jan 2017 | 5.7 | 2.0 | 4.3 | 3.5 | 6.4 | 4.6 |
| Feb 2017 | 5.4 | 2.4 | 4.8 | 3.3 | 6.2 | 5.0 |
| Month | Financial activities hires rate | Financial activities job openings rate | Professional and business services hires rate | Professional and business services job openings rate | Health care and social assistance hires rate | Health care and social assistance job openings rate |
|---|---|---|---|---|---|---|
| Feb 2007 | 3.0 | 3.0 | 5.5 | 3.9 | 2.9 | 4.0 |
| Mar 2007 | 3.4 | 3.9 | 5.5 | 4.3 | 3.0 | 4.2 |
| Apr 2007 | 2.7 | 2.8 | 5.0 | 4.6 | 2.9 | 4.3 |
| May 2007 | 3.4 | 3.3 | 5.4 | 4.1 | 3.1 | 4.4 |
| Jun 2007 | 3.0 | 3.2 | 4.9 | 4.1 | 3.0 | 4.5 |
| Jul 2007 | 2.9 | 3.4 | 5.1 | 3.7 | 2.8 | 3.9 |
| Aug 2007 | 3.1 | 3.6 | 5.1 | 4.0 | 3.0 | 4.3 |
| Sep 2007 | 3.0 | 3.3 | 5.1 | 4.0 | 2.9 | 4.8 |
| Oct 2007 | 3.0 | 3.3 | 5.4 | 4.1 | 3.0 | 4.1 |
| Nov 2007 | 2.8 | 2.8 | 5.4 | 4.0 | 3.0 | 4.2 |
| Dec 2007 | 2.9 | 3.2 | 5.1 | 4.1 | 2.7 | 4.2 |
| Jan 2008 | 2.9 | 3.8 | 4.8 | 4.0 | 3.0 | 4.0 |
| Feb 2008 | 2.9 | 2.7 | 4.7 | 4.0 | 3.2 | 4.5 |
| Mar 2008 | 2.6 | 3.0 | 4.5 | 4.1 | 3.1 | 4.3 |
| Apr 2008 | 2.8 | 2.7 | 5.1 | 4.1 | 3.1 | 4.1 |
| May 2008 | 2.4 | 2.4 | 4.5 | 3.4 | 2.9 | 4.1 |
| Jun 2008 | 2.7 | 2.3 | 5.3 | 4.0 | 2.7 | 4.0 |
| Jul 2008 | 2.5 | 2.6 | 4.4 | 3.6 | 2.8 | 3.9 |
| Aug 2008 | 2.6 | 2.6 | 4.5 | 3.5 | 2.8 | 3.7 |
| Sep 2008 | 2.6 | 2.3 | 4.3 | 3.4 | 2.7 | 3.4 |
| Oct 2008 | 2.2 | 2.0 | 4.5 | 3.2 | 2.9 | 3.4 |
| Nov 2008 | 2.5 | 2.4 | 4.2 | 3.0 | 2.6 | 3.3 |
| Dec 2008 | 2.0 | 2.4 | 4.8 | 3.2 | 2.7 | 3.3 |
| Jan 2009 | 2.4 | 2.3 | 4.4 | 3.1 | 2.8 | 3.1 |
| Feb 2009 | 2.2 | 2.5 | 4.3 | 3.1 | 2.8 | 3.0 |
| Mar 2009 | 2.3 | 2.3 | 3.6 | 2.5 | 2.6 | 2.8 |
| Apr 2009 | 1.7 | 1.6 | 4.0 | 2.4 | 2.5 | 2.8 |
| May 2009 | 2.0 | 2.2 | 4.0 | 2.4 | 2.4 | 2.9 |
| Jun 2009 | 2.0 | 1.9 | 3.9 | 2.4 | 2.6 | 2.8 |
| Jul 2009 | 2.4 | 1.7 | 4.2 | 2.6 | 2.6 | 2.9 |
| Aug 2009 | 2.2 | 1.6 | 3.8 | 2.1 | 2.8 | 2.8 |
| Sep 2009 | 1.9 | 2.2 | 4.2 | 2.6 | 2.8 | 3.1 |
| Oct 2009 | 2.3 | 2.0 | 4.2 | 2.2 | 2.5 | 2.9 |
| Nov 2009 | 1.8 | 2.1 | 5.1 | 2.5 | 2.6 | 2.8 |
| Dec 2009 | 2.3 | 1.7 | 4.1 | 2.6 | 2.5 | 2.9 |
| Jan 2010 | 2.2 | 2.1 | 4.5 | 2.4 | 2.3 | 3.2 |
| Feb 2010 | 2.1 | 1.9 | 4.4 | 2.3 | 2.4 | 2.8 |
| Mar 2010 | 1.9 | 2.0 | 4.4 | 2.5 | 2.5 | 2.6 |
| Apr 2010 | 2.3 | 2.8 | 4.7 | 3.0 | 2.5 | 2.7 |
| May 2010 | 2.3 | 2.7 | 4.7 | 3.4 | 2.4 | 2.6 |
| Jun 2010 | 2.4 | 2.6 | 5.0 | 2.8 | 2.6 | 2.5 |
| Jul 2010 | 2.1 | 2.8 | 4.8 | 3.2 | 2.7 | 2.7 |
| Aug 2010 | 2.0 | 3.1 | 4.7 | 3.5 | 2.4 | 2.4 |
| Sep 2010 | 2.2 | 2.9 | 4.5 | 3.3 | 2.6 | 2.7 |
| Oct 2010 | 2.2 | 3.1 | 4.5 | 3.5 | 2.4 | 3.1 |
| Nov 2010 | 2.0 | 3.2 | 4.7 | 3.7 | 2.5 | 2.8 |
| Dec 2010 | 2.4 | 2.5 | 5.4 | 3.4 | 2.5 | 2.8 |
| Jan 2011 | 2.0 | 2.7 | 4.8 | 2.7 | 2.1 | 2.6 |
| Feb 2011 | 1.9 | 2.7 | 5.0 | 3.4 | 2.3 | 2.8 |
| Mar 2011 | 2.1 | 2.5 | 5.3 | 3.4 | 2.3 | 3.0 |
| Apr 2011 | 1.7 | 3.1 | 5.1 | 3.2 | 2.4 | 3.0 |
| May 2011 | 2.0 | 2.5 | 5.1 | 3.3 | 2.4 | 3.0 |
| Jun 2011 | 2.1 | 2.7 | 4.8 | 3.5 | 2.6 | 3.1 |
| Jul 2011 | 2.1 | 2.9 | 4.8 | 4.3 | 2.4 | 3.1 |
| Aug 2011 | 2.0 | 2.3 | 5.1 | 3.3 | 2.5 | 3.1 |
| Sep 2011 | 2.0 | 2.2 | 5.2 | 4.1 | 2.3 | 3.0 |
| Oct 2011 | 2.2 | 2.9 | 5.0 | 3.4 | 2.4 | 3.2 |
| Nov 2011 | 2.2 | 2.0 | 4.9 | 3.0 | 2.5 | 3.3 |
| Dec 2011 | 2.2 | 2.4 | 4.9 | 4.2 | 2.4 | 3.2 |
| Jan 2012 | 2.1 | 3.0 | 4.6 | 4.4 | 2.6 | 3.4 |
| Feb 2012 | 2.2 | 2.5 | 5.4 | 3.5 | 2.8 | 3.5 |
| Mar 2012 | 2.3 | 2.9 | 5.2 | 4.4 | 2.6 | 3.5 |
| Apr 2012 | 2.4 | 2.7 | 4.8 | 3.3 | 2.4 | 3.5 |
| May 2012 | 2.3 | 3.0 | 5.2 | 3.7 | 2.7 | 3.5 |
| Jun 2012 | 2.3 | 2.8 | 5.4 | 3.9 | 2.6 | 3.9 |
| Jul 2012 | 2.2 | 3.1 | 4.8 | 3.7 | 2.5 | 3.3 |
| Aug 2012 | 2.5 | 3.2 | 4.8 | 4.0 | 2.5 | 3.3 |
| Sep 2012 | 2.6 | 3.5 | 4.7 | 3.3 | 2.4 | 3.6 |
| Oct 2012 | 2.4 | 3.3 | 4.7 | 3.5 | 2.5 | 3.5 |
| Nov 2012 | 2.8 | 2.9 | 4.9 | 3.2 | 2.5 | 3.5 |
| Dec 2012 | 2.2 | 3.2 | 4.7 | 3.3 | 2.6 | 3.5 |
| Jan 2013 | 2.7 | 2.9 | 4.9 | 3.7 | 2.6 | 3.0 |
| Feb 2013 | 2.9 | 4.4 | 4.6 | 4.0 | 2.6 | 3.5 |
| Mar 2013 | 2.3 | 3.4 | 4.6 | 3.7 | 2.6 | 3.5 |
| Apr 2013 | 2.4 | 3.5 | 4.9 | 3.6 | 2.8 | 3.6 |
| May 2013 | 2.7 | 3.8 | 4.9 | 3.3 | 2.7 | 3.4 |
| Jun 2013 | 2.4 | 3.8 | 5.2 | 3.3 | 2.4 | 3.4 |
| Jul 2013 | 2.7 | 3.9 | 5.3 | 3.1 | 2.6 | 3.3 |
| Aug 2013 | 2.7 | 3.3 | 5.5 | 3.6 | 2.7 | 3.6 |
| Sep 2013 | 2.8 | 3.0 | 5.2 | 3.6 | 2.7 | 3.2 |
| Oct 2013 | 2.4 | 3.0 | 4.6 | 4.1 | 2.5 | 3.2 |
| Nov 2013 | 2.3 | 2.7 | 5.2 | 3.6 | 2.5 | 3.2 |
| Dec 2013 | 2.2 | 2.9 | 4.9 | 3.7 | 2.5 | 2.9 |
| Jan 2014 | 2.0 | 2.8 | 5.2 | 3.4 | 2.7 | 3.4 |
| Feb 2014 | 2.2 | 2.9 | 5.2 | 4.1 | 2.5 | 3.5 |
| Mar 2014 | 2.5 | 3.0 | 5.3 | 3.6 | 2.7 | 3.6 |
| Apr 2014 | 2.3 | 3.2 | 5.1 | 4.2 | 2.8 | 3.5 |
| May 2014 | 2.4 | 3.5 | 4.9 | 4.1 | 2.6 | 3.9 |
| Jun 2014 | 2.3 | 3.8 | 5.1 | 4.2 | 2.6 | 3.8 |
| Jul 2014 | 2.4 | 3.6 | 5.3 | 4.3 | 2.8 | 4.1 |
| Aug 2014 | 2.7 | 3.9 | 5.5 | 4.7 | 2.5 | 4.5 |
| Sep 2014 | 2.6 | 3.1 | 5.8 | 4.3 | 2.9 | 4.1 |
| Oct 2014 | 2.2 | 3.9 | 5.6 | 4.7 | 2.9 | 4.4 |
| Nov 2014 | 2.8 | 3.3 | 5.1 | 5.1 | 2.8 | 3.8 |
| Dec 2014 | 2.8 | 3.2 | 5.1 | 5.0 | 2.9 | 4.4 |
| Jan 2015 | 2.5 | 3.6 | 5.2 | 4.6 | 2.8 | 4.3 |
| Feb 2015 | 2.0 | 4.1 | 5.3 | 4.6 | 2.9 | 4.4 |
| Mar 2015 | 2.4 | 3.2 | 5.4 | 5.0 | 2.8 | 4.1 |
| Apr 2015 | 2.6 | 4.5 | 5.3 | 5.5 | 2.9 | 4.9 |
| May 2015 | 2.4 | 3.7 | 5.4 | 5.4 | 2.8 | 4.5 |
| Jun 2015 | 2.5 | 3.3 | 5.3 | 5.6 | 2.7 | 4.6 |
| Jul 2015 | 2.3 | 4.5 | 5.1 | 5.5 | 2.9 | 5.2 |
| Aug 2015 | 2.2 | 4.0 | 5.1 | 5.2 | 2.8 | 4.9 |
| Sep 2015 | 2.4 | 3.6 | 5.2 | 5.5 | 2.9 | 5.0 |
| Oct 2015 | 2.5 | 3.8 | 5.5 | 5.4 | 3.0 | 4.8 |
| Nov 2015 | 2.6 | 4.1 | 5.4 | 5.6 | 3.0 | 5.0 |
| Dec 2015 | 2.6 | 4.5 | 5.9 | 5.3 | 3.0 | 4.9 |
| Jan 2016 | 2.6 | 4.0 | 5.6 | 5.4 | 2.7 | 5.3 |
| Feb 2016 | 2.9 | 4.0 | 5.4 | 5.3 | 2.9 | 4.7 |
| Mar 2016 | 2.7 | 3.7 | 5.4 | 6.1 | 2.9 | 4.8 |
| Apr 2016 | 2.3 | 3.9 | 5.5 | 4.7 | 2.6 | 4.8 |
| May 2016 | 2.2 | 3.4 | 5.5 | 5.7 | 2.8 | 4.8 |
| Jun 2016 | 2.4 | 3.5 | 5.0 | 4.9 | 2.9 | 5.0 |
| Jul 2016 | 2.2 | 3.7 | 6.0 | 5.9 | 2.9 | 4.9 |
| Aug 2016 | 2.3 | 3.8 | 5.5 | 4.9 | 2.9 | 4.8 |
| Sep 2016 | 2.1 | 3.9 | 5.5 | 5.3 | 2.7 | 4.9 |
| Oct 2016 | 2.0 | 3.7 | 5.4 | 5.1 | 2.9 | 5.2 |
| Nov 2016 | 2.1 | 3.7 | 5.3 | 4.9 | 3.0 | 5.2 |
| Dec 2016 | 2.3 | 4.1 | 5.6 | 4.6 | 2.9 | 5.2 |
| Jan 2017 | 2.6 | 4.4 | 5.5 | 4.9 | 2.9 | 5.2 |
| Feb 2017 | 2.2 | 4.2 | 5.2 | 4.7 | 2.8 | 5.6 |