
The U.S. Bureau of Labor Statistics releases a wide range of economic statistics and analysis almost every day. Families, employers, policymakers, and others use these statistics to make better decisions. BLS data inform Americans and people around the world about employment, prices, compensation, productivity, worker safety, and a host of other topics. Today I am using my blog series, “Why This Counts,” to shed some light on the quarterly Employment Cost Index, a measure of changes in employer costs for wages and benefits.
The Employment Cost Index—the ECI—began in the mid-1970s by tracking changes in employer costs for wages in the private sector. Over time, the program has expanded to include the cost of about two dozen benefits and currently includes both private industry and state and local government workers.
We track a sample of employers and occupations selected to represent the U.S. economy. We return to these employers quarterly and ask them to update their information on the cost of wages and benefits. By tracking the same occupations over time, the ECI is free from changes in wage and benefit costs due to shifts in employment from one industry or occupation to another.
The ECI provides quarterly rates of change. The data are for March, June, September, and December, and we release the numbers a month later. Today we released the March 2015 data. I’m always impressed at how quickly we can collect and report on dozens of pieces of information from thousands of employers each quarter. We’re able to do this because of the excellent cooperation we have with employers; my thanks to those who provide data for all our programs. We’re also able to release the data quickly thanks to our regional office staff who work with employers and our national office staff who turn the raw data into useful numbers and publish the results.
As we reported today, total compensation costs (wages and benefits together) rose 0.7 percent for the quarter and 2.6 percent over the past year. These data are for all workers in private industry plus state and local government—a group we call civilian workers. Wages for civilian workers grew 0.7 percent over the quarter and 2.6 percent over the year; benefit costs rose 0.6 percent over the quarter and 2.7 percent over the year.
The cost of many benefits tracks closely with employee wages. For example, as wages increase, an employer’s cost to provide vacation benefits increases about the same rate. This is also true for 401(k) retirement plans; the employer cost for these plans—usually a match of employee contributions—is a percent of the employee’s pay and increases as pay increases.
In contrast, the cost of some benefits moves independent of wages. Health insurance is one notable example. For the 12 months ending in March, private employer costs for health insurance rose 2.5 percent. As the chart shows, the change in health insurance costs can drive the change in overall benefit costs.
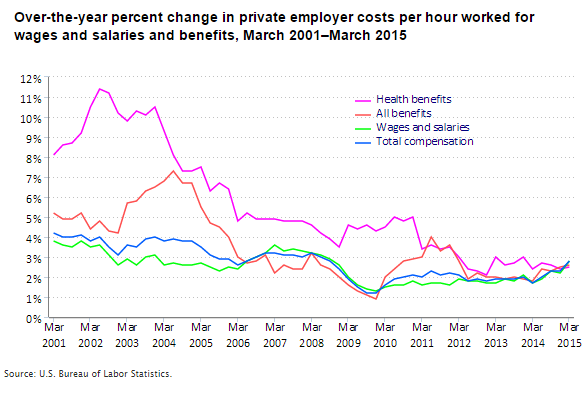
The ECI provides evidence of the slow growth in wages since the 2007–2009 recession. From December 2002 to December 2008, private industry wages grew at an average rate of 2.9 percent per year. From December 2008 to December 2014, private industry wages grew at an average rate of 1.8 percent per year.
The ECI can provide an early warning of inflationary pressure in the economy. Rising compensation costs may lead firms to raise prices for their goods and services. In a preview of this week’s economic calendar, one media outlet said about the ECI, “It’s seen by some as perhaps the best gauge of whether labor costs are on the rise. This is of utmost importance to the market, since if labor costs are accelerating, it could spur the Fed to make monetary policy tighter.” In addition, employers look to the ECI when setting their budgets for pay raises; employers and workers look to the ECI during salary discussions or contract negotiations.
We also use the data on wages and benefits to estimate the cost in dollars and cents per hour worked that employers spend. We call this series Employer Costs for Employee Compensation. This series provides information on the share of compensation dollars that go toward wages versus benefits, and toward individual benefits. In December 2014, about 69 percent of the compensation dollar of private sector employers went toward wages, with the rest going toward benefits. The most expensive individual benefit for private industry employers was health insurance, costing employers $2.39 per hour worked in December 2014.
You can visit the Employment Cost Trends page of our website to get current and historical data and analysis and learn more about how we collect the data.