
An official website of the United States government
An official website of the United States government
The .gov means it's official.
Federal government websites often end in .gov or .mil. Before sharing sensitive information,
make sure you're on a federal government site.
The site is secure.
The
https:// ensures that you are connecting to the official website and that any
information you provide is encrypted and transmitted securely.
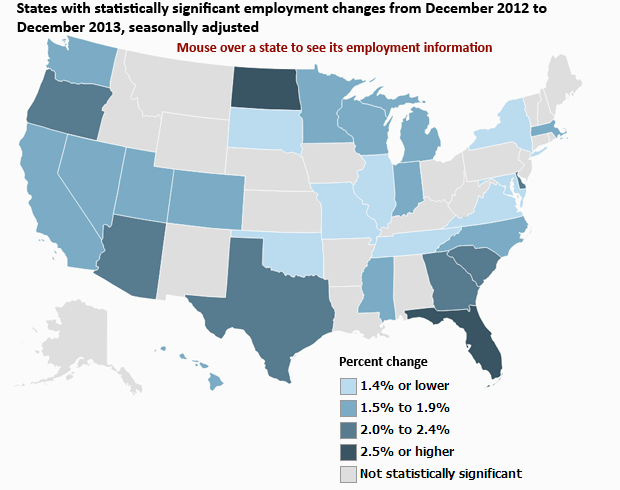
From December 2012 to December 2013, 29 states had statistically significant changes in employment, all of which were positive. North Dakota had the highest over-the-year percent increase in employment at 4.0 percent, followed by Florida (2.6 percent) and Oregon (2.4 percent).
| State | December 2012 | December 2013 (p) | Over-the-year change (p) | Over-the-year percent change (p) |
|---|---|---|---|---|
|
Arizona |
2,488,300 | 2,537,600 | 49,300 | 2.0 |
|
California |
14,532,100 | 14,767,800 | 235,700 | 1.6 |
|
Colorado |
2,335,800 | 2,379,700 | 43,900 | 1.9 |
|
Delaware |
421,500 | 430,600 | 9,100 | 2.2 |
|
Florida |
7,452,100 | 7,645,000 | 192,900 | 2.6 |
|
Georgia |
3,988,600 | 4,078,300 | 89,700 | 2.2 |
|
Hawaii |
611,600 | 621,100 | 9,500 | 1.6 |
|
Illinois |
5,772,900 | 5,835,100 | 62,200 | 1.1 |
|
Indiana |
2,923,700 | 2,975,500 | 51,800 | 1.8 |
|
Maryland |
2,589,200 | 2,625,200 | 36,000 | 1.4 |
|
Massachusetts |
3,299,100 | 3,354,600 | 55,500 | 1.7 |
|
Michigan |
4,028,900 | 4,092,700 | 63,800 | 1.6 |
|
Minnesota |
2,751,900 | 2,797,700 | 45,800 | 1.7 |
|
Mississippi |
1,108,200 | 1,127,100 | 18,900 | 1.7 |
|
Missouri |
2,687,900 | 2,721,800 | 33,900 | 1.3 |
|
Nevada |
1,158,700 | 1,180,100 | 21,400 | 1.8 |
|
New York |
8,846,900 | 8,943,800 | 96,900 | 1.1 |
|
North Carolina |
4,032,300 | 4,096,800 | 64,500 | 1.6 |
|
North |
438,700 | 456,100 | 17,400 | 4.0 |
|
Oklahoma |
1,618,000 | 1,636,800 | 18,800 | 1.2 |
|
Oregon |
1,643,800 | 1,682,700 | 38,900 | 2.4 |
|
South Carolina |
1,876,500 | 1,913,300 | 36,800 | 2.0 |
|
South Dakota |
415,900 | 421,900 | 6,000 | 1.4 |
|
Tennessee |
2,739,700 | 2,771,100 | 31,400 | 1.1 |
|
Texas |
11,024,700 | 11,277,100 | 252,400 | 2.3 |
|
Utah |
1,266,200 | 1,288,000 | 21,800 | 1.7 |
|
Virginia |
3,745,800 | 3,777,300 | 31,500 | 0.8 |
|
Washington |
2,885,300 | 2,940,200 | 54,900 | 1.9 |
|
Wisconsin |
2,796,000 | 2,840,500 | 44,500 | 1.6 |
| Footnotes:
(p) Preliminary
|
||||
Employment in Texas increased 2.3 percent from December 2012 to December 2013. California's employment increased by 1.6 percent, and New York's employment went up 1.1 percent.
These data are from the Current Employment Statistics (State and Metro Area) program. To learn more, see "Regional and State Employment and Unemployment — December 2013" (HTML) (PDF), news release USDL-14-0126. Data for the most recent month are preliminary and subject to revision.
Bureau of Labor Statistics, U.S. Department of Labor, The Economics Daily, State employment over-the-year percent changes, December 2013 at https://www.bls.gov/opub/ted/2014/ted_20140129.htm (visited June 07, 2024).

