
An official website of the United States government
An official website of the United States government
The .gov means it's official.
Federal government websites often end in .gov or .mil. Before sharing sensitive information,
make sure you're on a federal government site.
The site is secure.
The
https:// ensures that you are connecting to the official website and that any
information you provide is encrypted and transmitted securely.
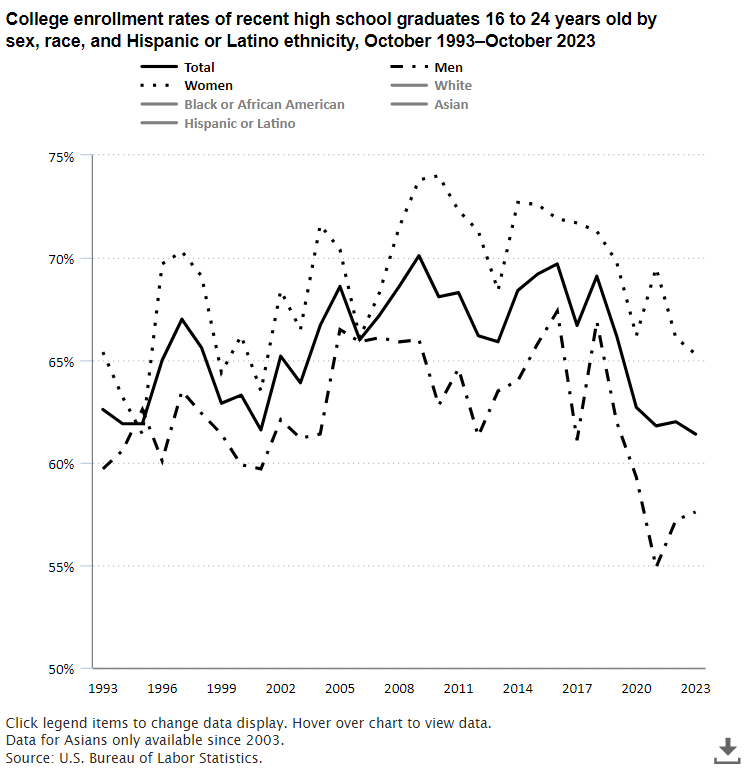
Of the 3.1 million people ages 16 to 24 who graduated from high school between January and October 2023, 1.9 million, or 61.4 percent, were enrolled in colleges or universities in October 2023.
read full article »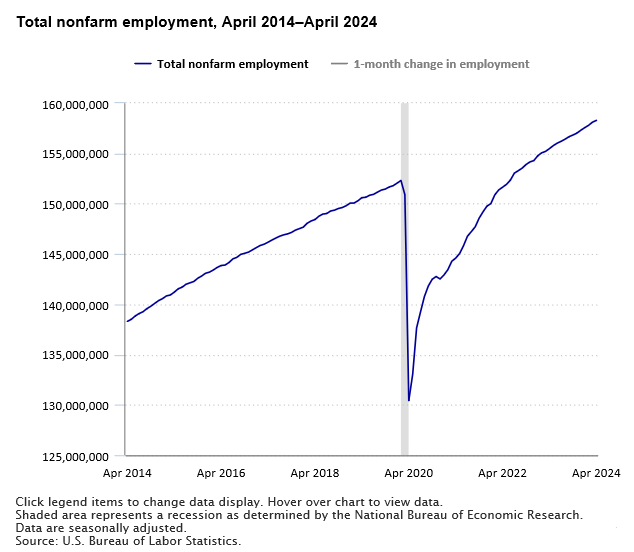
Nonfarm payroll employment increased by 175,000 in April 2024, lower than the average monthly gain of 242,000 over the prior 12 months. Since April 2023, the over-the-month change in employment has ranged from 165,000 to 315,000. Total nonfarm payroll employment has risen from 155.5 million in April 2023 to 158.3 million in April 2024.

In April 2024, the number of long-term unemployed (those jobless for 27 weeks or more) was at 1.3 million, or 19.6 percent of all unemployed people. Those unemployed long term made up 19.4 percent of the total unemployed in April 2023, 23.0 percent in April 2022, and 42.9 percent in March 2021 (the recent peak).

Unemployment rates were higher in March 2024 than a year earlier in 269 of the 389 metropolitan areas, lower in 89 areas, and unchanged in 31 areas. A total of 77 areas had jobless rates of less than 3.0 percent and 12 areas had rates of at least 8.0 percent.

The National Safety Stand-Down to Prevent Falls in Construction runs from May 6 through May 10 and highlights fall hazards and fall prevention in the construction industry. In 2022, nearly 1 in 5 workplace deaths occurred in the construction industry and 38.4 percent of these deaths were due to falls, slips, and trips. The construction industry accounted for close to half, 47.4 percent, of all fatal falls, slips, and trips in 2022.

