
An official website of the United States government
An official website of the United States government
The .gov means it's official.
Federal government websites often end in .gov or .mil. Before sharing sensitive information,
make sure you're on a federal government site.
The site is secure.
The
https:// ensures that you are connecting to the official website and that any
information you provide is encrypted and transmitted securely.
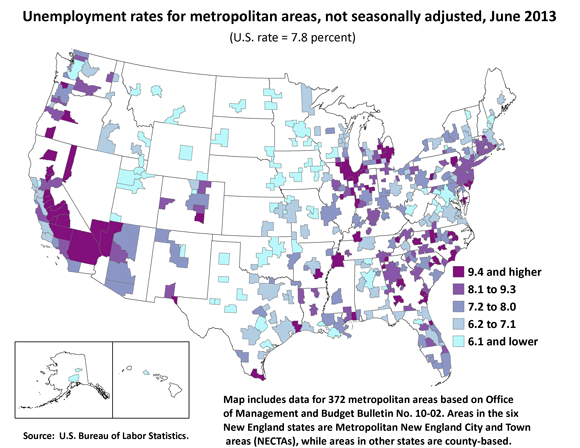
In June 2013, unemployment rates were lower than a year earlier in 272 of the 372 metropolitan areas, higher in 73 areas, and unchanged in 27 areas. Fifty-one areas had jobless rates of at least 10.0 percent, and 26 areas had rates of less than 5.0 percent.
| Metropolitan Statistical Area | Unemployment rate (in percent) (p) |
|---|---|
Alabama | |
Anniston-Oxford, AL | 7.5 |
Auburn-Opelika, AL | 5.8 |
Birmingham-Hoover, AL | 5.9 |
Decatur, AL | 6.5 |
Dothan, AL | 6.6 |
Florence-Muscle Shoals, AL | 6.6 |
Gadsden, AL | 6.7 |
Huntsville, AL | 5.9 |
Mobile, AL | 7.8 |
Montgomery, AL | 6.9 |
Tuscaloosa, AL | 6.6 |
Alaska | |
Anchorage, AK | 5.8 |
Fairbanks, AK | 5.9 |
Arizona | |
Flagstaff, AZ | 8.0 |
Lake Havasu City-Kingman, AZ | 10.0 |
Phoenix-Mesa-Glendale, AZ | 7.2 |
Prescott, AZ | 8.6 |
Tucson, AZ | 7.5 |
Yuma, AZ | 31.8 |
Arkansas | |
Fayetteville-Springdale-Rogers, AR-MO | 5.7 |
Fort Smith, AR-OK | 7.7 |
Hot Springs, AR | 7.7 |
Jonesboro, AR | 7.2 |
Little Rock-North Little Rock-Conway, AR | 6.7 |
Pine Bluff, AR | 10.1 |
California | |
Bakersfield-Delano, CA | 11.5 |
Chico, CA | 10.3 |
El Centro, CA | 23.6 |
Fresno, CA | 12.3 |
Hanford-Corcoran, CA | 12.8 |
Los Angeles-Long Beach-Santa Ana, CA | 9.2 |
Madera-Chowchilla, CA | 11.0 |
Merced, CA | 14.1 |
Modesto, CA | 12.7 |
Napa, CA | 5.8 |
Oxnard-Thousand Oaks-Ventura, CA | 7.4 |
Redding, CA | 10.6 |
Riverside-San Bernardino-Ontario, CA | 10.2 |
Sacramento--Arden-Arcade--Roseville, CA | 8.5 |
Salinas, CA | 8.1 |
San Diego-Carlsbad-San Marcos, CA | 7.3 |
San Francisco-Oakland-Fremont, CA | 6.5 |
San Jose-Sunnyvale-Santa Clara, CA | 6.9 |
San Luis Obispo-Paso Robles, CA | 6.4 |
Santa Barbara-Santa Maria-Goleta, CA | 6.3 |
Santa Cruz-Watsonville, CA | 7.9 |
Santa Rosa-Petaluma, CA | 6.7 |
Stockton, CA | 12.0 |
Vallejo-Fairfield, CA | 8.2 |
Visalia-Porterville, CA | 12.8 |
Yuba City, CA | 14.2 |
Colorado | |
Boulder, CO | 6.1 |
Colorado Springs, CO | 9.1 |
Denver-Aurora-Broomfield, CO | 7.3 |
Fort Collins-Loveland, CO | 6.2 |
Grand Junction, CO | 9.0 |
Greeley, CO | 8.4 |
Pueblo, CO | 10.5 |
Connecticut | |
Bridgeport-Stamford-Norwalk, CT Metropolitan NECTA | 7.5 |
Danbury, CT Metropolitan NECTA | 6.4 |
Hartford-West Hartford-East Hartford, CT Metropolitan NECTA | 8.2 |
New Haven, CT Metropolitan NECTA | 8.5 |
Norwich-New London, CT-RI Metropolitan NECTA | 8.3 |
Waterbury, CT Metropolitan NECTA | 10.8 |
Delaware | |
Dover, DE | 7.9 |
Washington D.C. | |
Washington-Arlington-Alexandria, DC-VA-MD-WV | 6.0 |
Florida | |
Cape Coral-Fort Myers, FL | 7.4 |
Crestview-Fort Walton Beach-Destin, FL | 5.1 |
Deltona-Daytona Beach-Ormond Beach, FL | 7.3 |
Gainesville, FL | 6.0 |
Jacksonville, FL | 7.0 |
Lakeland-Winter Haven, FL | 8.4 |
Miami-Fort Lauderdale-Pompano Beach, FL | 7.6 |
Naples-Marco Island, FL | 7.2 |
North Port-Bradenton-Sarasota, FL | 7.2 |
Ocala, FL | 8.2 |
Orlando-Kissimmee-Sanford, FL | 6.9 |
Palm Bay-Melbourne-Titusville, FL | 7.8 |
Palm Coast, FL | 10.2 |
Panama City-Lynn Haven-Panama City Beach, FL | 6.6 |
Pensacola-Ferry Pass-Brent, FL | 7.0 |
Port St. Lucie, FL | 9.3 |
Punta Gorda, FL | 7.3 |
Sebastian-Vero Beach, FL | 9.3 |
Tallahassee, FL | 6.7 |
Tampa-St. Petersburg-Clearwater, FL | 7.2 |
Georgia | |
Albany, GA | 10.2 |
Athens-Clarke County, GA | 7.2 |
Atlanta-Sandy Springs-Marietta, GA | 8.9 |
Augusta-Richmond County, GA-SC | 9.3 |
Brunswick, GA | 10.3 |
Columbus, GA-AL | 9.3 |
Dalton, GA | 11.6 |
Gainesville, GA | 7.6 |
Hinesville-Fort Stewart, GA | 10.2 |
Macon, GA | 9.8 |
Rome, GA | 9.8 |
Savannah, GA | 8.8 |
Valdosta, GA | 9.1 |
Warner Robins, GA | 8.3 |
Hawaii | |
Honolulu, HI | 4.7 |
Idaho | |
Boise City-Nampa, ID | 6.2 |
Coeur d'Alene, ID | 7.0 |
Idaho Falls, ID | 5.5 |
Lewiston, ID-WA | 6.2 |
Pocatello, ID | 6.8 |
Illinois | |
Bloomington-Normal, IL | 7.5 |
Champaign-Urbana, IL | 8.7 |
Chicago-Joliet-Naperville, IL-IN-WI | 10.1 |
Danville, IL | 11.1 |
Davenport-Moline-Rock Island, IA-IL | 6.8 |
Decatur, IL | 12.5 |
Kankakee-Bradley, IL | 10.9 |
Peoria, IL | 8.8 |
Rockford, IL | 11.0 |
Springfield, IL | 7.5 |
Indiana | |
Anderson, IN | 9.9 |
Bloomington, IN | 8.9 |
Columbus, IN | 6.6 |
Elkhart-Goshen, IN | 8.6 |
Evansville, IN-KY | 8.0 |
Fort Wayne, IN | 8.2 |
Indianapolis-Carmel, IN | 7.9 |
Kokomo, IN | 9.4 |
Lafayette, IN | 8.5 |
Michigan City-La Porte, IN | 10.2 |
Muncie, IN | 10.5 |
South Bend-Mishawaka, IN-MI | 9.6 |
Terre Haute, IN | 11.1 |
Iowa | |
Ames, IA | 4.2 |
Cedar Rapids, IA | 4.9 |
Des Moines-West Des Moines, IA | 4.7 |
Dubuque, IA | 4.6 |
Iowa City, IA | 3.8 |
Sioux City, IA-NE-SD | 4.9 |
Waterloo-Cedar Falls, IA | 4.7 |
Kansas | |
Lawrence, KS | 5.8 |
Manhattan, KS | 5.7 |
Topeka, KS | 6.3 |
Wichita, KS | 6.7 |
Kentucky | |
Bowling Green, KY | 8.1 |
Elizabethtown, KY | 8.2 |
Lexington-Fayette, KY | 7.2 |
Louisville-Jefferson County, KY-IN | 8.5 |
Owensboro, KY | 7.7 |
Louisiana | |
Alexandria, LA | 8.1 |
Baton Rouge, LA | 7.8 |
Houma-Bayou Cane-Thibodaux, LA | 5.7 |
Lafayette, LA | 6.0 |
Lake Charles, LA | 7.0 |
Monroe, LA | 8.5 |
New Orleans-Metairie-Kenner, LA | 7.9 |
Shreveport-Bossier City, LA | 8.3 |
Maine | |
Bangor, ME Metropolitan NECTA | 6.9 |
Lewiston-Auburn, ME Metropolitan NECTA | 6.9 |
Portland-South Portland-Biddeford, ME Metropolitan NECTA | 5.7 |
Maryland | |
Baltimore-Towson, MD | 7.9 |
Cumberland, MD-WV | 8.1 |
Hagerstown-Martinsburg, MD-WV | 7.5 |
Salisbury, MD | 9.5 |
Massachusetts | |
Barnstable Town, MA Metropolitan NECTA | 6.6 |
Boston-Cambridge-Quincy, MA-NH Metropolitan NECTA | 6.8 |
Leominster-Fitchburg-Gardner, MA Metropolitan NECTA | 9.8 |
New Bedford, MA Metropolitan NECTA | 11.1 |
Pittsfield, MA Metropolitan NECTA | 7.5 |
Springfield, MA-CT Metropolitan NECTA | 8.7 |
Worcester, MA-CT Metropolitan NECTA | 8.1 |
Michigan | |
Ann Arbor, MI | 6.8 |
Battle Creek, MI | 8.0 |
Bay City, MI | 9.3 |
Detroit-Warren-Livonia, MI | 10.3 |
Flint, MI | 10.1 |
Grand Rapids-Wyoming, MI | 7.0 |
Holland-Grand Haven, MI | 7.2 |
Jackson, MI | 9.4 |
Kalamazoo-Portage, MI | 8.0 |
Lansing-East Lansing, MI | 8.1 |
Monroe, MI | 8.8 |
Muskegon-Norton Shores, MI | 9.2 |
Niles-Benton Harbor, MI | 9.4 |
Saginaw-Saginaw Township North, MI | 9.5 |
Minnesota | |
Duluth, MN-WI | 6.6 |
Mankato-North Mankato, MN | 4.5 |
Minneapolis-St. Paul-Bloomington, MN-WI | 5.1 |
Rochester, MN | 4.5 |
St. Cloud, MN | 5.4 |
Mississippi | |
Gulfport-Biloxi, MS | 9.0 |
Hattiesburg, MS | 8.5 |
Jackson, MS | 7.7 |
Pascagoula, MS | 10.1 |
Missouri | |
Cape Girardeau-Jackson, MO-IL | 7.0 |
Columbia, MO | 5.4 |
Jefferson City, MO | 6.0 |
Joplin, MO | 6.5 |
Kansas City, MO-KS | 6.6 |
St. Joseph, MO-KS | 5.8 |
St. Louis, MO-IL | 7.6 |
Springfield, MO | 6.2 |
Montana | |
Billings, MT | 4.4 |
Great Falls, MT | 5.1 |
Missoula, MT | 5.2 |
Nebraska | |
Lincoln, NE | 4.0 |
Omaha-Council Bluffs, NE-IA | 4.6 |
Nevada | |
Carson City, NV | 10.1 |
Las Vegas-Paradise, NV | 10.1 |
Reno-Sparks, NV | 9.8 |
New Hampshire | |
Manchester, NH Metropolitan NECTA | 5.0 |
Portsmouth, NH-ME Metropolitan NECTA | 4.4 |
Rochester-Dover, NH-ME Metropolitan NECTA | 5.0 |
New Jersey | |
Atlantic City-Hammonton, NJ | 12.6 |
Ocean City, NJ | 10.0 |
Trenton-Ewing, NJ | 7.7 |
Vineland-Millville-Bridgeton, NJ | 13.1 |
New Mexico | |
Albuquerque, NM | 7.8 |
Farmington, NM | 7.6 |
Las Cruces, NM | 8.5 |
Santa Fe, NM | 5.9 |
New York | |
Albany-Schenectady-Troy, NY | 6.4 |
Binghamton, NY | 7.7 |
Buffalo-Niagara Falls, NY | 7.4 |
Elmira, NY | 8.1 |
Glens Falls, NY | 6.3 |
Ithaca, NY | 5.7 |
Kingston, NY | 7.6 |
New York-Northern New Jersey-Long Island, NY-NJ-PA | 8.2 |
Poughkeepsie-Newburgh-Middletown, NY | 7.1 |
Rochester, NY | 7.0 |
Syracuse, NY | 7.5 |
Utica-Rome, NY | 7.6 |
North Carolina | |
Asheville, NC | 7.1 |
Burlington, NC | 9.5 |
Charlotte-Gastonia-Rock Hill, NC-SC | 9.3 |
Durham-Chapel Hill, NC | 7.3 |
Fayetteville, NC | 10.4 |
Goldsboro, NC | 9.2 |
Greensboro-High Point, NC | 9.7 |
Greenville, NC | 9.6 |
Hickory-Lenoir-Morganton, NC | 10.5 |
Jacksonville, NC | 8.9 |
Raleigh-Cary, NC | 7.5 |
Rocky Mount, NC | 13.3 |
Wilmington, NC | 9.4 |
Winston-Salem, NC | 8.7 |
North Dakota | |
Bismarck, ND | 2.8 |
Fargo, ND-MN | 3.6 |
Grand Forks, ND-MN | 4.1 |
Ohio | |
Akron, OH | 7.1 |
Canton-Massillon, OH | 7.5 |
Cincinnati-Middletown, OH-KY-IN | 7.4 |
Cleveland-Elyria-Mentor, OH | 7.7 |
Columbus, OH | 6.4 |
Dayton, OH | 7.8 |
Lima, OH | 8.2 |
Mansfield, OH | 8.3 |
Sandusky, OH | 6.6 |
Springfield, OH | 7.3 |
Steubenville-Weirton, OH-WV | 9.6 |
Toledo, OH | 8.3 |
Youngstown-Warren-Boardman, OH-PA | 8.3 |
Oklahoma | |
Lawton, OK | 7.1 |
Oklahoma City, OK | 5.4 |
Tulsa, OK | 5.9 |
Oregon | |
Bend, OR | 9.7 |
Corvallis, OR | 6.5 |
Eugene-Springfield, OR | 8.2 |
Medford, OR | 10.0 |
Portland-Vancouver-Hillsboro, OR-WA | 7.5 |
Salem, OR | 8.7 |
Pennsylvania | |
Allentown-Bethlehem-Easton, PA-NJ | 8.1 |
Altoona, PA | 7.2 |
Erie, PA | 7.8 |
Harrisburg-Carlisle, PA | 7.2 |
Johnstown, PA | 9.5 |
Lancaster, PA | 6.8 |
Lebanon, PA | 6.6 |
Philadelphia-Camden-Wilmington, PA-NJ-DE-MD | 8.4 |
Pittsburgh, PA | 7.2 |
Reading, PA | 8.1 |
Scranton--Wilkes-Barre, PA | 9.5 |
State College, PA | 6.7 |
Williamsport, PA | 8.1 |
York-Hanover, PA | 7.7 |
Rhode Island | |
Providence-Fall River-Warwick, RI-MA Metropolitan NECTA | 8.8 |
South Carolina | |
Anderson, SC | 8.2 |
Charleston-North Charleston-Summerville, SC | 7.3 |
Columbia, SC | 7.9 |
Florence, SC | 10.1 |
Greenville-Mauldin-Easley, SC | 7.4 |
Myrtle Beach-North Myrtle Beach-Conway, SC | 8.6 |
Spartanburg, SC | 8.8 |
Sumter, SC | 9.9 |
South Dakota | |
Rapid City, SD | 3.8 |
Sioux Falls, SD | 3.4 |
Tennessee | |
Chattanooga, TN-GA | 8.5 |
Clarksville, TN-KY | 9.5 |
Cleveland, TN | 8.5 |
Jackson, TN | 9.2 |
Johnson City, TN | 8.4 |
Kingsport-Bristol-Bristol, TN-VA | 8.1 |
Knoxville, TN | 7.5 |
Memphis, TN-MS-AR | 10.0 |
Morristown, TN | 10.2 |
Nashville-Davidson--Murfreesboro--Franklin, TN | 7.1 |
Texas | |
Abilene, TX | 5.7 |
Amarillo, TX | 5.3 |
Austin-Round Rock-San Marcos, TX | 5.8 |
Beaumont-Port Arthur, TX | 10.6 |
Brownsville-Harlingen, TX | 11.1 |
College Station-Bryan, TX | 6.4 |
Corpus Christi, TX | 6.5 |
Dallas-Fort Worth-Arlington, TX | 6.7 |
El Paso, TX | 9.8 |
Houston-Sugar Land-Baytown, TX | 6.7 |
Killeen-Temple-Fort Hood, TX | 7.8 |
Laredo, TX | 7.6 |
Longview, TX | 6.2 |
Lubbock, TX | 6.1 |
McAllen-Edinburg-Mission, TX | 11.6 |
Midland, TX | 3.7 |
Odessa, TX | 4.5 |
San Angelo, TX | 5.9 |
San Antonio-New Braunfels, TX | 6.7 |
Sherman-Denison, TX | 7.3 |
Texarkana, TX-Texarkana, AR | 7.3 |
Tyler, TX | 7.0 |
Victoria, TX | 6.0 |
Waco, TX | 6.9 |
Wichita Falls, TX | 6.6 |
Utah | |
Logan, UT-ID | 4.6 |
Ogden-Clearfield, UT | 5.2 |
Provo-Orem, UT | 5.3 |
St. George, UT | 6.1 |
Salt Lake City, UT | 5.0 |
Vermont | |
Burlington-South Burlington, VT Metropolitan NECTA | 4.2 |
Virginia | |
Blacksburg-Christiansburg-Radford, VA | 6.7 |
Charlottesville, VA | 5.5 |
Danville, VA | 8.4 |
Harrisonburg, VA | 6.1 |
Lynchburg, VA | 7.0 |
Richmond, VA | 6.3 |
Roanoke, VA | 6.3 |
Virginia Beach-Norfolk-Newport News, VA-NC | 6.4 |
Winchester, VA-WV | 5.5 |
Washington | |
Bellingham, WA | 7.5 |
Bremerton-Silverdale, WA | 7.3 |
Kennewick-Pasco-Richland, WA | 8.4 |
Longview, WA | 10.6 |
Mount Vernon-Anacortes, WA | 8.7 |
Olympia, WA | 7.5 |
Seattle-Tacoma-Bellevue, WA | 5.9 |
Spokane, WA | 8.1 |
Wenatchee-East Wenatchee, WA | 6.5 |
Yakima, WA | 8.7 |
West Virginia | |
Charleston, WV | 5.7 |
Huntington-Ashland, WV-KY-OH | 7.6 |
Morgantown, WV | 4.5 |
Parkersburg-Marietta-Vienna, WV-OH | 6.7 |
Wheeling, WV-OH | 6.9 |
Wisconsin | |
Appleton, WI | 6.5 |
Eau Claire, WI | 6.3 |
Fond du Lac, WI | 6.8 |
Green Bay, WI | 6.5 |
Janesville, WI | 8.5 |
La Crosse, WI-MN | 5.6 |
Madison, WI | 5.2 |
Milwaukee-Waukesha-West Allis, WI | 7.7 |
Oshkosh-Neenah, WI | 6.6 |
Racine, WI | 8.9 |
Sheboygan, WI | 6.4 |
Wausau, WI | 7.2 |
Wyoming | |
Casper, WY | 4.4 |
Cheyenne, WY | 4.9 |
Footnotes: | |
Yuma, Arizona, and El Centro, California, had the highest unemployment rates in June, 31.8 percent and 23.6 percent, respectively. Bismarck, North Dakota, had the lowest unemployment rate (2.8 percent), followed by Sioux Falls, South Dakota (3.4 percent), and Fargo, North Dakota-Minnesota (3.6 percent). A total of 207 areas had unemployment rates below the U.S. figure of 7.8 percent (not seasonally adjusted), 158 areas had rates above it, and 7 areas had rates equal to that of the nation.
From June 2012 to June 2013, El Centro, California, had the largest unemployment rate decrease (−5.4 percentage points). Yuma, Arizona, had the largest jobless rate increase (+3.4 percentage points). Twenty-four other areas had rate declines of at least 2.0 percentage points, and an additional 59 areas had declines between 1.0 and 1.9 points.
These metropolitan area data are from the Local Area Unemployment Statistics program and are not seasonally adjusted. Data for the most recent month are preliminary and subject to revision. To learn more, see "Metropolitan Area Employment and Unemployment — June 2013" (HTML) (PDF), news release USDL−13−1525.
Bureau of Labor Statistics, U.S. Department of Labor, The Economics Daily, Unemployment rates in June were lower than a year earlier in 272 of 372 metropolitan areas at https://www.bls.gov/opub/ted/2013/ted_20130801.htm (visited May 23, 2024).

