
An official website of the United States government
An official website of the United States government
The .gov means it's official.
Federal government websites often end in .gov or .mil. Before sharing sensitive information,
make sure you're on a federal government site.
The site is secure.
The
https:// ensures that you are connecting to the official website and that any
information you provide is encrypted and transmitted securely.
Among the 49 metropolitan areas with a Census 2000 population of 1 million or more, 44 reported over-the-year unemployment rate decreases, four areas registered increases, and one area had no change from June 2011 to June 2012.
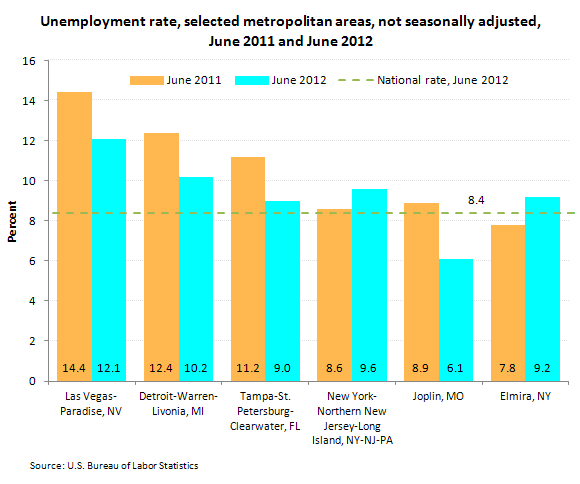
Las Vegas-Paradise, Nevada, experienced the largest unemployment rate decline from June 2011 (−2.3 percentage points), followed by Detroit-Warren-Livonia, Michigan, and Tampa-St. Petersburg-Clearwater, Florida (−2.2 points each). Twenty-six other large areas reported rate decreases of at least 1.0 percentage point. The largest over-the-year rate increase was recorded in New York-Northern New Jersey-Long Island, New York-New Jersey-Pennsylvania (+1.0 percentage point).
Among all metropolitan areas, the largest over-the-year unemployment rate decrease in June was registered in Joplin, Missouri (−2.8 percentage points). Elmira, New York, reported the largest over-the-year jobless rate increase (+1.4 percentage points).
The national unemployment rate in June was 8.4 percent (not seasonally adjusted), down from 9.3 percent a year earlier.
In June, 268 metropolitan areas reported over-the-year increases in nonfarm payroll employment, 96 reported decreases, and 8 had no change. The largest over-the-year employment increase occurred in New York-Northern New Jersey-Long Island, New York-New Jersey-Pennsylvania (+116,000). The largest over-the-year decrease in employment occurred in Dalton, Georgia (−4,600).
These metropolitan area data are not seasonally adjusted and are from the Local Area Unemployment Statistics and Current Employment Statistics (State and Area) programs. June 2012 data from both programs are preliminary and subject to revision. Find out more in "Metropolitan Area Employment and Unemployment — June 2012" (HTML) (PDF), news release USDL-12-1529.
Bureau of Labor Statistics, U.S. Department of Labor, The Economics Daily, Metropolitan area employment and unemployment, June 2012 at https://www.bls.gov/opub/ted/2012/ted_20120802.htm (visited May 23, 2024).

