An official website of the United States government
An official website of the United States government
The .gov means it's official.
Federal government websites often end in .gov or .mil. Before sharing sensitive information,
make sure you're on a federal government site.
The site is secure.
The
https:// ensures that you are connecting to the official website and that any
information you provide is encrypted and transmitted securely.
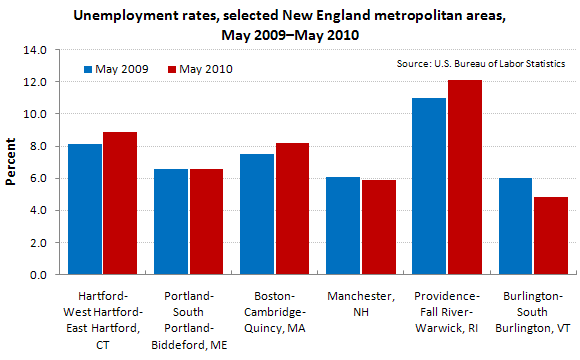
In May 2010, among metropolitan areas in New England, Burlington-South Burlington, Vermont, recorded the lowest unemployment rate (4.8 percent).
The unemployment rate in Providence-Fall River-Warwick, Rhode Island, was 12.1 percent, the second highest in New England after New Bedford, Massachusetts (12.6 percent).
Unemployment rates were higher in May than a year earlier in 15 of the 21 metropolitan areas in New England.
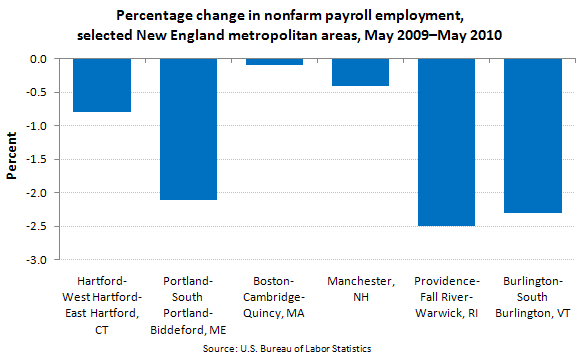
In May, 18 New England metropolitan areas reported over-the-year decreases in nonfarm payroll employment, and 3 reported increases.
These data are from the Local Area Unemployment Statistics and Current Employment Statistics (State and Metro Area) programs. Data for the most recent month are preliminary and subject to revision. To learn more, see "Metropolitan Area Employment and Unemployment — May 2010" (HTML) (PDF), news release USDL-10-0885. The New England BLS Information Office has links to additional data for the New England region.
Bureau of Labor Statistics, U.S. Department of Labor, The Economics Daily, Employment and unemployment in New England, May 2010 at https://www.bls.gov/opub/ted/2010/ted_20100702.htm (visited May 23, 2024).