An official website of the United States government
An official website of the United States government
The .gov means it's official.
Federal government websites often end in .gov or .mil. Before sharing sensitive information,
make sure you're on a federal government site.
The site is secure.
The
https:// ensures that you are connecting to the official website and that any
information you provide is encrypted and transmitted securely.
The labor force participation rate is the proportion of the working-age population that is either working or actively looking for work.1 This rate is an important labor market measure because it represents the relative amount of labor resources available for the production of goods and services. Though subject to some cyclical influences, labor force participation is primarily affected by longer-term structural changes.2 These might include changes in the age composition of the population, school enrollment and educational attainment, employer-provided pensions, or Social Security benefits.
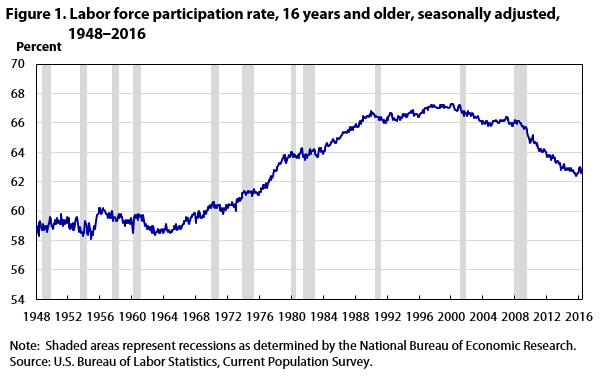
After trending up for more than three decades, the labor force participation rate peaked at 67.3 percent in early 2000. Over the next few years, the rate receded to about 66 percent and stayed at that level through 2008. The participation rate then dropped again, and by mid-2016, it stood at 62.7 percent. (See figure 1.)
This article describes historical trends in labor force participation on the basis of estimates from the Current Population Survey (CPS), and it focuses on the participation rate since its peak in 2000. It examines changes in labor force participation among major demographic groups and discusses possible reasons for these changes.
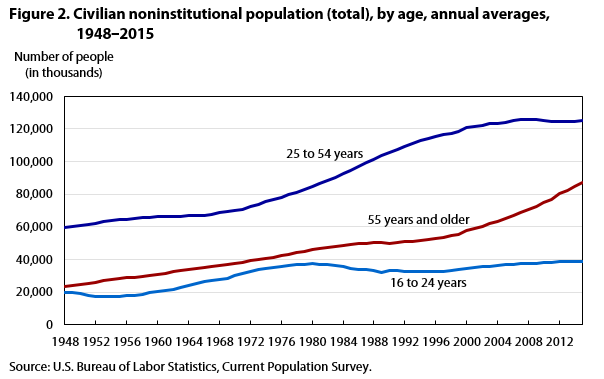
The age distribution of the population can strongly influence overall labor force participation. Figure 2 shows the change in the civilian noninstitutional population by major age group since 1948. For seven decades, the aging of the baby-boom generation—people born between 1946 and 1964—has profoundly affected the population’s size and composition. For example, the population 16–24 years increased from 21.5 million in 1962 to 36.7 million in 1978. From 1971 to 2000, the large population cohort 25–54 years grew from 70.9 million to 120.7 million. After the oldest baby boomers turned 55 in 2001, the population 55 years and older rose from 58.7 million in 2001 to 87.1 million in 2015.
After remaining in a range of about 58–60 percent during the 1950s and 1960s, the total labor force participation rate increased rapidly during the 1970s and 1980s. (See figure 1.) In the 1970s and 1980s, baby boomers entered the age cohorts of 25–34 years and 35–44 years, which typically have very high levels of labor force participation. In recent years, the baby-boom generation has moved into the 55-years-and-older age group, which traditionally has had a lower participation rate. As just mentioned, the oldest baby boomers—those born in 1946—reached age 55 in 2001. In 2001, people 55 years and older made up 27 percent of the total population; by 2015, they composed 35 percent.3 The aging of the population has put downward pressure on the overall labor force participation rate.
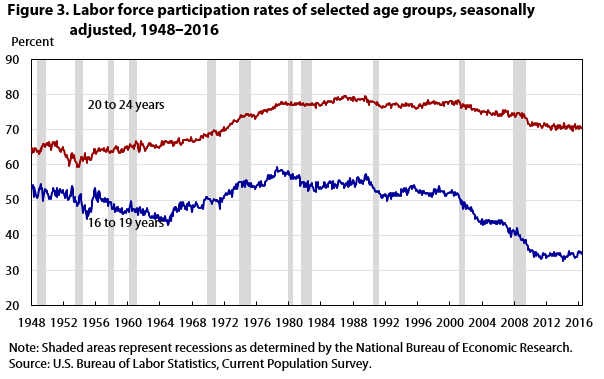
The labor force participation rate of teenagers 16–19 years peaked in the late 1970s and then began a downward trend. (See figure 3.) The participation rate of teenagers fell from 52.0 percent in 2000 to 34.1 percent in 2011 and stayed near that level through 2015.4 This decrease far exceeded the decline in the rates of other major age groups during this period.
From 2000 to 2015, the labor force participation rate of teenagers varied considerably by race and ethnicity. (See table 1.) In 2000, the participation rate ranged from 35.8 percent for Asian teenagers to 55.5 percent for White teenagers. Between 2000 and 2015, the participation rate of teenagers in each of the four major race and ethnicity groups fell sharply, with 2015 rates ranging from 20.6 percent for Asian teenagers to 36.4 percent for White teenagers. The decline in teenage labor force participation during this period coincided with a rise in the school enrollment rate—that is, the proportion of the population enrolled in school.
| Group | 2000 | 2015 | Change, 2000–15 |
|---|---|---|---|
Total, 16 to 19 years | |||
Total | 52.0 | 34.3 | –17.7 |
White | 55.5 | 36.4 | –19.1 |
Black or African American | 39.4 | 28.1 | –11.3 |
Asian | 35.8 | 20.6 | –15.2 |
Hispanic or Latino | 46.3 | 30.9 | –15.4 |
Total, 20 to 24 years | |||
Total | 77.8 | 70.7 | –7.1 |
White | 79.9 | 72.7 | –7.2 |
Black or African American | 71.8 | 68.2 | –3.6 |
Asian | 63.0 | 52.8 | –10.2 |
Hispanic or Latino | 78.2 | 71.6 | –6.6 |
Men, 25 to 54 years | |||
Total | 91.6 | 88.3 | –3.3 |
White | 92.7 | 89.5 | –3.2 |
Black or African American | 84.4 | 80.9 | –3.5 |
Asian | 91.7 | 89.2 | –2.5 |
Hispanic or Latino | 92.5 | 90.8 | –1.7 |
Women, 25 to 54 years | |||
Total | 76.7 | 73.7 | –3.0 |
White | 76.8 | 73.9 | –2.9 |
Black or African American | 78.9 | 76.5 | –2.4 |
Asian | 71.3 | 67.8 | –3.5 |
Hispanic or Latino | 67.6 | 66.3 | –1.3 |
Men, 55 years and older | |||
Total | 40.1 | 45.9 | 5.8 |
White | 40.3 | 46.4 | 6.1 |
Black or African American | 36.0 | 39.9 | 3.9 |
Asian | 46.6 | 50.6 | 4.0 |
Hispanic or Latino | 45.2 | 51.2 | 6.0 |
Women, 55 years and older | |||
Total | 26.1 | 34.7 | 8.6 |
White | 25.9 | 34.5 | 8.6 |
Black or African American | 27.0 | 34.7 | 7.7 |
Asian | 29.2 | 37.6 | 8.4 |
Hispanic or Latino | 24.0 | 33.3 | 9.3 |
Note: Persons whose ethnicity is identified as Hispanic or Latino may be of any race. Source: U.S. Bureau of Labor Statistics, Current Population Survey. | |||
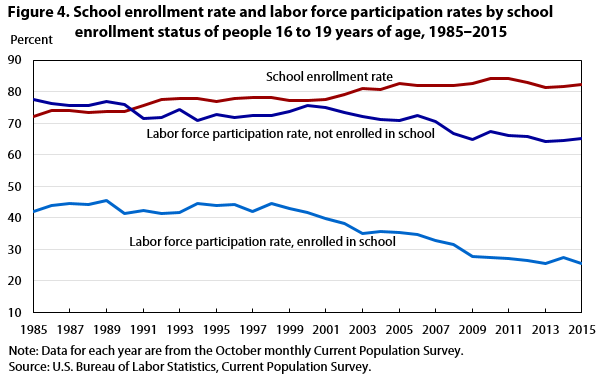
Between 2000 and 2015, the school enrollment rate of teenagers increased from 77.2 percent to 82.3 percent.5 (See figure 4.) The rising school enrollment rate among teenagers could have contributed to their falling labor force participation rate, because those enrolled in school are much less likely to participate in the labor force. From 2000 to 2015, the labor force participation rate of teenagers enrolled in school fell from 41.8 percent to 25.5 percent.
A recent study examined data on the self-reported reasons that people who were not in the labor force did not work.6 Among teenagers, the most often cited reason for not working was school attendance. Researchers have suggested that, among youth enrolled in school, part of the drop in labor force participation might be due to a rise in educational intensity, such as an increase in time devoted to schoolwork or other extracurricular activities.7
Teenagers who are not enrolled in school are generally more likely to participate in the labor force than teenagers who are enrolled in school. However, the labor force participation rate of out-of-school teenagers also fell, from 75.7 percent in 2000 to 65.3 percent in 2015. (See figure 4.) For some teenagers, work might have become less desirable because of, for example, stagnant wages: over the 2000–15 period, inflation-adjusted hourly earnings for teenagers were flat. Researchers have suggested that not-enrolled teenagers might face competition for jobs (in retail trade and food services, for example) from less-skilled adult workers.8
Adults 20–24 years are more likely than teenagers to participate in the labor force. The labor force participation rate of adults 20–24 years peaked around 79 percent in the late 1980s. (See figure 3.) After declining during the early 1990s, the rate then remained relatively flat for several years. Although labor force participation among young adults fell between 2000 and 2015, the decline was less steep than that of teenagers. From 2000 to 2015, the participation rate of young adults fell by 7.1 percentage points, compared with a drop of 17.7 percentage points among teenagers.9
Among young adults in 2000, the participation rate was lowest for Asians (63.0 percent) and highest for Whites (79.9 percent). (Labor force participation rates of the four major race and ethnicity groups showed a similar ranking in 2015.) From 2000 to 2015, the participation rate of young adults declined in each of the four major race and ethnicity groups; the drop was largest (–10.2 percentage points) among Asians. (See table 1.)
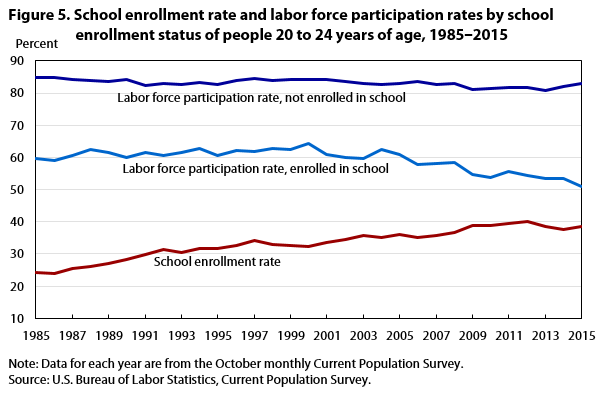
Although school enrollment rates of teenagers and young adults have increased substantially over the past several decades, enrollment rates of young adults have remained lower than the rates of teenagers because many young adults have completed their formal education. As figures 4 and 5 show, only 38.5 percent of young adults were enrolled in school in 2015, compared with 82.3 percent of teenagers.
As was the case with teenagers, the labor force participation rate of young adults enrolled in school was lower than that of young adults who were not in school. The labor force participation rate for both groups fell between 2000 and 2015. The labor force participation rate of young adults enrolled in school fell from 64.2 percent in 2000 to 51.0 percent in 2015, whereas the participation rate of young adults not enrolled in school edged down from 84.3 percent in 2000 to 83.0 percent in 2015. (See figure 5.) During the same period, the proportion of young adults enrolled in school rose from 32.2 percent to 38.5 percent.
Of young adults who were neither enrolled in school nor participated in the labor force in 2015, 61 percent were women and 20 percent had less than a high school diploma. The labor force participation rate of young women not enrolled in school and with less than a high school diploma was only 52.6 percent, or 23.7 percentage points lower than the rate for their male counterparts. (See table 2.) The lower participation rate of young women could reflect that some were caring for young children. In 2015, 49 percent of women 20–24 years who were not enrolled in school and had less than a high school diploma were mothers, and 24 percent of women in this age group who were not enrolled in school and had a high school diploma or more were mothers. In 2015, only 7 percent of women 20–24 years enrolled in school were mothers.
Between 2000 and 2015, individuals with less education generally had the largest declines in labor force participation. At all levels of educational attainment, the labor force participation rate of young men who were not enrolled in school was higher than that of their female counterparts. (See table 2.) The gap in participation rates between young men and women narrowed at higher levels of educational attainment. Among people with at least a bachelor’s degree who were not enrolled in school in 2015, young women had a labor force participation rate of 90.7 percent, compared with 93.4 percent for their male counterparts.
| Characteristic | 2000 | 2015 | Change, 2000–15 |
|---|---|---|---|
Men | |||
Total, 20 to 24 years | 91.2 | 86.1 | –5.1 |
Less than a high school diploma | 86.7 | 76.3 | –10.4 |
High school graduates, no college | 91.0 | 84.7 | –6.3 |
Some college, no degree | 92.8 | 87.1 | –5.7 |
Associate’s degree | 97.4 | 92.2 | –5.2 |
Bachelor’s degree and higher | 95.6 | 93.4 | –2.2 |
Women | |||
Total, 20 to 24 years | 77.4 | 77.3 | –.1 |
Less than a high school diploma | 53.3 | 52.6 | –.7 |
High school graduates, no college | 77.2 | 72.6 | –4.6 |
Some college, no degree | 84.1 | 80.0 | –4.1 |
Associate’s degree | 88.0 | 84.9 | –3.1 |
Bachelor’s degree and higher | 90.1 | 90.7 | .6 |
| Source: U.S. Bureau of Labor Statistics, Current Population Survey. | |||
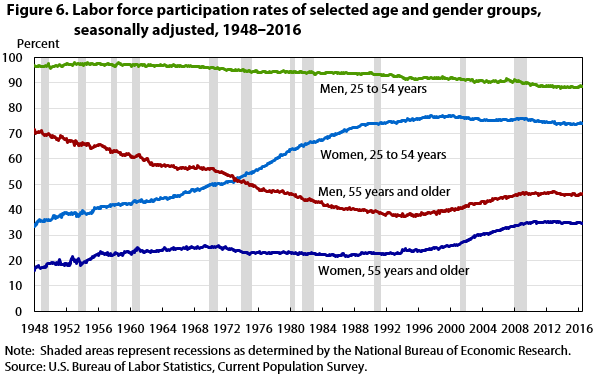
The participation rate of women 25–54 years increased throughout the second half of the 20th century, although the pace of the increase varied over time. (See figure 6.) The most rapid rise in women’s labor force participation occurred during the 1970s and 1980s. The participation rate of women 25–54 years peaked at 76.8 percent in 1999. Subsequently, the participation rate receded slightly and flattened at 75.5 percent from 2003 to 2009. It then declined to 73.7 percent in 2015, still above the rate in the 1970s and 1980s.
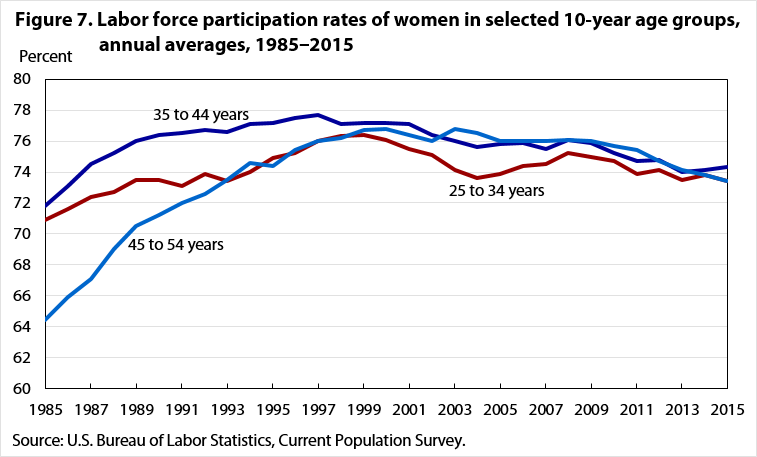
In 1985, the participation rate of women 45–54 years was much lower than the rates of women 25–34 years and 35–44 years; by 2015, participation rates among the three age groups were similar. (See figure 7.) Between 2000 and 2015, the participation rate of each 10-year age group fell, and the 45- to 54-year age group experienced a slightly larger decline (–3.4 percentage points) than the groups 25–34 years and 35–44 years (–2.7 percentage points and –2.9 percentage points, respectively).
Between 2000 and 2015, the labor force participation rate of women 25–54 years varied by race and ethnicity. (See table 1.) In 2000, the participation rate ranged from 67.6 percent for Hispanic women to 78.9 percent for Black women. From 2000 to 2015, the labor force participation rate of women in each of the four major race and ethnicity groups declined. The drop in labor force participation was steepest for Asian women (–3.5 percentage points). In 2015, the participation rate ranged from 66.3 percent for Hispanic women to 76.5 percent for Black women.
From 2000 to 2015, the labor force participation rate of women was higher among those with more education. (See table 3.) During this period, the decline in labor force participation was most pronounced for women with less than a high school diploma (–7.1 percentage points) and for those with a high school diploma and no college (–7.9 percentage points). The participation rate of women with at least a bachelor’s degree changed little (–0.6 percentage point) over the 2000–15 period. In 2015, among women 25–54 years, the participation rate ranged from 49.1 percent for those with less than a high school diploma to 82.3 percent for those with at least a bachelor’s degree.
| Gender by year | Less than a high school diploma | High school graduates, no college | Some college, no degree | Associate’s degree | Bachelor’s degree and higher |
|---|---|---|---|---|---|
Men | |||||
1995 | 79.5 | 91.2 | 92.3 | 94.8 | 96.1 |
2000 | 82.1 | 90.7 | 91.9 | 93.9 | 95.8 |
2005 | 82.0 | 89.1 | 90.6 | 93.2 | 94.9 |
2006 | 82.7 | 89.0 | 90.7 | 93.0 | 95.0 |
2007 | 82.7 | 89.1 | 91.0 | 93.3 | 95.4 |
2008 | 82.3 | 88.7 | 90.4 | 93.1 | 95.2 |
2009 | 81.2 | 87.6 | 89.4 | 92.2 | 95.1 |
2010 | 81.0 | 87.1 | 88.6 | 92.0 | 94.5 |
2011 | 80.6 | 86.1 | 87.5 | 91.1 | 94.5 |
2012 | 79.3 | 86.0 | 87.7 | 91.5 | 94.5 |
2013 | 79.3 | 85.4 | 87.5 | 91.4 | 94.2 |
2014 | 79.6 | 85.0 | 86.8 | 91.0 | 94.1 |
2015 | 79.5 | 84.8 | 87.3 | 91.6 | 93.9 |
Change | |||||
1995–2000 | 2.6 | –.5 | –.4 | –.9 | –.3 |
1995–2015 | 0.0 | –6.4 | –5.0 | –3.2 | –2.2 |
2000–15 | –2.6 | –5.9 | –4.6 | –2.3 | –1.9 |
Women | |||||
1995 | 50.9 | 74.0 | 78.5 | 83.1 | 84.6 |
2000 | 56.2 | 74.9 | 78.8 | 83.3 | 82.9 |
2005 | 53.1 | 72.5 | 76.7 | 82.6 | 82.2 |
2006 | 53.0 | 72.7 | 76.9 | 82.1 | 82.5 |
2007 | 52.4 | 72.1 | 77.0 | 82.7 | 82.2 |
2008 | 52.0 | 72.2 | 77.2 | 82.8 | 83.0 |
2009 | 52.7 | 71.7 | 76.2 | 82.6 | 83.2 |
2010 | 52.2 | 71.5 | 75.8 | 81.6 | 82.6 |
2011 | 51.6 | 70.2 | 74.8 | 81.6 | 82.3 |
2012 | 51.7 | 69.3 | 73.9 | 81.4 | 82.6 |
2013 | 49.9 | 68.4 | 73.0 | 80.0 | 82.4 |
2014 | 49.3 | 68.2 | 73.4 | 79.6 | 82.4 |
2015 | 49.1 | 67.0 | 73.4 | 79.6 | 82.3 |
Change | |||||
1995–2000 | 5.3 | .9 | .3 | .2 | –1.7 |
1995–2015 | –1.8 | –7.0 | –5.1 | –3.5 | –2.3 |
2000–15 | –7.1 | –7.9 | –5.4 | –3.7 | –.6 |
| Source: U.S. Bureau of Labor Statistics, Current Population Survey. | |||||
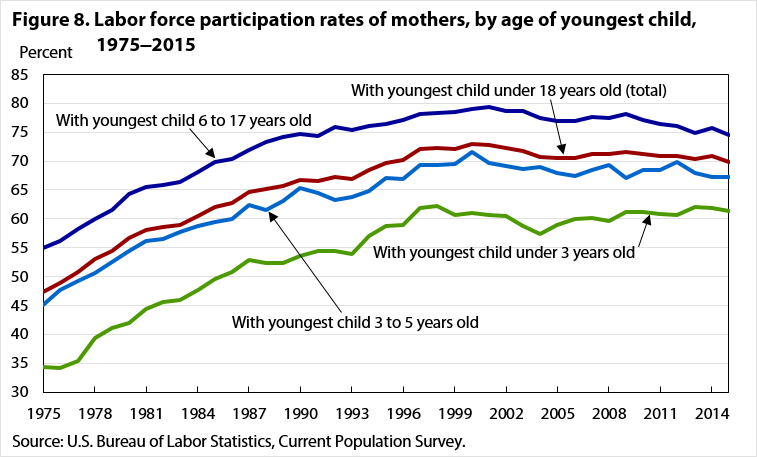
As figure 8 shows, the labor force participation rate of mothers whose youngest child was under 18 years old increased steadily during the 1970s and 1980s. This steady increase contributed to the rise in women’s overall participation during this period. Although the 1990s saw small gains, the labor force participation rate of mothers whose youngest child was under 18 years old peaked at 72.9 percent in 2000 and subsequently receded.
As in previous years, mothers whose youngest child was between 6 and 17 years of age were more likely to participate in the labor force (74.6 percent) in 2015 than mothers whose youngest child was between 3 and 5 years of age (67.3 percent) or mothers whose youngest child was under 3 years old (61.4 percent). Presumably, when mothers have young children, they have less time to engage in labor market activities. Data from the American Time Use Survey show that parents of infants spend much more time caring for children relative to parents of older children.10
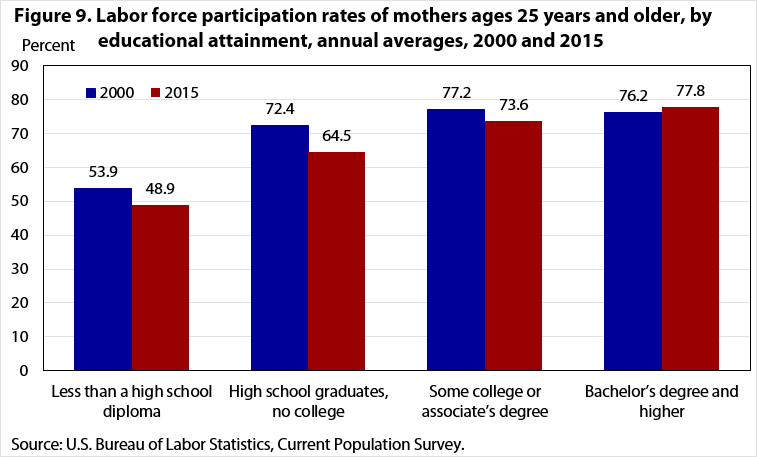
Among mothers whose youngest child was under 18 years of age, the labor force participation rate of those with at least a bachelor’s degree edged up from 76.2 percent in 2000 to 77.8 percent in 2015. (See figure 9.) By contrast, the participation rate of mothers with a high school diploma and no college declined during this period, from 72.4 percent to 64.5 percent, while the rate of mothers with less than a high school diploma fell from 53.9 percent to 48.9 percent. The participation rate of mothers with some college or an associate’s degree declined from 77.2 percent to 73.6 percent.
A noteworthy development in the labor force over the past six decades has been the slow decline in the labor force participation rate of men 25–54 years.11 After peaking at 97.4 percent in the mid-1950s, the participation rate of men 25–54 years fell to about 88 percent in 2015. (See figure 6.) The rate fell by an average of 1.2 percentage points per decade between 1960 and 1990, and it declined more rapidly between 1990 and 2015. The rate decreased by 1.8 percentage points between 1990 and 2000 and by 2.3 percentage points between 2000 and 2010. From 2010 to 2015, the participation rate of men 25–54 years edged down by 1.0 percentage point.
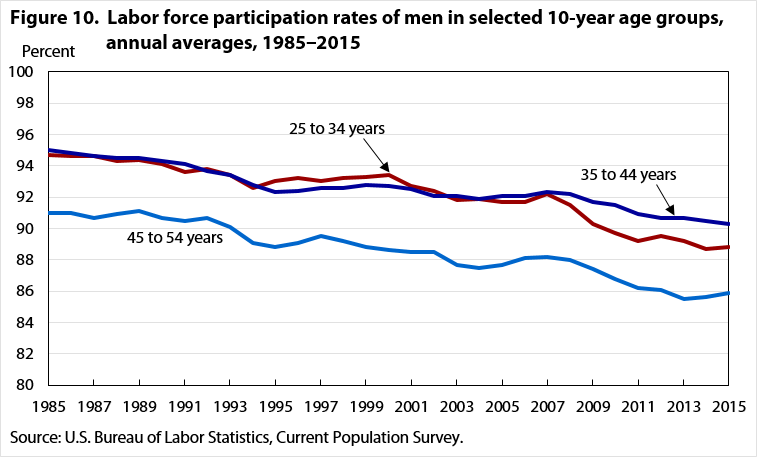
Within the 25- to 54-year age group, men 45–54 years were less likely to participate in the labor force than those in the 25- to 34-year and 35- to 44-year age groups. The labor force participation rate of each 10-year age group declined between 2000 and 2015. (See figure 10.)
In 2000, among those 25–54 years, the participation rate of Black men was 84.4 percent; in contrast, the rates for Asians, Whites, and Hispanics were in the low 90s. (See table 1.) The participation rate of men in each of the major race and ethnicity groups declined between 2000 and 2015. The declines were somewhat larger for White and Black men (–3.2 percent and –3.5 percent, respectively). In 2015, the participation rate of Black men, at 80.9 percent, remained considerably lower than the rates of men in the other major race and ethnicity groups.
As was the case with women, men with more education were more likely to participate in the labor force. In 2015, participation rates ranged from 79.5 percent for men with less than a high school diploma to 93.9 percent for men with at least a bachelor’s degree. (See table 3.) The largest declines in participation between 2000 and 2015 were among men with a high school diploma and no college (–5.9 percentage points) and those with some college but no degree (–4.6 percentage points). By comparison, from 2000 to 2015, the decreases in the labor force participation rate of men with an associate’s degree and those with at least a bachelor’s degree were smaller (–2.3 and –1.9 percentage points, respectively).12
One reason for the large decline in participation among men who did not attend college could be that the types of jobs available to this group might have become less desirable and lower paying. Among men, inflation-adjusted wages for those with less than a high school diploma and those with a high school diploma (no college) fell over the 2000–15 period by 6.8 and 6.6 percent, respectively; by contrast, inflation-adjusted wages for those with at least a bachelor’s degree edged up by 1.2 percent over this period.13 Researchers have suggested that employment opportunities of less-educated men have deteriorated in part because technology has changed and globalization increased.14
Researchers have suggested that an increase in the number of people receiving Social Security disability insurance (SSDI) benefits has contributed to the decline in labor force participation among both men and women.15 The SSDI program was enacted into law in 1956 and was meant to provide income for people with severe disabilities who are unable to work.16 Over time, changes in eligibility requirements for SSDI benefits may have increased the number of beneficiaries.17 The number of men 25–54 years who received SSDI benefits rose from 1.6 million (or 2.7 percent of men in this age group) in 2000 to 2.0 million (or 3.2 percent) in 2014.18 The decline in labor force participation of men over this period coincided with the increase in disability recipients.19
In addition, researchers have suggested that expansion of the Department of Veterans Affairs disability compensation program might have contributed to the decrease in labor force participation among male veterans.20 From 2003 to 2015, the veterans supplement to the CPS showed an increase in the incidence of disability. The number of male veterans 25–54 years who reported a service-connected disability rose from 726,000 (or 9.3 percent of this population) in 2003 to 1.5 million (or 24.1 percent) in 2015. The number who reported a severe disability increased from 134,000 (or 1.7 percent) in 2003 to 492,000 (or 7.9 percent) in 2015.21 In 2015, the labor force participation rate of male veterans 25–54 years was 86.0 percent, compared with 88.5 percent for male nonveterans. However, between 2000 and 2015, the drop in the labor force participation rate of veterans (from 89.5 to 86.0 percent) was similar to that of nonveterans (from 92.1 to 88.5 percent).
The labor force participation rate of women 55 years and older increased slightly during the early 1950s before remaining in a range of about 23–25 percent over the next four decades. (See figure 6.) In 1997, the participation rate began to rise again, and in 2000, the pace of the increase accelerated. The rate rose from 26.1 percent in 2000 to 34.7 percent in 2009. From 2009 to 2015, the participation rate of women 55 years and older remained around 35 percent.22
As mentioned earlier, the oldest baby boomers turned age 55 in 2001, 62 in 2008, and 65 in 2011. Labor force participation trends closely track age requirements for receiving Social Security earnings benefits.23 Data show that participation fell substantially when individuals reach age 62 (the age they first become eligible for Social Security benefits) and again at age 65 (the age they become eligible for full Social Security benefits). In 2015, the rate for women fell by 4.6 percentage points at age 62 and by 4.8 percentage points at age 65. (See table 4.) For men, the decreases at age 62 and age 65 were 7.3 percentage points and 6.5 percentage points, respectively. The rise in the number of baby boomers eligible to receive Social Security benefits may have slowed the increase in participation of women 55 years and older.24
| Age (years) | Men | Women | ||||
|---|---|---|---|---|---|---|
| 2000 | 2015 | Change 2000–15 | 2000 | 2015 | Change 2000–15 | |
Total, 55 and older | 40.1 | 45.9 | 5.8 | 26.1 | 34.7 | 8.6 |
55 | 79.8 | 80.6 | .8 | 65.2 | 70.2 | 5.0 |
56 | 79.7 | 78.0 | –1.7 | 64.9 | 67.6 | 2.7 |
57 | 77.9 | 77.5 | –.4 | 61.8 | 67.2 | 5.4 |
58 | 75.6 | 76.5 | .9 | 58.4 | 64.3 | 5.9 |
59 | 71.0 | 72.4 | 1.4 | 55.6 | 62.1 | 6.5 |
60 | 66.2 | 70.3 | 4.1 | 51.5 | 57.6 | 6.1 |
61 | 65.9 | 67.8 | 1.9 | 46.4 | 54.7 | 8.3 |
62 | 53.0 | 60.5 | 7.5 | 38.7 | 50.1 | 11.4 |
63 | 44.0 | 55.6 | 11.6 | 33.6 | 44.6 | 11.0 |
64 | 43.2 | 51.3 | 8.1 | 29.9 | 40.4 | 10.5 |
65 | 35.9 | 44.8 | 8.9 | 23.2 | 35.6 | 12.4 |
66 | 32.7 | 39.6 | 6.9 | 21.6 | 30.0 | 8.4 |
67 | 30.3 | 35.2 | 4.9 | 19.3 | 26.7 | 7.4 |
68 | 28.1 | 32.6 | 4.5 | 16.6 | 24.4 | 7.8 |
69 | 23.8 | 29.7 | 5.9 | 16.4 | 21.3 | 4.9 |
70 | 20.2 | 27.3 | 7.1 | 10.9 | 18.7 | 7.8 |
71 | 18.0 | 25.3 | 7.3 | 11.6 | 16.2 | 4.6 |
72 | 18.5 | 22.7 | 4.2 | 10.8 | 13.9 | 3.1 |
73 | 18.7 | 20.3 | 1.6 | 9.6 | 12.8 | 3.2 |
74 | 14.1 | 16.8 | 2.7 | 7 | 11.9 | 4.9 |
75 and older | 8.1 | 11.2 | 3.1 | 3.6 | 6.0 | 2.4 |
| Source: U.S. Bureau of Labor Statistics, Current Population Survey. | ||||||
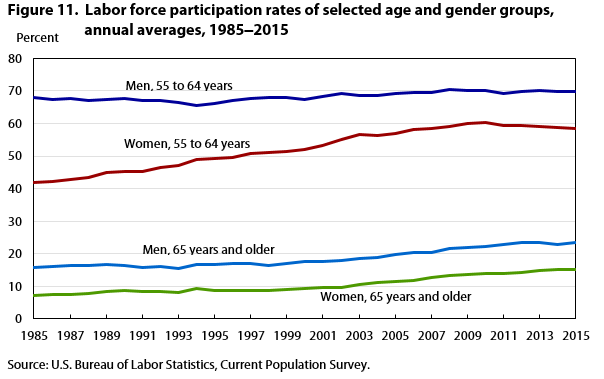
As just mentioned, labor force participation tends to fall when people turn 65. In 2015, the rate for women 55–64 years was 58.5 percent, compared with 15.3 percent for women 65 years and older. (See figure 11.) From 1985 to 2009, the participation rate for women 55–64 years rose steadily, but since 2009, the rate for this group has been flat (around 59 percent). The participation rate for women 65 years and older increased slightly during the late 1980s before holding steady near 9 percent during the 1990s. The rate increased from 8.9 percent in 1999 to 15.3 percent in 2015.25
Between 2000 and 2015, the labor force participation rate of women 55 years and older differed by race and ethnicity. (See table 1.) In 2000, the participation rate ranged from 24.0 percent for Hispanic women to 29.2 percent for Asian women. Between 2000 and 2015, the participation rate of women in each of the four major race and ethnicity groups increased. In 2015, the labor force participation rate ranged from 33.3 percent for Hispanic women to 37.6 percent for Asian women.
From 2000 to 2015, labor force participation of women 55 years and older was greater at higher levels of education. (See table 5.) Between 2000 and 2015, participation rates rose for women in each of the educational attainment categories, but the increases were larger for women with more education. In 2015, the participation rate of women 55 years and older ranged from 16.0 percent for those with less than a high school diploma to 47.1 percent for those with at least a bachelor’s degree.
| Characteristic | 2000 | 2015 | Change, 2000–15 |
|---|---|---|---|
Men | |||
Total, 55 years and older | 40.1 | 45.9 | 5.8 |
Less than a high school diploma | 25.3 | 30.1 | 4.8 |
High school graduates, no college | 38.8 | 41.2 | 2.4 |
Some college, no degree | 44.6 | 46.4 | 1.8 |
Associate’s degree | 46.9 | 50.6 | 3.7 |
Bachelor’s degree and higher | 52.6 | 55.3 | 2.7 |
Women | |||
Total, 55 years and older | 26.1 | 34.7 | 8.6 |
Less than a high school diploma | 12.7 | 16.0 | 3.3 |
High school graduates, no college | 25.7 | 28.8 | 3.1 |
Some college, no degree | 31.9 | 36.8 | 4.9 |
Associate’s degree | 35.7 | 43.3 | 7.6 |
Bachelor’s degree and higher | 41.4 | 47.1 | 5.7 |
| Source: U.S. Bureau of Labor Statistics, Current Population Survey. | |||
One of the most striking labor market trends during the second half of the 20th century was the steep decline in labor force participation among men 55 years and older. The labor force participation rate of older men decreased from 70.6 percent in 1948 to 37.7 percent in 1993. (See figure 6.) After remaining flat during 1994–95, the participation rate began to rise in 1996, and in 2000, the pace of the increase accelerated. The participation rate of older men rose from 40.1 percent in 2000 to 46.8 percent in 2012. Since 2012, the participation rate of older men has held steady (around 46 percent). As mentioned previously, the oldest baby boomers recently reached the age required to receive Social Security retirement benefits, which might have slowed the increase in labor force participation among men 55 years and older.
Men 55–64 years had much higher participation rates than men 65 years and older. (See figure 11.) From 1985 to 2001, the rate for men 55–64 years held in a narrow range of 66–68 percent; then, during 2001–08, the participation rate edged up to 70 percent and remained flat through 2015. From 1985 to 1998, the participation rate for men 65 years and older hovered around 16 percent. However, since 1998, the rate increased gradually and reached 23.4 percent in 2015.
Among those 55 years and older in 2000, the labor force participation rate was lowest among Black men (36.0 percent) and highest among Asian men (46.6 percent). (See table 1.) From 2000 to 2015, the participation rate of men 55 years and older increased in each of the major race and ethnic groups. In 2015, the participation rate ranged from 39.9 percent for Black men to 51.2 percent for Hispanic men.
As seen in other demographic groups, men 55 years and older with more education were more likely to participate in the labor force. In 2000, the participation rate ranged from 25.3 percent for men with less than a high school diploma to 52.6 percent for men with at least a bachelor’s degree. (See table 5.) The participation rate of older men in each educational attainment category rose from 2000 to 2015. In 2015, the participation rate ranged from 30.1 percent for men with less than a high school diploma to 55.3 percent for men with at least a bachelor’s degree.
Some possible explanations for the rise in labor force participation among older men and women since the mid-1990s are well documented.26 These explanations include changes to Social Security laws, changes to private retirement plans, increased life expectancy, rising healthcare costs, and increased educational attainment of older adults.27
After rising steadily for more than three decades, the overall labor force participation rate peaked at 67.3 percent in early 2000 and subsequently fell to 62.7 percent by mid-2016. In recent years, the movement of the baby-boom population into age groups that generally exhibit low labor force participation has placed downward pressure on the overall participation rate.
From 2000 to 2015, the decline in participation occurred across most of the major demographic groups. Teenagers experienced the steepest drop in participation, which coincided with a rise in their school enrollment rate. Yet, labor force participation rates of both teenagers enrolled and not enrolled in school fell since 2000. Adults 20–24 years showed a decrease in labor force participation that was less steep than that of teenagers. The young adults least likely to participate in the labor force were those without a high school diploma, in particular young women, especially mothers.
The labor force participation of women 25–54 years also declined from 2000 to 2015. This decrease was most pronounced for women who did not attend college. Women with a college degree experienced a much smaller reduction in labor force participation. Since 2000, labor force participation of mothers with children under 18 years old has receded; the declines were larger among less-educated mothers.
The labor force participation of men 25–54 years continued to decline from 2000 to 2015. The decrease in participation among men with less education was greater than that of men with more education.
The labor force participation of men and women 55 years and older rose from 2000 to 2009 and subsequently leveled off. This plateau could be attributed partially to the fact that the oldest baby boomers reached age 62 in 2008 and became eligible for Social Security retirement benefits.
Steven F. Hipple, "Labor force participation: what has happened since the peak?," Monthly Labor Review, U.S. Bureau of Labor Statistics, September 2016, https://doi.org/10.21916/mlr.2016.43
1 The data in this article are based on information collected in the Current Population Survey (CPS), a monthly sample survey of about 60,000 households nationwide, that the U.S. Census Bureau conducts for the U.S. Bureau of Labor Statistics. The labor force is defined as the sum of the employed and unemployed. In the CPS, people are considered employed if they did any work for pay or profit during the survey reference week (that is, the Sunday to Saturday that includes the 12th day of the month). People are classified as unemployed if they do not have a job, actively looked for work in the prior 4 weeks, and are currently available to work. (Workers expecting to be recalled from temporary layoff are counted as unemployed whether or not they have engaged in a specific job-seeking activity.) Actively looking for work may consist of activities such as contacting an employer directly or having a job interview, contacting a public or private employment agency, contacting friends or family about a job, and contacting a school or university employment center. Other active job search methods include submitting resumes or filling out applications, placing or answering job advertisements, and checking union or professional registers.
2 A study by economists at the Council of Economic Advisers concluded that, since 2007, about one-half of the decrease in labor force participation was due to the aging of the population, about one-sixth of the decline was due to cyclical factors, and about one-third of the decrease was due to “other reasons.” See The labor force participation rate since 2007: causes and policy implications (Executive Office of the President of the United States, Council of Economic Advisers, July 2014), https://obamawhitehouse.archives.gov/sites/default/files/docs/labor_force_participation_report.pdf. Another study concluded that one-half to two-thirds of the decrease in labor force participation from late 2007 to early 2014 was due to the aging of the population; about one-third was due to the lagged influence of high, and especially long-term, unemployment. See William R. Cline (with Jared Nolan), Demographic versus cyclical influences on U.S. labor force participation, Working Paper no. 14.4 (Washington, DC: Peterson Institute for International Economics), July 2014. Economists at the Federal Reserve have published numerous papers on the recent behavior of the labor force participation rate. For instance, one study suggested that much of the drop in labor force participation since 2007 has been due to ongoing structural influences rather than pronounced cyclical weakness related to workers’ discouragement over job prospects. See Stephanie Aaronson, Tomaz Cajner, Bruce Fallick, Felix Galbis-Reig, Christopher L. Smith, and William Wascher, Labor force participation: recent developments and future prospects (Board of Governors of the Federal Reserve System, Federal Reserve Bank of Cleveland, September 2014), http://www.federalreserve.gov/pubs/feds/2014/201464/201464abs.html. James Bullard of the Federal Reserve Bank of St. Louis also provided an overview of research on labor force participation; see The rise and fall of labor force participation in the United States (Federal Reserve Bank of St. Louis Review, First Quarter 2014, 96(1), pp. 1–12, http://research.stlouisfed.org/publications/review/2014/q1/bullard.pdf. For a detailed analysis of projected changes in the labor force from 2014 to 2024, see Mitra Toossi, “Labor force projections to 2024: the labor force is growing, but slowly,” Monthly Labor Review, December 2015, https://www.bls.gov/opub/mlr/2015/article/labor-force-projections-to-2024.htm.
3 Julie L. Hotchkiss concluded that much of the decline in labor force participation during the 2000s could be explained by changing population shares. See her paper, Decomposing changes in the aggregate labor force participation rate, Working Paper no. 2009-6a (Federal Reserve Bank of Atlanta, July 2009), https://www.frbatlanta.org/research/publications/wp/2009/06.aspx. For more information on the impact of aging on labor supply, see Bruce Fallick, Charles Fleischman, and Jonathan Pingle, “The effect of population aging on the aggregate labor market,” in Katharine G. Abraham, James R. Spletzer, and Michael Harper, eds., Labor in the new economy (Chicago, IL: University of Chicago Press, 2010), pp. 377–417, http://www.nber.org/books/abra08-1.
4 Participation rates of both male and female teenagers fell sharply from 2000 to 2015. The rate for male teenagers fell from 52.8 percent to 34.2 percent; the rate for female teenagers dropped from 51.2 percent to 34.4 percent.
5 Data on school enrollment are from the October monthly Current Population Survey. For more information on employment and school enrollment trends among youth during the summer and school year, see Teresa L. Morisi, “The early 2000s: a period of declining teen summer employment rates,” Monthly Labor Review, May 2010, pp. 23–35, https://www.bls.gov/opub/mlr/2010/05/art2full.pdf; and Teresa L. Morisi, “Youth enrollment and employment during the school year,” Monthly Labor Review, February 2008, pp. 51–63, https://www.bls.gov/opub/mlr/2008/02/art3full.pdf.
6 See Steven F. Hipple, “People who are not in the labor force: why aren’t they working?” Beyond the Numbers, vol. 4, no. 15, December 2015, https://www.bls.gov/opub/btn/volume-4/people-who-are-not-in-the-labor-force-why-arent-they-working.htm.
7 See Aaronson et al., Labor force participation, pp. 23–26.
8 Ibid., p. 26.
9 The decrease in labor force participation from 2000 to 2015 was larger for young men than for young women. The rate for young men fell by 9.6 percentage points, whereas the rate for young women declined by 4.8 percentage points.
10 Robert Drago, “The parenting of infants: a time-use study,” Monthly Labor Review, October 2009, pp. 33–43, https://www.bls.gov/opub/mlr/2009/10/art3full.pdf.
11 A recent study by economists at the Council of Economic Advisers examined the long-term decline in labor force participation of men 25–54 years. See The long-term decline in prime-age male labor force participation (Executive Office of the President of the United States, Council of Economic Advisers, June 2016), https://obamawhitehouse.archives.gov/sites/default/files/page/files/20160620_cea_primeage_male_lfp.pdf.
12 The labor force participation rate of less-educated men has been falling for many years. From 1970 to 2015, the labor force participation rate of men 25‒54 years with less than a high school diploma declined from 93.6 percent to 79.3 percent. The participation rate of men 25‒54 years with a high school diploma and no college fell from 97.6 percent to 85.3 percent during this period. (Data for each year are from the March monthly Current Population Survey.)
13 Wages refer to median weekly earnings of men 25 years and older, in constant 2015 dollars. The change in wages occurred between 2000 and 2015.
14 See David H. Autor and Melanie Wasserman, Wayward sons: the emerging gender gap in labor markets and education (Washington, DC: Third Way, April 2013), http://economics.mit.edu/files/8754.
15 See Aaronson et al., Labor force participation, pp. 234–35; and Robert E. Hall, “Quantifying the lasting harm to the U.S. economy from the financial crisis,” in Jonathan A. Parker and Michael Woodford, eds., NBER Macroeconomics Annual 2014, vol. 29 (Chicago, IL: University of Chicago Press), pp. 71–128.
16 For more information on the history of Social Security disability insurance programs, see A history of the Social Security disability programs (Social Security Administration, January 1986), https://www.ssa.gov/history/1986dibhistory.html.
17 The total number of disabled worker beneficiaries rose from 2.9 million (or 1.7 percent of the working-age population) in 1980 to 9.0 million (or 3.6 percent) in 2014. For an overview of the expansion of the Social Security disability insurance program, see David H. Autor, The unsustainable rise of the disability rolls in the United States: causes, consequences, and policy options, Working Paper no. 17697 (Cambridge, MA: National Bureau of Economic Research, December 2011), http://www.nber.org/papers/w17697.
18 The number of women 25–54 years who received Social Security disability insurance benefits increased from 1.2 million (or 2.0 percent of women in this age group) in 2000 to 1.9 million (or 3.0 percent) in 2014. See Office of Research, Evaluation, and Statistics, Annual statistical report on the Social Security disability program, 2000 (Social Security Administration, September 2001) and Annual statistical report on the Social Security Disability Program, 2014 (Social Security Administration, November 2015), https://www.ssa.gov/policy/docs/statcomps/di_asr/index.html.
19 From 2004 to 2014, there were increases in the percentages of men and women 25–54 years who were not in the labor force and who cited illness or disability as the main reason for not working. See Hipple, “People who are not in the labor force.”
20 See Courtney Coile, Mark Duggan, and Audrey Guo, “Veterans’ labor force participation: what role does the VA’s disability compensation program play?” American Economic Review, vol. 105, no. 5, May 2015, pp. 131–36.
21 For more information on the Current Population Survey veterans supplement, see the U.S. Bureau of Labor Statistics news release, https://www.bls.gov/news.release/pdf/vet.pdf.
22 In a recent study, Alicia H. Munnell suggests that the average age of retirement for women and men has leveled off in recent years; see The average retirement age—an update, Issue Brief no. 15–4 (Boston, MA: Center for Retirement Research, March 2015), pp. 1–6, http://crr.bc.edu/wp-content/uploads/2015/03/IB_15-4_508_rev.pdf.
23 Since the beginning of 2000, the normal retirement age for receiving Social Security benefits has gradually increased. Traditionally, retirement benefits are first available at age 62, with a reduction for each month that benefits are received before age 65, the age at which individuals are eligible for full Social Security benefits. The normal retirement age was raised as part of the 1983 Social Security reform legislation. The age rises gradually for individuals born in 1937 or later. Currently, the highest normal retirement age is 67 years, for those born in 1960 or later.
24 A recent study focused on the baby-boom generation and its impact on overall labor force participation. See Alicia H. Munnell, The impact of aging baby boomers on labor force participation, Issue Brief no. 14–4 (Boston, MA: Center for Retirement Research, February 2014), pp. 1–6, http://crr.bc.edu/briefs/the-impact-of-aging-baby-boomers-on-labor-force-participation/.
25 For more information on the reasons why women are working longer, see Claudia Goldin and Lawrence Katz, “Women working longer: facts and some explanations,” in Claudia Goldin and Lawrence Katz, eds., Women working longer (University of Chicago Press, forthcoming), http://papers.nber.org/books/gold-12.
26 See Michael V. Leonesio, Benjamin Bridges, Robert Gesumaria, and Linda Del Bene, “The increasing labor force participation of older workers and its effect on the income of the aged,” Social Security Bulletin, vol. 72, no. 1 (Office of Retirement and Disability Policy, 2012), pp. 59–77, https://www.ssa.gov/policy/docs/ssb/v72n1/v72n1p59.pdf.
27 For a discussion of the history and development of the Social Security program, see Patricia P. Martin and David A. Weaver, “Social Security: a program and policy history,” Social Security Bulletin, vol. 66, no. 1 (Office of Retirement Policy, Office of Policy, November 2005), https://www.ssa.gov/policy/docs/ssb/v66n1/v66n1p1.html. For an analysis of the impact of Social Security (and Medicare) changes on the labor market, see “Raising the ages of eligibility for Medicare and Social Security,” Issue Brief (Congressional Budget Office, January 2012), pp. 1–12, https://www.cbo.gov/publication/42683. For a discussion of changes to private pension plans and labor force participation of older adults, see Frank W. Heiland and Zhe Li, Changes in labor force participation of older Americans and their pension structures: a policy perspective, Working Paper no. 2012-18 (Center for Retirement Research at Boston College, August 2012), http://crr.bc.edu/working-papers/changes-in-labor-force-participation-of-older-americans-and-their-pension-structures-a-policy-perspective-2/. According to the National Center for Health Statistics, people 65 years in 1990 could expect to live another 17.2 years; life expectancy at 65 years increased to 17.6 years in 2000 and to 19.3 years in 2013, http://www.cdc.gov/nchs/ data/hus/hus14.pdf#016. In a recent study, researchers found evidence which suggests that older adults have substantial health capacity to work longer. See Courtney Coile, Kevin S. Milligan, and David A. Wise, “Health capacity to work at older ages: evidence from the U.S.,” Working Paper no. 21940 (Cambridge, MA: National Bureau of Economic Research, January 2016), http://www.nber.org/papers/w21940. Rising healthcare costs might explain some of the rise in labor force participation among older adults because some older adults might have to continue to work to pay out-of-pocket expenses for healthcare. Over the past two decades, the cost of medical care has increased sharply. Between 1995 and 2015, the Consumer Price Index for all urban customers (CPI- U) for medical care rose at an annual rate of 3.6 percent, compared with a 2.3-percent annual rate of increase of the CPI-U for all items. Over the same period, the index for prescription drugs increased at an annual rate of 3.6 percent. For a discussion of labor force participation and work patterns of older women by educational attainment, see Elizabeth T. Hill, “The labor force participation of older women: retired? working? both?” Monthly Labor Review, September 2002, pp. 39–48, https://www.bls.gov/opub/mlr/2002/09/art4full.pdf.