An official website of the United States government
An official website of the United States government
The .gov means it's official.
Federal government websites often end in .gov or .mil. Before sharing sensitive information,
make sure you're on a federal government site.
The site is secure.
The
https:// ensures that you are connecting to the official website and that any
information you provide is encrypted and transmitted securely.
Nonfarm businesses and government agencies added a combined 2.7 million jobs in 2015, after adding 3.0 million in 2014, according to data from the Current Employment Statistics (CES) survey.1 Over the year, service-providing industries led job growth, with the largest gains occurring in professional and business services, health care, and leisure and hospitality. Among goods-producing industries, construction accounted for most of the employment gains while mining lost jobs. (See table 1.)
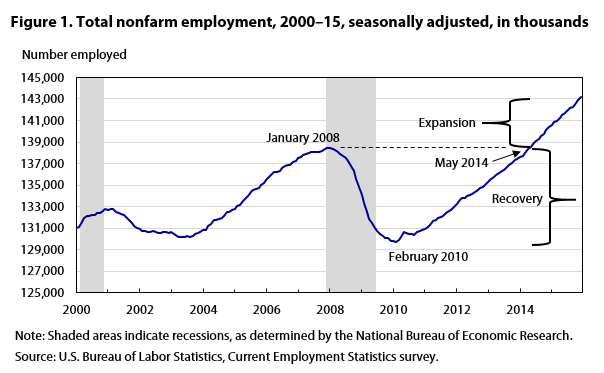
The U.S. economy has been adding payroll jobs since employment last reached a trough following the Great Recession.2 Net job losses totaled 8.7 million between January 2008 and February 2010. Employment then started to grow and, in May 2014, recovered to the level of the previous peak. After that, payroll employment expanded by an additional 4.6 million as of December 2015.3 (See figure 1.)
Employment trends across industries reflected the variations observed in major economic indicators. (See table 2.) In 2015, real gross domestic product increased by 2.4 percent, the same rate as in 2014. Real gross private domestic investment and industrial production grew more slowly, likely indicating employment weakness. The trade-weighted dollar rose about 4 times faster in 2015 than during the previous year, making U.S. goods more expensive to export and creating an incentive for importing foreign goods into the United States. Falling energy prices hurt employment in mining and related industries. Lower energy prices combined with relatively stagnant consumer prices to help boost both real personal income and consumer expenditures on goods and services. Home sales strengthened over the year, helping to lift employment in construction and related industries.
| Indicator | Over-the-year percent change | ||
|---|---|---|---|
| 2013 | 2014 | 2015 | |
Real gross domestic product(1) | 1.5 | 2.4 | 2.4 |
Personal consumption expenditures(2) | 3.1 | 4.2 | 3.4 |
Real gross private domestic investment(1) | 4.5 | 5.4 | 5.0 |
Real disposable personal income(1) | -1.4 | 2.7 | 3.4 |
Industrial Production Index(2) | 1.9 | 3.7 | 1.3 |
Trade-weighted U.S. dollar index (broad index)(1) | 1.2 | 3.1 | 12.6 |
Crude-oil prices: West Texas Intermediate (WTI), Cushing, Oklahoma(1) | 11.1 | -39.3 | -37.3 |
30-Year Fixed-Rate Mortgage Average in the United States ©(1) | 8.7 | 4.8 | -7.7 |
Existing Home Sales ©(1) | 9.2 | -2.9 | 6.3 |
New one-family houses sold in the United States(2) | 16.8 | 2.3 | 14.1 |
| Notes: (1) Annual, not seasonally adjusted. (2) Annual, seasonally adjusted. Sources: U.S. Bureau of Economic Analysis, Board of Governors of the Federal Reserve System, U.S. Energy Information Administration, Federal Home Loan Mortgage Corporation (Freddie Mac), National Association of Realtors, and U.S. Census Bureau. | |||
Private education and health services, professional and business services, leisure and hospitality, and construction contributed the largest numbers to job growth in 2015.
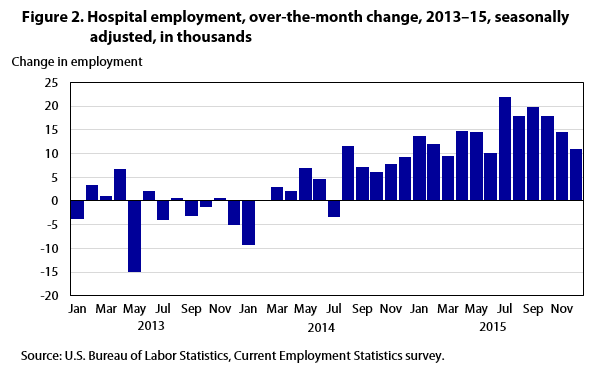
The private education and health services sector added 701,000 jobs over the year, accounting for 1 in 4 nonfarm jobs gained. Health care gained 472,000 jobs in 2015, and over-the-year employment growth in the industry accelerated to 3.2 percent, from 1.9 percent in the previous year. Ambulatory health care services and hospitals accounted for most of the job growth. Hospitals ranked among those industries with the most notable improvements in 2015, as employment in the industry rose by 177,000—nearly 4 times more than in 2014. (See figure 2.) Social assistance and private education added about the same number of jobs in 2015 as in 2014.
Job growth continued in professional and business services in 2015. Growth was strong across most industries in the sector, relative to the pace of job growth for all nonfarm industries combined. Still, slowing did occur in several industry components, compared with 2014 growth. In the professional and technical services component of the professional and business services industry, employment continued to rise in 2015 and job gains were widespread. Within professional and technical services, computer systems design and related services added the greatest number of jobs (104,000) over the year; however, this increase reflected a slight deceleration from the previous year’s growth. Computer systems design and related services, along with management and technical consulting services, have exhibited some of the most consistent job growth over the past several years.
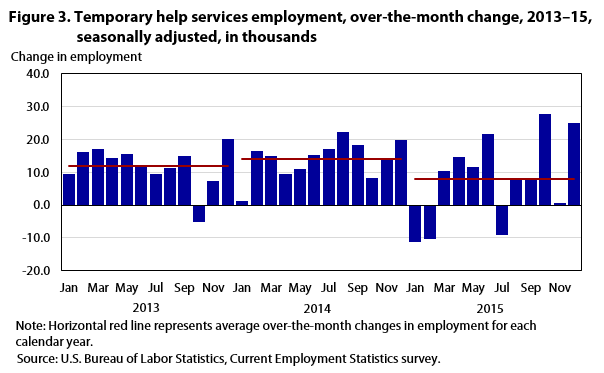
Elsewhere in professional and business services, employment growth slowed by 0.6 percentage point in administrative and waste services. Temporary help services, an industry that typically drives employment trends in two administrative industries—administrative and waste services, and administrative and support services—saw more volatile and slower job growth over the year: the industry added 96,000 jobs in 2015, compared with 168,000 in 2014. (See figure 3.) Even with the deceleration, employment growth in temporary help was still relatively stronger than total nonfarm employment growth.
Achieving a 3-percent increase in 2015, leisure and hospitality saw its employment continue to rise faster than total nonfarm employment. In fact, the change in leisure and hospitality employment has outperformed that in total nonfarm employment in percentage terms every year since 1998.
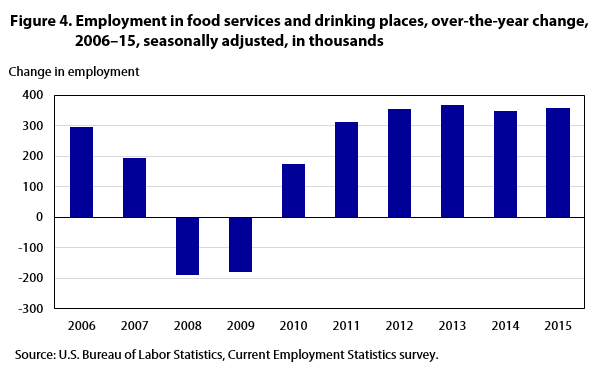
Within leisure and hospitality, food services and drinking places accounted for most of the job growth in 2015. The industry has achieved annual job gains of more than 300,000 in each of the past 5 years. (See figure 4.) Employment grew by 65,000 over the year in arts, entertainment, and recreation and was little changed in accommodation.
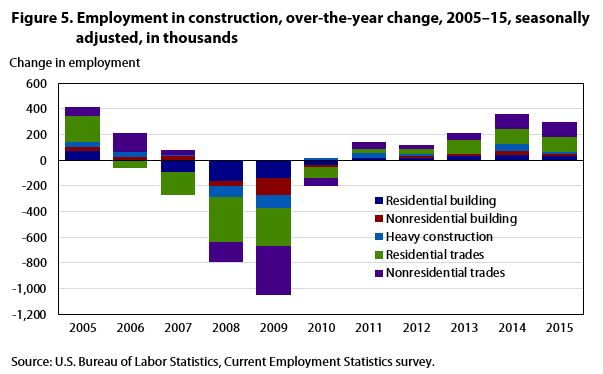
An industry still recovering from the last recession, construction added 296,000 jobs in 2015, accounting for almost all the overall employment gain in the goods-producing sector. Employment growth over the year, 4.7 percent, was relatively faster than that of all other major industry sectors, but still reflected a deceleration from the 2014 pace.
Employment rose by more than 100,000 each in residential and nonresidential specialty trade contractors in 2015, a gain similar to that achieved the previous year. Residential building also added jobs over the year, while employment changed little elsewhere in construction. (See figure 5.) The change in heavy and civil engineering construction reflected a deceleration from the previous year’s increase of 51,000.
With employment losses that started in residential industries more than a year and a half before the official start of the recession in December 2007, construction led the Great Recession in shedding jobs. The industry continued to lose jobs until January 2011. From peak to trough, employment in the industry declined by 2.3 million, or 29.8 percent. As 2015 came to a close, construction employment was still 1.1 million short of a full recovery.
Retail trade added 284,000 jobs in 2015, roughly keeping pace with total nonfarm growth. Employment in the industry reached an important milestone, recovering about 1.3 million jobs lost during the Great Recession. By December, retail employment had expanded by 185,000 above the last peak in November 2007.
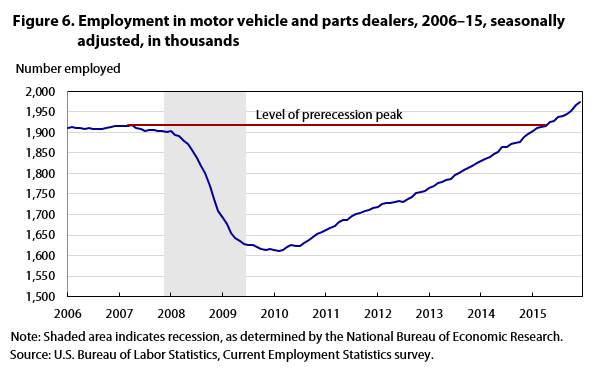
Within retail trade, motor vehicle and parts dealers added 79,000 jobs in 2015. Bolstered by strong auto sales, employment in the component, as in the larger sector, also reached the recovery milestone during the year (see figure 6): by December, employment had expanded by 57,000 beyond an April 2007 peak. Automobile dealers accounted for 72 percent of the gain in motor vehicle and parts dealers in 2015.
General merchandise stores added 53,000 jobs over the year. The increase was more than accounted for by the 71,000 jobs added by warehouse clubs and supercenters. The other components of general merchandise stores combined to lose jobs, with department stores shedding 30,000 jobs over the year, the fourth successive year of declining employment in that component. By contrast, the warehouse clubs and supercenters component has added jobs in each of the past 6 years.
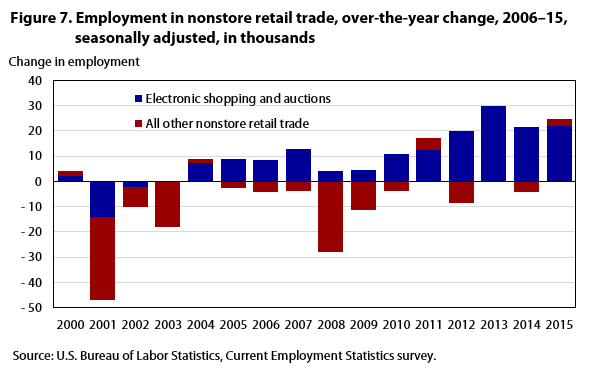
Employment in nonstore retailers expanded by 4.9 percent in 2015. Among the component industries, electronic shopping and auctions, the primary driver of employment trends in nonstore retailers, added 22,000 jobs over the year. (See figure 7.) This component has added jobs every year since 2004, increasing its share of nonstore retail employment from 14 percent that year to 41.1 percent in 2015.
Elsewhere in retail trade, electronics and appliance stores, building material and garden supply stores, and gasoline stations added jobs in 2015.
Employment in financial activities grew at roughly the same pace as overall employment (1.9 percent). Insurance carriers contributed the largest number of jobs, followed by real estate and security and commodity industries. Employment increases in nondepository credit intermediation and in activities related to credit intermediation more than offset losses in commercial banking over the year.
Although growth slowed to about half the pace set in 2014, employment continued to rise in transportation and warehousing. While couriers and messengers, truck transportation, and support activities for transportation added fewer jobs in 2015, employment in warehousing and storage accelerated and accounted for more than half of the jobs gained in the transportation and warehousing sector. Railroads lost jobs over the year, offsetting job gains in 2014.
After gaining 208,000 jobs in 2014, manufacturing employment saw little change in employment in 2015, adding just 26,000 jobs. Nondurable goods added 49,000 jobs, while employment in durable goods was down by 23,000 over the year.
The expansion in nondurable goods employment in 2015 was mostly in food manufacturing and miscellaneous nondurable goods manufacturing. The majority of the gains in food manufacturing occurred during the last few months of the year. Miscellaneous nondurable goods manufacturing, which includes the tobacco and beverages industry, increased payroll employment by 8.5 percent over the year.
Durable goods manufacturing industries exhibited disparate employment trends in 2015. Transportation equipment added 23,000 jobs, primarily on the strength of motor vehicle and parts dealers, an industry in which strong auto sales and lower fuel prices helped drive job growth.4 Likely driven by strength in construction, both wood products and nonmetallic mineral products (cement, glass, bricks, etc.) added jobs over the year as well.
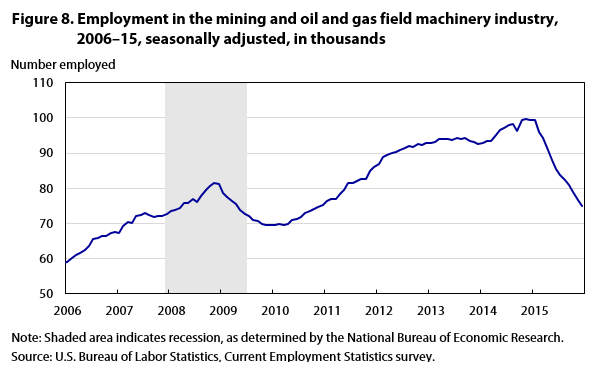
In contrast, machinery, fabricated metal products, and primary metals, industries that produce industrial supplies and materials, lost jobs over the year. Several factors may explain the weaknesses in these durable goods industries. A strong dollar made U.S. goods more expensive to foreign markets, and exports of goods decreased by $119.6 billion in 2015,5 largely for industrial supplies and materials. Furthermore, although low fuel prices helped spur job growth in motor vehicle and parts dealers, the same low prices likely also contributed to losses in machinery, primarily in the mining and oil and gas field machinery industry. Employment in this small component industry decreased by 24.7 percent over the year. (See figure 8.)
As in manufacturing, job growth in wholesale trade slowed. Of the industry’s components, nondurable goods exhibited faster employment growth in 2015 while durable goods and electronic markets and agents and brokers saw employment growth decelerate over the year.
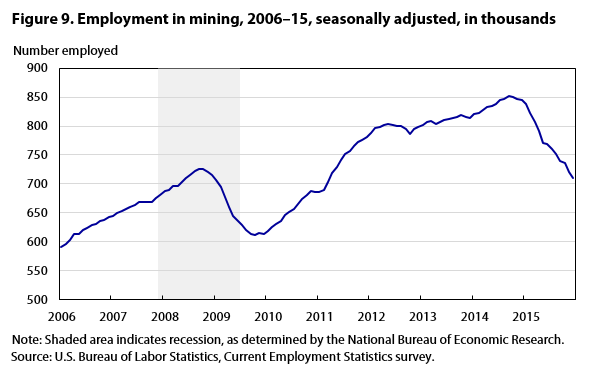
Job losses were particularly severe in mining during 2015. Employment decreased by 135,000, or 15.9 percent. (See figure 9.) All mining components suffered losses, but employment in support activities for mining registered the largest relative decrease—23.3 percent over the year—across all nonfarm industries. Employment in coal mining continued its long-run trend by shedding 9,000 jobs in 2015. The industry has lost 29,000 jobs since 2011.
Crude oil prices fluctuated between about $91 and $108 per barrel during the first half of 2014, but then started to fall, declining to $37 in December 2015.6 Mining activities related to oil and gas followed a similar trend: employment peaked in September 2014 and declined each month through December 2015. Support activities for mining, an industry that includes support activities for oil and gas operations, reduced payroll employment by 111,000, with most of the decrease (102,000) occurring in 2015. Oil and gas extraction lost 18,000 jobs in 2015.
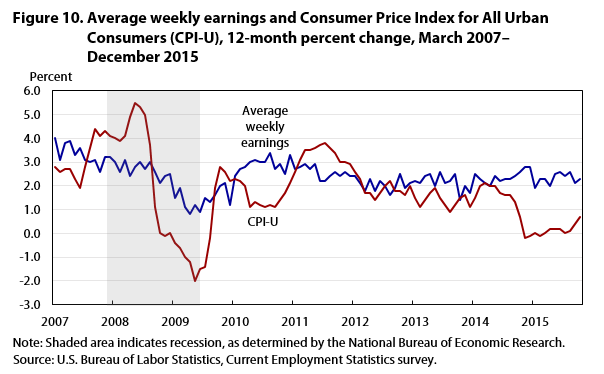
Average weekly hours of all private sector employees edged down by 0.1 hour in 2015, while employees earned 2.6 percent more per hour. As a result of these changes, average weekly earnings were up 2.3 percent over the year. (See figure 3.10.) With prices, as measured by the Consumer Price Index for all Urban Consumers (CPI-U), rising 0.7 percent on an annualized basis, real weekly earnings rose 1.7 percent in 2015, improving overall buying power for payroll workers.
Although the overall rate of job growth slowed in 2015, the employment gain represented a continuation of an expansion that started in May 2014, when employment recovered to its previous peak level of January 2008. Employment trends varied not only by industry, but also by where they stood relative to the last business cycle peak. Health care typically adds jobs even during recessions, making it the most recessionproof of industries with regard to employment. Employment in the industry expanded during both the Great Recession and the recovery period, with growth accelerating in 2015. Some industries lost jobs during the last recession, but recovered relatively early. Employment in leisure and hospitality and in professional and business services recovered as early as 2012 and continued to expand through 2015. Retail trade saw employment recover during 2015, while recovery continued in construction, financial activities, manufacturing, and government. Mining began a new cycle in 2014, with employment peaking in September of that year and then declining throughout 2015.
Joseph Stuart, Jr., "Employment continued to expand in 2015," Monthly Labor Review, U.S. Bureau of Labor Statistics, April 2016, https://doi.org/10.21916/mlr.2016.18
1 The Current Employment Statistics (CES) program, which provides detailed industry data on employment, hours, and earnings of workers on nonfarm payrolls, is a monthly survey of about 146,000 businesses and government agencies representing approximately 623,000 individual worksites. For more information on the program’s concepts and methodology, see “Technical notes for the Current Employment Statistics survey,” Current Employment Statistics—CES (national) (U.S. Bureau of Labor Statistics, February 8, 2016), https://www.bls.gov/web/empsit/cestn.htm. To access CES data, see Current Employment Statistics—CES (national) (U.S. Bureau of Labor Statistics), https://www.bls.gov/ces/. The CES data are seasonally adjusted unless otherwise noted. Over-the-year changes are calculated from December of the previous year through December of the reference year.
2 Recessions are identified by the National Bureau of Economic Research (NBER). According to NBER, the most recent recession began in December 2007 and ended in June 2009. The previous two recessions were from March 2001 to November 2001 and from July 1990 to March 1991. For a complete list of business cycle dates, see “U.S. business cycle expansions and contractions” (National Bureau of Economic research, April 1, 2016), http://www.nber.org/cycles/cyclesmain.html.
3 For CES program definitions of peaks, troughs, recovery, and expansion, see “CES peak–trough tables,” Current Employment Statistics—CES (national) (U.S. Bureau of Labor Statistics, December 10, 2012), https://www.bls.gov/ces/tables/peak-trough.htm.
4 See “U.S. car sales set record in 2015,” The Wall Street Journal, January 5, 2016, http://www.wsj.com/articles/u-s-car-sales-poised-for-their-best-month-ever-1451999939.
5 See “Time series/trend charts,” Business and industry (U.S. Census Bureau), https://www.census.gov/econ/currentdata/dbsearch?program=FTD&startYear=1992&endYear=2016& categories=BOPGS&dataType=EXP&geoLevel=US&adjusted=1&submit=GET+DATA&releaseScheduleId=.
6 U.S. Energy Information Administration, Crude oil prices: West Texas Intermediate (WTI)—Cushing, Oklahoma (Federal Reserve Bank of St. Louis), https://research.stlouisfed.org/fred2/series/DCOILWTICO.