An official website of the United States government
An official website of the United States government
The .gov means it's official.
Federal government websites often end in .gov or .mil. Before sharing sensitive information,
make sure you're on a federal government site.
The site is secure.
The
https:// ensures that you are connecting to the official website and that any
information you provide is encrypted and transmitted securely.
The U.S. labor market continued to improve gradually in 2013 as unemployment declined and employment expanded. In the fourth quarter of the year, 10.8 million people were unemployed and the unemployment rate was 7.0 percent, 0.8 percentage point lower than a year earlier. Total civilian employment expanded by 900,000 in 2013, reaching 144.2 million in the fourth quarter of the year. Employment growth, however, was weaker than in the prior 2 years.1 (For a comparison of the employment measures available from the Current Population Survey (CPS) and the Current Employment Statistics (CES) survey, see the box that follows.) The employment–population ratio showed little definitive change in 2013 on net, ending the year at 58.5 percent in the fourth quarter. In 2013, the civilian labor force—the sum of the employed and the unemployed—dropped to 154.9 million by the fourth quarter, and the labor force participation rate fell by 0.9 percentage point over the year, to 62.8 percent.
This article examines key labor market measures from the CPS in 2013 for various population groups. Among the characteristics covered are age, gender, race and ethnicity, and educational attainment. The article also explores changes in earnings and in the duration of unemployment and reviews the employment situations of veterans, people with a disability, and the foreign born.
Both the number of unemployed people and the unemployment rate for all the major demographic groups dropped in 2013. Over the year, the number of unemployed declined by 1.4 million to 10.8 million in the fourth quarter. The decline in unemployment picked up speed during the year, falling by 129,000 in the first quarter of the year, compared with declines of 316,000, 418,000, and 512,000 in each of the subsequent three quarters. The decline in the unemployment rate also picked up pace during the year, edging downward by 0.1 percentage point in the first quarter, compared with a 0.2 percentage-point decline in each of the second and third quarters and a 0.3 percentage-point decline in the fourth quarter. The rate was 7.0 percent in the fourth quarter of 2013, versus its year-earlier level of 7.8 percent. (See table 1 and figure 1.)
| Characteristic | Fourth quarter, 2012 | 2013 | Change, fourth quarter 2012 to fourth quarter 2013 | |||
|---|---|---|---|---|---|---|
| First quarter | Second quarter | Third quarter | Fourth quarter | |||
Total, 16 years and older | ||||||
Civilian labor force | 155,424 | 155,437 | 155,597 | 155,534 | 154,949 | –475 |
Participation rate (percent) | 63.7 | 63.5 | 63.4 | 63.2 | 62.8 | –.9 |
Employed | 143,271 | 143,414 | 143,890 | 144,245 | 144,171 | 900 |
Employment–population ratio | 58.7 | 58.6 | 58.6 | 58.6 | 58.5 | –.2 |
Unemployed | 12,152 | 12,023 | 11,707 | 11,289 | 10,777 | –1,375 |
Unemployment rate (percent) | 7.8 | 7.7 | 7.5 | 7.3 | 7.0 | –.8 |
Men, 20 years and older | ||||||
Civilian labor force | 79,634 | 79,871 | 79,863 | 79,746 | 79,477 | –157 |
Participation rate (percent) | 72.9 | 72.9 | 72.7 | 72.4 | 71.9 | –1.0 |
Employed | 73,885 | 74,152 | 74,188 | 74,156 | 74,216 | 331 |
Employment–population ratio | 67.7 | 67.7 | 67.5 | 67.3 | 67.2 | –.5 |
Unemployed | 5,750 | 5,719 | 5,675 | 5,590 | 5,261 | –489 |
Unemployment rate (percent) | 7.2 | 7.2 | 7.1 | 7.0 | 6.6 | –.6 |
Women, 20 years and older | ||||||
Civilian labor force | 69,956 | 69,739 | 69,912 | 70,000 | 69,785 | –171 |
Participation rate (percent) | 59.2 | 58.9 | 58.9 | 58.8 | 58.5 | –.7 |
Employed | 64,948 | 64,847 | 65,270 | 65,599 | 65,464 | 516 |
Employment–population ratio | 55.0 | 54.8 | 55.0 | 55.1 | 54.9 | –.1 |
Unemployed | 5,008 | 4,892 | 4,641 | 4,402 | 4,320 | –688 |
Unemployment rate (percent) | 7.2 | 7.0 | 6.6 | 6.3 | 6.2 | –1.0 |
Total, 16 to 19 years | ||||||
Civilian labor force | 5,834 | 5,827 | 5,822 | 5,788 | 5,687 | –147 |
Participation rate (percent) | 34.5 | 34.6 | 34.6 | 34.5 | 34.0 | –.5 |
Employed | 4,439 | 4,415 | 4,432 | 4,490 | 4,491 | 52 |
Employment–population ratio | 26.3 | 26.2 | 26.4 | 26.8 | 26.9 | .6 |
Unemployed | 1,394 | 1,412 | 1,390 | 1,298 | 1,196 | –198 |
Unemployment rate (percent) | 23.9 | 24.2 | 23.9 | 22.4 | 21.0 | –2.9 |
White | ||||||
Civilian labor force | 123,679 | 123,704 | 123,697 | 123,362 | 122,850 | –829 |
Participation rate (percent) | 63.8 | 63.8 | 63.7 | 63.4 | 63.1 | –.7 |
Employed | 115,169 | 115,224 | 115,488 | 115,458 | 115,346 | 177 |
Employment–population ratio | 59.4 | 59.4 | 59.5 | 59.4 | 59.2 | –.2 |
Unemployed | 8,510 | 8,480 | 8,208 | 7,904 | 7,504 | –1,006 |
Unemployment rate (percent) | 6.9 | 6.9 | 6.6 | 6.4 | 6.1 | –.8 |
Black or African American | ||||||
Civilian labor force | 18,535 | 18,595 | 18,643 | 18,599 | 18,475 | –60 |
Participation rate (percent) | 61.7 | 61.5 | 61.5 | 61.1 | 60.5 | –1.2 |
Employed | 15,972 | 16,066 | 16,149 | 16,214 | 16,179 | 207 |
Employment–population ratio | 53.1 | 53.2 | 53.3 | 53.3 | 53.0 | –.1 |
Unemployed | 2,563 | 2,528 | 2,495 | 2,385 | 2,296 | –267 |
Unemployment rate (percent) | 13.8 | 13.6 | 13.4 | 12.8 | 12.4 | –1.4 |
Asian(1) | ||||||
Civilian labor force | 8,331 | 8,518 | 8,562 | 8,630 | 8,626 | 295 |
Participation rate (percent) | 64.4 | 64.7 | 64.4 | 64.9 | 64.2 | –.2 |
Employed | 7,836 | 8,019 | 8,151 | 8,168 | 8,206 | 370 |
Employment–population ratio | 60.6 | 60.9 | 61.3 | 61.5 | 61.0 | .4 |
Unemployed | 496 | 499 | 410 | 462 | 420 | –76 |
Unemployment rate (percent) | 5.9 | 5.9 | 4.8 | 5.4 | 4.9 | –1.0 |
Hispanic or Latino ethnicity | ||||||
Civilian labor force | 24,547 | 24,504 | 24,735 | 24,916 | 24,923 | 376 |
Participation rate (percent) | 66.1 | 65.9 | 66.1 | 66.2 | 65.8 | –.3 |
Employed | 22,145 | 22,190 | 22,488 | 22,616 | 22,765 | 620 |
Employment–population ratio | 59.6 | 59.7 | 60.1 | 60.1 | 60.1 | .5 |
Unemployed | 2,403 | 2,315 | 2,247 | 2,300 | 2,158 | –245 |
Unemployment rate (percent) | 9.8 | 9.4 | 9.1 | 9.2 | 8.7 | –1.1 |
Notes: (1) Data for Asians are not seasonally adjusted. Note: Race and Hispanic ethnicity totals do not sum to overall total, 16 years and older, because data are not presented for all races and because people of Hispanic ethnicity may be of any race and are also included in the race groups. Updated population controls are introduced annually with the release of January data. Source: U.S. Bureau of Labor Statistics, Current Population Survey. | ||||||
A disproportionately large share of the decline in both the number of unemployed and the unemployment rate in 2013 occurred among adult women, whose jobless rate dropped by 1.0 percentage point to 6.2 percent in the fourth quarter, breaking a 2-year trend in which the over-the-year decline in unemployment had been more concentrated among men. By comparison, the rate for adult men declined by 0.6 percentage point to 6.6 percent in the fourth quarter. While the rate for men generally continued to be higher than that of women—a pattern that has been in place since the rates began to diverge in mid-2008—the gap widened over the year with the larger decline in women’s unemployment. Among teenagers 16 to 19 years of age, the jobless rate remained high in 2013 by historical standards, falling by 2.9 percentage points to 21.0 percent in the fourth quarter.
The CPS and the CES
The Bureau of Labor Statistics (BLS) produces two monthly employment series that are independently obtained: the estimate of total nonfarm jobs, derived from the Current Employment Statistics (CES) survey, also called the establishment or payroll survey; and the estimate of total civilian employment, based on the Current Population Survey (CPS), also called the household survey. The two surveys use different definitions of employment, as well as different survey and estimation methods. The CES survey is a survey of employers that provides a measure of the number of payroll jobs in nonfarm industries. The CPS is a survey of households that provides a measure of employed people ages 16 years and older in the civilian noninstitutional population. Employment estimates from the CPS give information about workers in both the agricultural and nonagricultural sectors and in all types of work arrangements: workers with wage and salary jobs (including employment in a private household), those who are self-employed, and those doing unpaid work for at least 15 hours a week in a business or farm operated by a family member. CES payroll employment estimates are restricted to nonagricultural wage and salary jobs and exclude private household workers. As a result, employment estimates from the CPS are higher than those from the CES survey. In the CPS, however, employed people are counted only once, regardless of whether they hold more than one job during the survey reference period. By contrast, because the CES survey counts the number of jobs rather than the number of people, each nonfarm job is counted once, even when the same person holds two or more jobs.
The reference periods for the surveys also differ. In the CPS, the reference period is generally the calendar week that includes the 12th day of the month. In the CES survey, employers report the number of workers on their payrolls for the pay period that includes the 12th of the month. Because pay periods vary in length among employers and may be longer than 1 week, the CES employment estimates can reflect longer reference periods.
For purposes of comparison, however, CPS employment estimates can be adjusted to make them more similar in definitional scope to CES employment figures. BLS routinely adjusts these estimates to evaluate how the two employment series are tracking. The long-term trends in the employment measures of the two surveys are quite comparable. Nonetheless, throughout the history of the surveys, periods have occurred when the short-term trends diverged or when growth in one series significantly outpaced growth in the other. For example, following the end of the 2001 recession, CPS employment began to trend upward while CES employment continued to decline for a number of months.
BLS publishes a monthly report with the latest trends and comparisons of employment as measured by the CES survey and the CPS. (See “Employment from the BLS household and payroll surveys: summary of recent trends” [Bureau of Labor Statistics], on the Internet at https://www.bls.gov/web/empsit/ces_cps_trends.pdf.) This report includes a summary of possible causes of differences in the surveys’ employment trends, as well as links to additional research on the topic.
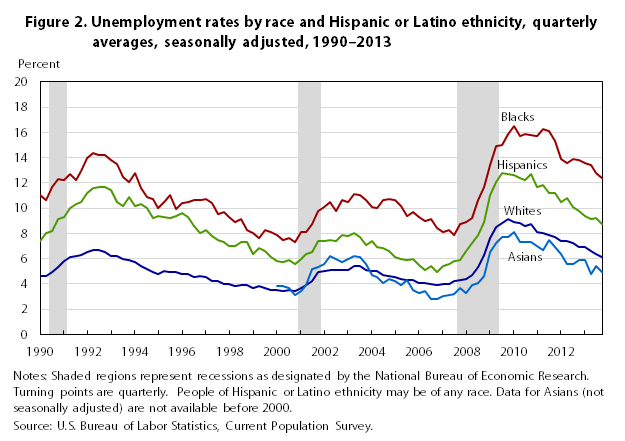
Unemployment rates for the major race and ethnicity groups declined in 2013.2 The unemployment rate for Blacks fell by 1.4 percentage points to 12.4 percent in the fourth quarter, yet their rate remained in double digits for the sixth consecutive year since their prerecession low of 8.1 percent in the first quarter of 2007.3 (See figure 2.) In comparison, the unemployment rates for Hispanics and Whites fell by 1.1 percentage points and 0.8 percentage point, respectively, to 8.7 percent and 6.1 percent in the fourth quarter. The unemployment rate for Asians (not seasonally adjusted) declined by 1.0 percentage point to 4.9 percent in the fourth quarter of the year.
The unemployment rate also declined for people across all levels of educational attainment in 2013. (See table 2 and figure 3.) Workers with less education continued to experience a substantially higher unemployment rate than did better educated members of the labor force. Among workers 25 years and older, the jobless rate of people with less than a high school diploma dropped by 1.5 percentage points to 10.4 percent in the fourth quarter, yet their rate remained in double digits for the sixth year in a row. The unemployment rate for high school graduates fell 1.0 percentage point over the year to 7.2 percent, while the rate for those with some college declined by 0.4 percentage point to 6.3 percent. The jobless rate for those with at least a bachelor’s degree fell 0.3 percentage point to 3.5 percent in the fourth quarter.
| Characteristic | Fourth quarter, 2012 | 2013 | Change, fourth quarter 2012 to fourth quarter 2013 | |||
|---|---|---|---|---|---|---|
| First quarter | Second quarter | Third quarter | Fourth quarter | |||
Less than a high school diploma | ||||||
Civilian labor force | 11,145 | 11,222 | 11,100 | 10,901 | 10,789 | –356 |
Participation rate (percent) | 45.3 | 46.2 | 44.6 | 45.1 | 44.2 | –1.1 |
Employed | 9,821 | 9,938 | 9,872 | 9,717 | 9,667 | –154 |
Employment–population ratio | 39.9 | 40.9 | 39.7 | 40.2 | 39.6 | –.3 |
Unemployed | 1,323 | 1,284 | 1,228 | 1,183 | 1,122 | –201 |
Unemployment rate (percent) | 11.9 | 11.4 | 11.1 | 10.9 | 10.4 | –1.5 |
High school graduate, no college | ||||||
Civilian labor force | 36,666 | 36,312 | 36,316 | 36,639 | 36,149 | –517 |
Participation rate (percent) | 59.4 | 58.5 | 59.0 | 59.0 | 58.2 | –1.2 |
Employed | 33,673 | 33,454 | 33,604 | 33,879 | 33,540 | –133 |
Employment–population ratio | 54.6 | 53.9 | 54.6 | 54.5 | 54.0 | –.6 |
Unemployed | 2,993 | 2,858 | 2,711 | 2,760 | 2,610 | –383 |
Unemployment rate (percent) | 8.2 | 7.9 | 7.5 | 7.5 | 7.2 | –1.0 |
Some college or associate’s degree | ||||||
Civilian labor force | 37,400 | 37,332 | 37,349 | 37,330 | 37,155 | –245 |
Participation rate (percent) | 68.6 | 68.3 | 68.3 | 67.1 | 67.3 | –1.3 |
Employed | 34,880 | 34,841 | 34,968 | 35,059 | 34,824 | –56 |
Employment–population ratio | 64.0 | 63.8 | 63.9 | 63.0 | 63.1 | –.9 |
Unemployed | 2,520 | 2,490 | 2,381 | 2,271 | 2,331 | –189 |
Unemployment rate (percent) | 6.7 | 6.7 | 6.4 | 6.1 | 6.3 | –.4 |
Bachelor’s degree and higher | ||||||
Civilian labor force | 48,834 | 49,185 | 49,417 | 49,141 | 49,673 | 839 |
Participation rate (percent) | 75.6 | 75.6 | 75.6 | 75.4 | 75.2 | –.4 |
Employed | 46,959 | 47,314 | 47,517 | 47,354 | 47,949 | 990 |
Employment–population ratio | 72.7 | 72.7 | 72.7 | 72.6 | 72.6 | –.1 |
Unemployed | 1,876 | 1,870 | 1,899 | 1,787 | 1,724 | –152 |
Unemployment rate (percent) | 3.8 | 3.8 | 3.8 | 3.6 | 3.5 | –.3 |
Note: Updated population controls are introduced annually with the release of January data. Source: U.S. Bureau of Labor Statistics, Current Population Survey. | ||||||
Jobless rates continued to decline in 2013 for all five of the major occupational categories. The rate continued to be lowest in the management, professional, and related occupational group, falling by 0.7 percentage point over the year to 3.1 percent in the fourth quarter. The jobless rate for sales and office occupations fell 0.3 percentage point to 6.8 percent, compared with a 1.1 percentage point decline in the rate for those in service occupations (7.8 percent). Unemployment rates continued to be higher in 2013 for those employed in production, transportation, and material moving occupations and in natural resources, construction, and maintenance occupations. The jobless rate for the production-related occupational group dropped by 0.7 percentage point to 8.4 percent, compared with a 1.8 percentage-point decline in the natural resources-related occupational group, to 9.0 percent.4 (See table 3.)
| Occupational group | Total | Men | Women | ||||||
|---|---|---|---|---|---|---|---|---|---|
| Fourth quarter, 2012 | Fourth quarter, 2013 | Change, fourth quarter 2012 to fourth quarter 2013 | Fourth quarter, 2012 | Fourth quarter, 2013 | Change, fourth quarter 2012 to fourth quarter 2013 | Fourth quarter, 2012 | Fourth quarter, 2013 | Change, fourth quarter 2012 to fourth quarter 2013 | |
Management, professional, and related occupations | 3.8 | 3.1 | –0.7 | 3.4 | 3.3 | –0.1 | 4.1 | 3.0 | –1.1 |
Management, business, and financial operations occupations | 3.8 | 3.3 | –.5 | 3.3 | 3.2 | –.1 | 4.4 | 3.5 | –.9 |
Professional and related occupations | 3.7 | 2.9 | –.8 | 3.5 | 3.3 | –.2 | 3.9 | 2.7 | –1.2 |
Service occupations | 8.9 | 7.8 | –1.1 | 8.8 | 7.9 | –.9 | 8.9 | 7.7 | –1.2 |
Healthcare support occupations | 6.2 | 6.7 | .5 | 5.2 | 10.5 | 5.3 | 6.3 | 6.3 | 0 |
Protective service occupations | 5.2 | 4.1 | –1.1 | 4.4 | 3.9 | –.5 | 7.9 | 4.9 | –3.0 |
Food preparation and serving related occupations | 10.2 | 8.4 | –1.8 | 10.2 | 8.7 | –1.5 | 10.2 | 8.2 | –2.0 |
Building and grounds cleaning and maintenance occupations | 11.4 | 9.5 | –1.9 | 11.0 | 9.6 | –1.4 | 12.1 | 9.4 | –2.7 |
Personal care and service occupations | 7.9 | 7.6 | –.3 | 8.3 | 7.4 | –.9 | 7.8 | 7.7 | –.1 |
Sales and office occupations | 7.1 | 6.8 | –.3 | 6.7 | 6.6 | –.1 | 7.4 | 6.9 | –.5 |
Sales and related occupations | 7.1 | 6.9 | –.2 | 5.8 | 5.5 | –.3 | 8.5 | 8.2 | –.3 |
Office and administrative support occupations | 7.1 | 6.7 | –.4 | 8.1 | 8.2 | .1 | 6.7 | 6.1 | –.6 |
Natural resources, construction, and maintenance occupations | 10.8 | 9.0 | –1.8 | 10.6 | 8.8 | –1.8 | 15.8 | 12.3 | –3.5 |
Farming, fishing, and forestry occupations | 14.8 | 12.7 | –2.1 | 12.0 | 11.1 | –.9 | 23.0 | 17.5 | –5.5 |
Construction and extraction occupations | 13.3 | 10.9 | –2.4 | 13.4 | 10.9 | –2.5 | 11.0 | 14.0 | 3.0 |
Installation, maintenance, and repair occupations | 6.0 | 5.2 | –.8 | 5.9 | 5.2 | –.7 | 10.3 | 5.4 | –4.9 |
Production, transportation, and material moving occupations | 9.1 | 8.4 | –.7 | 8.8 | 7.9 | –.9 | 10.2 | 10.1 | –.1 |
Production occupations | 8.6 | 7.8 | –.8 | 7.8 | 7.1 | –.7 | 10.7 | 9.7 | –1.0 |
Transportation and material moving occupations | 9.5 | 9.0 | –.5 | 9.6 | 8.6 | –1.0 | 9.2 | 10.9 | 1.7 |
Note: Updated population controls are introduced annually with the release of January data. Source: U.S. Bureau of Labor Statistics, Current Population Survey. | |||||||||
Despite some relief in 2013, the proportion of people unemployed for long periods remained high 4 1/2 years after the end of the 2007–2009 recession. The number of long-term unemployed (those who were jobless for 27 weeks or longer) fell by 863,000 over the year, to 4 million.5 This group made up 37 percent of the unemployed in the fourth quarter of 2013, down from 40 percent in the fourth quarter of 2012. (See table 4 and figure 4.)
| Reason and duration | Fourth quarter, 2012 | 2013 | Change, fourth quarter 2012 to fourth quarter 2013 | |||
|---|---|---|---|---|---|---|
| First quarter | Second quarter | Third quarter | Fourth quarter | |||
Reason for unemployment | ||||||
Job losers and people who completed temporary jobs | 6,473 | 6,497 | 6,183 | 5,861 | 5,753 | –720 |
On temporary layoff | 1,084 | 1,124 | 1,118 | 1,116 | 1,210 | 126 |
Not on temporary layoff | 5,390 | 5,373 | 5,065 | 4,745 | 4,543 | –847 |
Permanent job losers | 4,162 | 4,090 | 3,803 | 3,586 | 3,381 | –781 |
People who completed temporary jobs | 1,228 | 1,283 | 1,262 | 1,160 | 1,161 | –67 |
Job leavers | 982 | 971 | 945 | 948 | 865 | –117 |
Reentrants | 3,424 | 3,344 | 3,232 | 3,172 | 3,068 | –356 |
New entrants | 1,317 | 1,285 | 1,258 | 1,251 | 1,196 | –121 |
Percent distribution: | ||||||
Job losers and people who completed temporary jobs | 53.1 | 53.7 | 53.2 | 52.2 | 52.9 | –.2 |
On temporary layoff | 8.9 | 9.3 | 9.6 | 9.9 | 11.1 | 2.2 |
Not on temporary layoff | 44.2 | 44.4 | 43.6 | 42.2 | 41.7 | –2.5 |
Job leavers | 8.1 | 8.0 | 8.1 | 8.4 | 7.9 | –.2 |
Reentrants | 28.1 | 27.6 | 27.8 | 28.2 | 28.2 | .1 |
New entrants | 10.8 | 10.6 | 10.8 | 11.1 | 11.0 | .2 |
Duration of unemployment | ||||||
Less than 5 weeks | 2,648 | 2,642 | 2,620 | 2,549 | 2,496 | –152 |
5 to 14 weeks | 2,834 | 2,903 | 2,778 | 2,750 | 2,576 | –258 |
15 weeks or longer | 6,664 | 6,471 | 6,278 | 5,977 | 5,713 | –951 |
15 to 26 weeks | 1,811 | 1,794 | 1,932 | 1,764 | 1,723 | –88 |
27 weeks or longer | 4,853 | 4,677 | 4,346 | 4,213 | 3,990 | –863 |
Average (mean) duration in weeks | 39.2 | 36.4 | 36.4 | 36.8 | 36.7 | –2.5 |
Median duration, in weeks | 18.8 | 17.2 | 16.8 | 16.2 | 16.9 | –1.9 |
Percent distribution: | ||||||
Less than 5 weeks | 21.8 | 22.0 | 22.4 | 22.6 | 23.1 | 1.3 |
5 to 14 weeks | 23.3 | 24.2 | 23.8 | 24.4 | 23.9 | .6 |
15 weeks or longer | 54.9 | 53.9 | 53.8 | 53.0 | 53.0 | –1.9 |
15 to 26 weeks | 14.9 | 14.9 | 16.5 | 15.6 | 16.0 | 1.1 |
27 weeks or longer | 40.0 | 38.9 | 37.2 | 37.4 | 37.0 | –3.0 |
Note: Updated population controls are introduced annually with the release of January data. Source: U.S. Bureau of Labor Statistics, Current Population Survey. | ||||||
The number of people unemployed for a year or longer declined by 703,000 (not seasonally adjusted) in 2013, to 2.7 million in the fourth quarter. Their share of the unemployed was 26.2 percent in the fourth quarter of 2013, down from 2012 but still very high by historical standards.6 The number of people who were jobless for 99 weeks or longer (1.3 million in the fourth quarter of 2013, not seasonally adjusted) declined by 380,000 over the year. Despite this decline, 1 in 8 unemployed people had been jobless for about 2 years or longer at the end of 2013.
The number of people unemployed because they lost their jobs fell for the fourth consecutive year. The number of unemployed job losers declined by 720,000 to 5.8 million in the fourth quarter. Job losers are divided into two categories: people on temporary layoff who expect to be recalled to their jobs and those not on temporary layoff. People in the latter category, who do not expect to be recalled, are further categorized as either permanent job losers or people who have completed temporary jobs. A decline in permanent job losers accounted for the decline in the total number of unemployed job losers in 2013. (See table 4 and figure 5.)
After remaining about unchanged for the prior 2 years, the number of unemployed reentrants to the labor force fell by 356,000 from the fourth quarter of 2012 to 3.1 million in the fourth quarter of 2013. (Reentrants are those who had been in the labor force previously, had spent time out of the labor force, and were actively seeking work once again). Reentrants accounted for more than one-quarter of the unemployed at the end of 2013. Both the number of unemployed job leavers (people who voluntarily left their jobs) and the number of new entrants to unemployment also declined in 2013, following little movement in the prior year.
The decline in the level of joblessness in 2013 is also reflected in the labor force status flow data. These data capture the underlying changes in the labor force as people change their labor force status between being employed, unemployed, or not in the labor force. Each month, the Bureau of Labor Statistics (BLS) reports on the number of people employed, unemployed, and not in the labor force as measured by the CPS. A great deal of underlying movement, however, contributes to the relatively small over-the-month net changes that typically occur among these labor force statuses. These gross movements are captured by the labor force status flow data, which show that millions of people move between employment and unemployment each month, while millions of others leave or enter the labor force.7 In 2013, 17.0 million people, or 6.9 percent of the population, changed their labor force status in an average month.
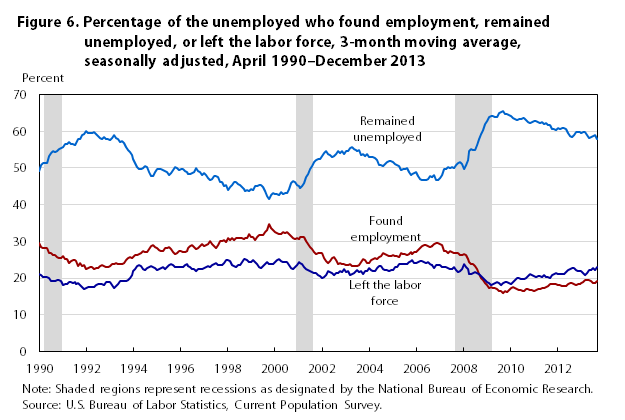
One can better understand the unemployment level in 2013 by examining the current status (employed, unemployed, or not in the labor force) of people who were unemployed in the previous month. Figure 6 shows the proportions of unemployed people who found employment, remained unemployed, or left the labor force over the month. Historically, these data indicate that people are more likely to remain unemployed from one month to the next than to either find employment or leave the labor force. As evident in the figure, this pattern became more pronounced during the 2007–2009 recession and has continued throughout the current recovery. The share of unemployed people who quit looking and left the labor force was 22.9 percent in December 2013 (calculated as a 3-month moving average), compared with 22.7 percent a year ago. The likelihood of unemployed people finding employment, at 19.2 percent in December, was up 0.9 percentage point over the year, while those who remained unemployed was down 1.1 percentage point. The likelihood of the unemployed finding a job, remaining unemployed, or leaving the labor force all showed movement toward their prerecession levels.
Employment rose in 2013, but the pace of growth was slower than that of the prior 2 years. As measured in the CPS, or household survey, civilian employment reached 144.2 million in the fourth quarter of 2013. The number of employed people rose by 900,000 in 2013, less than one-half of the employment gains added in each of the prior 2 years after population controls were considered.8 For the second consecutive year, adult women saw a larger gain in employment than adult men, accounting for about 60 percent of the over-the-year growth in employment in 2013. Employment among teenagers remained essentially unchanged for the fourth consecutive year. (See table 1.)
Employment growth in 2013 was concentrated among Hispanics. The number of employed Hispanics rose by 620,000 to 22.8 million in the fourth quarter of 2013.9 This over-the-year rise in employment among Hispanics made up more than half of the overall employment increase, much larger than their share of total employment (16 percent in the fourth quarter). Employment among Blacks rose by 207,000 over the year to 16.2 million, while the number of employed Whites changed little, at 115.3 million in the fourth quarter. The number of employed Asians also rose by 370,000 over the year, to 8.2 million in the fourth quarter (not seasonally adjusted).
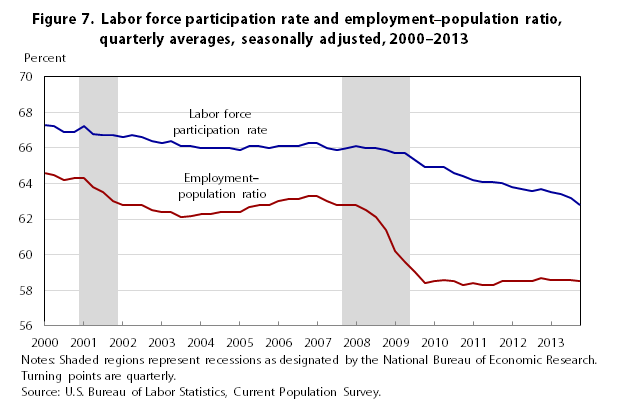
The employment–population ratio for all people ages 16 and older showed little change on net over the year. The employment–population ratio is the proportion of the civilian noninstitutional population 16 years and older that is employed. The ratio fell by 4.4 percentage points from 2007 to 2009 and has shown little definitive movement for the past 4 years. (See figure 7.) The employment–population ratio for adult men fell by 0.5 percentage point over the year, to 67.2 percent, while the ratio for adult women changed little, at 54.9 percent in the fourth quarter. (See table 1.) Although the gap between the ratios for men and women has narrowed significantly over the past four decades, the employment–population ratio for adult men was about 12 percentage points higher than that of adult women in 2013. The employment–population ratio among teenagers was little changed over the year, at 26.9 percent in the fourth quarter of 2013.
During 2013, the employment–population ratio for Hispanics edged up to 60.1 percent, while the ratios for Whites (59.2 percent), Blacks (53.0 percent), and Asians (61.0 percent, not seasonally adjusted) showed little change.
The number of workers holding more than one job, 6.9 million in the fourth quarter of 2013, has changed little over the past 2 years. The percentage of the employed that were multiple jobholders, however, edged down to 4.8 percent in the fourth quarter.
The total number of self-employed workers, including both those whose businesses were incorporated and those whose businesses were not, changed little in 2013. In the fourth quarter of 2013, 14.6 million (not seasonally adjusted) were self-employed. The self-employment rate—the proportion of total employment made up of the self-employed—edged down from the prior year, at 10.1 percent in the fourth quarter. Of all self-employed people, 9.3 million, or nearly two-thirds, had unincorporated businesses, while the remaining 5.4 million had incorporated businesses.
The number of people employed part time for economic reasons declined slightly in 2013. Also referred to as involuntary part-time employment, this measure of underemployment ended the fourth quarter 271,000 lower than its year-earlier level.10 Even with the decline in 2013, the number of people employed part time for economic reasons remained quite high by historical standards. Slack work or unfavorable business conditions, rather than an inability to find full-time work, typically has been the primary reason for working part time involuntarily. The inability to find full-time work has trended up since the end of the most recent downturn in June 2009, while working part-time because of slack work has declined. (See figure 8.)
Employment in service occupations rose over the year, accounting for about two of three workers who found employment in 2013. Nearly 1 in 5 employed people were classified in this broad occupational group in the fourth quarter of the year. By comparison, 38 percent of employed people were in management, professional, and related occupations; 23 percent were in sales and office occupations; 12 percent were in production, transportation, and material moving occupations; and another 9 percent were employed in natural resources, construction, and maintenance occupations. Employment in these occupational groups showed little change over the year.
Women made up 57 percent of workers employed in service occupations in 2013 and comprised a similar share of the over-the-year employment growth in this occupational category. Similar shares of employed women and men were classified in the management, professional, and related occupational group. Employed men were overrepresented in natural resources, construction, and maintenance occupations and in production, transportation, and material moving jobs. In the fourth quarter of 2013, men accounted for virtually all the people employed in construction and extraction jobs, whereas women accounted for the vast majority of people employed in healthcare support jobs. (See table 5.)
| Occupational group | Total | Men | Women | |||
|---|---|---|---|---|---|---|
| Fourth quarter, 2013 | Percent distribution | Fourth quarter, 2013 | Percent distribution | Fourth quarter, 2013 | Percent distribution | |
Total, 16 years and over | 144,448 | 100.0 | 76,511 | 100.0 | 67,937 | 100.0 |
Management, professional, and related occupations | 55,206 | 38.2 | 26,629 | 34.8 | 28,577 | 42.1 |
Management, business, and financial operations occupations | 22,887 | 15.8 | 12,909 | 16.9 | 9,978 | 14.7 |
Professional and related occupations | 32,319 | 22.4 | 13,720 | 17.9 | 18,599 | 27.4 |
Service occupations | 25,777 | 17.8 | 11,180 | 14.6 | 14,597 | 21.5 |
Healthcare support occupations | 3,576 | 2.5 | 358 | .5 | 3,218 | 4.7 |
Protective service occupations | 3,082 | 2.1 | 2,458 | 3.2 | 624 | .9 |
Food preparation and serving related occupations | 8,140 | 5.6 | 3,690 | 4.8 | 4,450 | 6.6 |
Building and grounds cleaning and maintenance occupations | 5,713 | 4.0 | 3,448 | 4.5 | 2,265 | 3.3 |
Personal care and service occupations | 5,265 | 3.6 | 1,225 | 1.6 | 4,040 | 5.9 |
Sales and office occupations | 33,315 | 23.1 | 12,849 | 16.8 | 20,467 | 30.1 |
Sales and related occupations | 15,513 | 10.7 | 7,973 | 10.4 | 7,541 | 11.1 |
Office and administrative support occupations | 17,802 | 12.3 | 4,876 | 6.4 | 12,926 | 19.0 |
Natural resources, construction, and maintenance occupations | 13,025 | 9.0 | 12,357 | 16.2 | 668 | 1.0 |
Farming, fishing, and forestry occupations | 943 | .7 | 722 | .9 | 221 | .3 |
Construction and extraction occupations | 7,116 | 4.9 | 6,917 | 9.0 | 199 | .3 |
Installation, maintenance, and repair occupations | 4,966 | 3.4 | 4,718 | 6.2 | 248 | .4 |
Production, transportation, and material moving occupations | 17,124 | 11.9 | 13,496 | 17.6 | 3,628 | 5.3 |
Production occupations | 8,455 | 5.9 | 6,185 | 8.1 | 2,270 | 3.3 |
Transportation and material moving occupations | 8,669 | 6.0 | 7,310 | 9.6 | 1,358 | 2.0 |
Note: Data may not sum to totals because of rounding. Source: U.S. Bureau of Labor Statistics, Current Population Survey. | ||||||
The civilian labor force declined to 154.9 million in 2013, and the labor force participation rate fell by 0.9 percentage point to 62.8 percent. The labor force participation rate—the proportion of the civilian noninstitutional population 16 years and older that is in the labor force—has been trending downward since reaching a record high in early 2000. The rate of decline steepened during the recent recession and has continued to decline during this recovery. Research has suggested that weak labor market conditions are part of the reason for the decline, as are longer-term demographic factors, such as retiring baby boomers and the easing of growth in the labor force participation of adult women.11 The participation rate dropped by 0.9 percentage point in 2013, compared with a 0.3 percentage point decline in 2012. (See figure 7.)
The labor force participation rates for Blacks and Whites declined in 2013. Among Blacks, the participation rate fell by 1.2 percentage points to 60.5 percent in the fourth quarter of 2013. The rate for Whites declined to 63.1 percent, while the rate for Hispanics changed little, at 65.8 percent. The labor force participation rate for Asians (64.2 percent, not seasonally adjusted) also showed no statistically significant change over the year. (See table 1.)
As the following tabulation of seasonally adjusted data shows, labor force participation rates and over-the-year percentage-point changes also varied by age:
| Age (years) | Fourth quarter, 2012 | Fourth quarter, 2013 | Change |
| Total, 16 and older | 63.7 | 62.8 | –0.9 |
| 16 to 24 | 55.3 | 54.8 | –.5 |
| 16 to 19 | 34.5 | 34.0 | –.5 |
| 20 to 24 | 71.3 | 70.5 | –.8 |
| 25 to 54 | 81.4 | 80.8 | –.6 |
| 25 to 34 | 81.8 | 80.9 | –.9 |
| 35 to 44 | 82.4 | 82.0 | –.4 |
| 45 to 54 | 80.0 | 79.4 | –.6 |
| 55 and older | 40.7 | 40.0 | –.7 |
| 55 to 64 | 65.1 | 64.0 | –1.1 |
| 65 and older | 18.5 | 18.5 | 0 |
The participation rate for those 65 years and older, unchanged at 18.5 percent in the fourth quarter of 2013, has generally been trending up since a recent low (11.8 percent) in 1998. Sensitivity to the business cycle, longer life expectancy, and increased retirement needs have been identified as possible factors for the increased labor force participation among older workers.12 Conversely, the teen (16 to 19 years old) participation rate, little changed at 34.0 percent in the fourth quarter of 2013, has generally been trending down since the series high in 1979. The pace of decline has intensified during recent recessions. Increased school enrollment, poor labor market conditions, and increased job competition from both older workers and recent immigrants have been identified in economic literature as factors that have contributed to the long-term decline in teen labor force participation.13 Among the remaining age groups, participation rates trended downward in 2013.
The category “not in the labor force” consists of people who are neither employed nor unemployed. In the fourth quarter of 2013, 91.8 million people were not in the labor force, an increase of 2.8 million from last year (not seasonally adjusted). (See table 6.) All of the increase in those not in the labor force occurred among people who indicated in the survey that they did not want a job. This measure rose by 3.5 million from its level a year earlier to 86.1 million in the fourth quarter of 2013. Of those who were not in the labor force, about 40 percent were 65 years and older.
| Category | Fourth quarter, 2009 | Fourth quarter, 2010 | Fourth quarter, 2011 | Fourth quarter, 2012 | Fourth quarter, 2013 | Change, fourth quarter 2012 to fourth quarter 2013 |
|---|---|---|---|---|---|---|
Total not in the labor force | 83,450 | 85,210 | 86,717 | 88,957 | 91,774 | 2,817 |
People who do not currently want a job(1) | 77,724 | 79,239 | 80,621 | 82,567 | 86,090 | 3,523 |
People who currently want a job | 5,726 | 5,971 | 6,096 | 6,390 | 5,684 | –706 |
Marginally attached to the labor force(2) | 2,394 | 2,581 | 2,562 | 2,517 | 2,269 | –248 |
Discouraged workers(3) | 866 | 1,273 | 1,002 | 953 | 831 | –122 |
Other people marginally attached to the labor force(4) | 1,528 | 1,308 | 1,559 | 1,564 | 1,438 | –126 |
Notes: (1) Includes some people who are not asked if they want a job. (2) Refers to people who want a job, have searched for work during the prior 12 months, and were available to take a job during the reference week but had not looked for work in the past 4 weeks. (3) Includes those who did not actively look for work in the prior 4 weeks for reasons such as they thought that no work was available, that they could not find work, that they lacked schooling or training, that their employer would think they were too young or old, and that they would face other types of discrimination. (4) Includes those who did not actively look for work in the prior 4 weeks for reasons such as school or family responsibilities, ill health, and transportation problems, as well as a number for whom the reason for nonparticipation was not determined. Source: U.S. Bureau of Labor Statistics, Current Population Survey. | ||||||
The number of people not in the labor force who wanted a job but were not looking for one declined by 706,000 over the year, to 5.7 million in the fourth quarter, following 5 years of consecutive gains. The share of those not in the labor force made up of these individuals edged down over the year to 6.2 percent.15Among those in this group, some were not currently looking for work specifically because they felt that no jobs were available for them, that they could not find work, that they lacked schooling or training, that an employer would think that they were too young or too old, or that they might face other types of discrimination. This subset of the marginally attached is defined as “discouraged workers.” The number of discouraged workers was 831,000 in the fourth quarter of 2013, down by 122,000 from a year earlier.
The remaining 1.4 million people marginally attached to the labor force in the fourth quarter of 2013 were those who had not searched for work in the 4 weeks preceding the survey for reasons such as school attendance, family responsibilities, health-related issues, and transportation problems, as well as those whose reason for nonparticipation was not identified in the CPS. The number of these individuals also declined over the year.
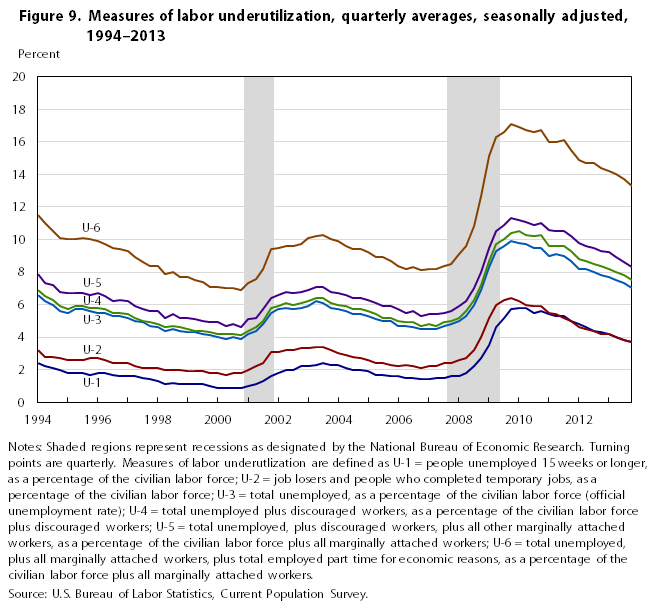
Mirroring the unemployment rate, all five alternative measures of labor underutilization declined in 2013. A number of alternative labor underutilization indicators are constructed from CPS data.16 Known as “U–1,” “U–2,” and “U–4 through U–6” (U–3 is the “official” unemployment rate), these measures tend to show similar cyclical patterns yet provide different perspectives on the degree to which labor resources are underutilized. Like the official unemployment rate, the alternative measures are presented as a percentage of the labor force (adjusted as necessary). U–1 shows the number of individuals unemployed 15 weeks or longer, while U–2 presents job losers and people who completed temporary jobs. U–4 through U–6 are broader than the official unemployment measure: to U–3, U–4 adds in discouraged workers, U–5 adds all people marginally attached to the labor force (including discouraged workers), and U–6 comprises the unemployed, all people marginally attached to the labor force, plus people employed part time for economic reasons.
All five alternative measures fell over the year. By the end of 2013, U–1 and U–2 had each declined by 0.6 percent point and 0.5 percentage point, respectively, to 3.7 percent. Throughout most of the series’ history, U–2 exceeded U–1. However, recently the pattern has changed, reflecting the persistently high levels of long-term unemployment and the declining number of people unemployed because they lost their jobs. In fact, these two measures were the same in 2013. Among the remaining three measures, U–4 had declined to 7.5 percent by the end of 2013, U–5 to 8.3 percent, and U–6 to 13.3 percent. (See figure 9.)
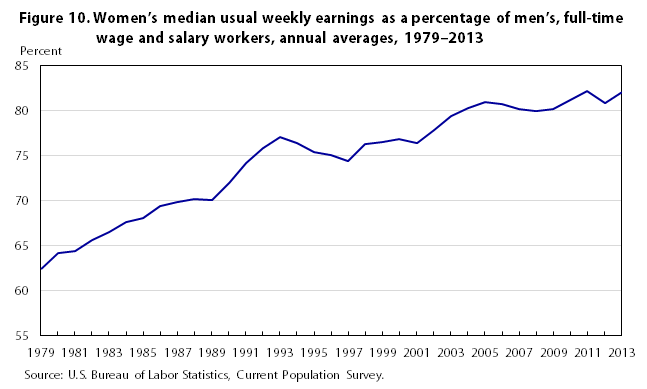
Median weekly earnings of full-time wage and salary workers edged up in 2013, not quite keeping pace with inflation as measured by the CPI-U (Consumer Price Index for All Urban Consumers). Median weekly earnings were $776 in 2013, up only slightly (1.0 percent) from $768 a year earlier.17 (The data in this section are annual averages.) During the same period, inflation increased by 1.5 percent. The year-to-year change in median weekly earnings was one of the smallest since the series began in 1979. (See table 7.)
| Characteristic | Current dollars | Constant (1982–1984) dollars | ||||
|---|---|---|---|---|---|---|
| 2012 | 2013 | Percent change, | 2012 | 2013 | Percent change, | |
Total, 16 years and older | $768 | $776 | 1.0 | $335 | $333 | –0.6 |
Men | 854 | 860 | .7 | 372 | 369 | –.8 |
Women | 691 | 706 | 2.2 | 301 | 303 | .7 |
White | 792 | 802 | 1.3 | 345 | 344 | –.3 |
Men | 879 | 884 | .6 | 383 | 380 | –.8 |
Women | 710 | 722 | 1.7 | 309 | 310 | .3 |
Black or African American | 621 | 629 | 1.2 | 271 | 270 | –.4 |
Men | 665 | 664 | –.2 | 289 | 285 | –1.4 |
Women | 599 | 606 | 1.2 | 261 | 260 | –.4 |
Asian | 920 | 942 | 2.4 | 401 | 404 | .7 |
Men | 1,055 | 1,059 | .4 | 459 | 455 | –.9 |
Women | 770 | 819 | 6.4 | 335 | 352 | 5.1 |
Hispanic or Latino ethnicity | 568 | 578 | 1.8 | 247 | 248 | .4 |
Men | 592 | 594 | .3 | 258 | 255 | –1.0 |
Women | 521 | 541 | 3.8 | 227 | 232 | 2.2 |
Total, 25 years and older | 815 | 827 | 1.5 | 350 | 355 | 1.5 |
Less than a high school diploma | 471 | 472 | .2 | 202 | 203 | .2 |
High school graduate, no college | 652 | 651 | –.2 | 280 | 279 | –.2 |
Some college or associate’s degree | 749 | 748 | –.1 | 322 | 321 | –.1 |
Bachelor’s degree or higher | 1,165 | 1,194 | 2.5 | 500 | 513 | 2.5 |
Source: U.S. Bureau of Labor Statistics, Current Population Survey and Consumer Price Index. | ||||||
While median weekly earnings for women grew by 2.2 percent in 2013, men’s earnings were little changed. The women’s-to-men’s earnings ratio edged up by 1.2 percentage points to 82.1 percent in 2013, following a decline in 2012. The ratio has been in the 81-percent to 82-percent range since 2010. Over time, however, the earnings differences between women and men have narrowed considerably. In 1979, the first year for which comparable data on usual weekly earnings are available, women’s earnings were 62.3 percent of men’s earnings. (See figure 10.)
Among full-time wage and salary workers in the major race and ethnicity groups, median usual weekly earnings continued to be higher for Asians ($942) and Whites ($802) than for Blacks ($629) and Hispanics ($578). (See table 7.)
Educational attainment is a major determinant of earnings. Among workers 25 years and older, those with at least a bachelor’s degree continued to have the highest median weekly earnings, $1,194 in 2013. Workers with some college or an associate’s degree earned $748, and high school graduates with no college education earned $651. Earnings for those with less than a high school diploma, $472, remained the lowest among the major education groups. Of all education groups, workers with at least a bachelor’s degree were the only one to experience an over-the-year increase in median weekly earnings, up $29 or 2.5 percent, in 2013. Earnings for all other major educational attainment groups showed little movement over the year.
In 2013, the unemployment rate for veterans changed little, while the rate for nonveterans continued to decline. In the CPS, veterans are defined as men and women who have previously served on active duty in the U.S. Armed Forces and were civilians at the time of the survey.18 In the fourth quarter of the year, 21.3 million men and women in the civilian noninstitutional population age 18 years and older were veterans. Veterans are more likely than nonveterans to be men and older. In part, this disparity reflects the characteristics of veterans who served during World War II, the Korean War, and the Vietnam era. Veterans who served during these wars comprised close to one-half of the veteran population. In the fourth quarter of 2013, 3.1 million veterans served during Gulf War–era I (August 1990 to August 2001), and an additional 3.0 million served during Gulf War–era II (September 2001 to present). Veterans who did not serve during designated wartime periods made up another 5.5 million. (See table 8.)
| Employment status, veteran status, and period of service | Total | Men | Women | ||||||
|---|---|---|---|---|---|---|---|---|---|
| Fourth quarter, 2012 | Fourth quarter, 2013 | Change, fourth quarter 2012 to fourth quarter 2013 | Fourth quarter, 2012 | Fourth quarter, 2013 | Change, fourth quarter 2012 to fourth quarter 2013 | Fourth quarter, 2012 | Fourth quarter, 2013 | Change, fourth quarter 2012 to fourth quarter 2013 | |
Veterans, 18 years and older | |||||||||
Civilian labor force | 10,892 | 10,847 | –45 | 9,771 | 9,417 | –354 | 1,120 | 1,430 | 310 |
Participation rate (percent) | 51.7 | 51.0 | –.7 | 50.8 | 49.4 | –1.4 | 61.5 | 64.0 | 2.5 |
Employed | 10,169 | 10,159 | –10 | 9,153 | 8,819 | –334 | 1,016 | 1,341 | 325 |
Employment–population ratio | 48.3 | 47.7 | –.6 | 47.6 | 46.3 | –1.3 | 55.8 | 60.0 | 4.2 |
Unemployed | 722 | 688 | –34 | 618 | 598 | –20 | 104 | 90 | –14 |
Unemployment rate (percent) | 6.6 | 6.3 | –.3 | 6.3 | 6.4 | .1 | 9.3 | 6.3 | –3.0 |
Gulf War–era II veterans | |||||||||
Civilian labor force | 2,101 | 2,441 | 340 | 1,804 | 1,963 | 159 | 296 | 478 | 182 |
Participation rate (percent) | 82.6 | 82.0 | –.6 | 84.8 | 84.1 | –.7 | 71.1 | 74.6 | 3.5 |
Employed | 1,885 | 2,219 | 334 | 1,633 | 1,779 | 146 | 253 | 440 | 187 |
Employment–population ratio | 74.1 | 74.6 | .5 | 76.7 | 76.2 | –.5 | 60.7 | 68.7 | 8.0 |
Unemployed | 215 | 222 | 7 | 172 | 184 | 12 | 43 | 38 | –5 |
Unemployment rate (percent) | 10.2 | 9.1 | –1.1 | 9.5 | 9.4 | –.1 | 14.7 | 7.9 | –6.8 |
Gulf War–era I veterans | |||||||||
Civilian labor force | 2,539 | 2,628 | 89 | 2,177 | 2,218 | 41 | 362 | 410 | 48 |
Participation rate (percent) | 83.4 | 84.5 | 1.1 | 85.4 | 86.6 | 1.2 | 73.2 | 74.8 | 1.6 |
Employed | 2,404 | 2,472 | 68 | 2,072 | 2,085 | 13 | 332 | 388 | 56 |
Employment–population ratio | 79.0 | 79.5 | .5 | 81.3 | 81.4 | .1 | 67.1 | 70.7 | 3.6 |
Unemployed | 136 | 156 | 20 | 105 | 133 | 28 | 30 | 23 | –7 |
Unemployment rate (percent) | 5.3 | 5.9 | .6 | 4.8 | 6.0 | 1.2 | 8.4 | 5.5 | –2.9 |
World War II, Korean War, and Vietnam–era veterans | |||||||||
Civilian labor force | 2,983 | 2,749 | –234 | 2,895 | 2,663 | –232 | 88 | 86 | –2 |
Participation rate (percent) | 30.7 | 28.4 | –2.3 | 30.8 | 28.5 | –2.3 | 27.8 | 23.8 | –4.0 |
Employed | 2,810 | 2,591 | –219 | 2,729 | 2,510 | –219 | 81 | 81 | 0 |
Employment–population ratio | 28.9 | 26.7 | –2.2 | 29.0 | 26.9 | –2.1 | 25.6 | 22.5 | –3.1 |
Unemployed | 173 | 158 | –15 | 166 | 153 | –13 | 7 | 5 | –2 |
Unemployment rate (percent) | 5.8 | 5.7 | –.1 | 5.7 | 5.7 | 0 | 7.9 | 5.8 | –2.1 |
Veterans of other service periods | |||||||||
Civilian labor force | 3,269 | 3,029 | –240 | 2,894 | 2,574 | –320 | 374 | 456 | 82 |
Participation rate (percent) | 56.9 | 55.1 | –1.8 | 56.2 | 53.4 | –2.8 | 63.1 | 66.6 | 3.5 |
Employed | 3,070 | 2,877 | –193 | 2,720 | 2,445 | –275 | 350 | 432 | 82 |
Employment–population ratio | 53.4 | 52.3 | –1.1 | 52.8 | 50.8 | –2.0 | 59.1 | 63.1 | 4 |
Unemployed | 198 | 152 | –46 | 175 | 129 | –46 | 24 | 24 | 0 |
Unemployment rate (percent) | 6.1 | 5.0 | –1.1 | 6.0 | 5.0 | –1.0 | 6.4 | 5.3 | –1.1 |
Nonveterans, 18 years and older | |||||||||
Civilian labor force | 142,503 | 142,040 | –463 | 71,752 | 71,896 | 144 | 70,751 | 70,144 | –607 |
Participation rate (percent) | 66.6 | 65.7 | –0.9 | 76.4 | 75.3 | –1.1 | 58.9 | 58.0 | –.9 |
Employed | 132,016 | 132,792 | 776 | 66,320 | 66,992 | 672 | 65,697 | 65,800 | 103 |
Employment–population ratio | 61.7 | 61.4 | –.3 | 70.6 | 70.2 | –.4 | 54.7 | 54.5 | –.2 |
Unemployed | 10,487 | 9,247 | –1,240 | 5,432 | 4,904 | –528 | 5,055 | 4,344 | –711 |
Unemployment rate (percent) | 7.4 | 6.5 | –.9 | 7.6 | 6.8 | –.8 | 7.1 | 6.2 | –.9 |
Notes: Veterans served on active duty in the U.S. Armed Forces and were not on active duty at the time of the survey. Nonveterans never served on active duty in the U.S. Armed Forces. Veterans could have served anywhere in the world during these periods of service: Gulf War–era II (September 2001–present), Gulf War–era I (August 1990–August 2001), Vietnam era (August 1964–April 1975), Korean War (July 1950–January 1955), World War II (December 1941–December 1946), and other service periods (all other periods). Veterans who served in more than one wartime period are classified as being only in the most recent one. Veterans who served during one of the selected wartime periods and another period are classified only in the wartime period. Updated population controls are introduced annually with the release of January data. Source: U.S. Bureau of Labor Statistics, Current Population Survey. | |||||||||
The jobless rate for female veterans fell 3.0 percentage points (not seasonally adjusted) to 6.3 percent in the fourth quarter of 2013. The rate for male veterans was 6.4 percent in the same quarter, little different from 1 year earlier.
Among Gulf War–era II veterans, the unemployment rate was 9.1 percent in the fourth quarter, higher than the overall rate for veterans. This disparity partially reflects the fact that Gulf War–era II veterans tend to be younger than those from other periods of service, and younger workers, regardless of their veteran status, usually have higher jobless rates than those who are older. The rate for female Gulf War–era II veterans fell by 6.8 percentage points over the year to 7.9 percent in the fourth quarter of 2013. The rate for male Gulf War–era II veterans (9.4 percent) was about unchanged from the prior year.
The labor force participation rate for people with a disability declined over the year, while their jobless rate was unchanged. The labor force participation rate for people with a disability decreased 1.5 percentage points to 19.4 percent in the fourth quarter of 2013. The rate for those without a disability also declined but remained more than three times higher, at 68.5 percent. (See table 9.) The low labor force participation rate among people with a disability is partly because a large proportion of this group is 65 years and older, an age group that, in general, has a lower rate of labor force participation. However, both men and women 16 to 64 years old with a disability also were much less likely to be in the labor force than were their counterparts with no disability. Among men with a disability ages 16 to 64, the participation rate declined over the year by 2.9 percentage points to 32.1 percent; the rate for women changed little (28.7 percent).
| Employment status, gender, and age | People with a disability | People with no disability | ||||
|---|---|---|---|---|---|---|
| Fourth quarter, 2012 | Fourth quarter, 2013 | Change, fourth quarter 2012 to fourth quarter 2013 | Fourth quarter, 2012 | Fourth quarter, 2013 | Change, fourth quarter 2012 to fourth quarter 2013 | |
Total, 16 years and older | ||||||
Civilian labor force | 6,010 | 5,553 | –457 | 149,202 | 149,238 | 36 |
Participation rate (percent) | 20.9 | 19.4 | –1.5 | 69.3 | 68.5 | –.8 |
Employed | 5,263 | 4,866 | –397 | 138,286 | 139,581 | 1,295 |
Employment–population ratio | 18.3 | 17.0 | –1.3 | 64.2 | 64.0 | –.2 |
Unemployed | 748 | 686 | –62 | 10,916 | 9,657 | –1,259 |
Unemployment rate (percent) | 12.4 | 12.4 | 0 | 7.3 | 6.5 | –.8 |
Men, 16 to 64 years | ||||||
Civilian labor force | 2,724 | 2,413 | –311 | 75,227 | 75,296 | 69 |
Participation rate (percent) | 35.0 | 32.1 | –2.9 | 82.4 | 81.8 | –.6 |
Employed | 2,337 | 2,062 | –275 | 69,577 | 70,171 | 594 |
Employment–population ratio | 30.0 | 27.5 | –2.5 | 76.2 | 76.3 | .1 |
Unemployed | 388 | 351 | –37 | 5,650 | 5,124 | –526 |
Unemployment rate (percent) | 14.2 | 14.6 | .4 | 7.5 | 6.8 | –.7 |
Women, 16 to 64 years | ||||||
Civilian labor force | 2,242 | 2,250 | 8 | 67,128 | 66,685 | –443 |
Participation rate (percent) | 29.0 | 28.7 | –.3 | 70.8 | 70.1 | –.7 |
Employed | 1,962 | 1,963 | 1 | 62,238 | 62,511 | 273 |
Employment–population ratio | 25.4 | 25.0 | –.4 | 65.6 | 65.7 | .1 |
Unemployed | 280 | 287 | 7 | 4,890 | 4,174 | –716 |
Unemployment rate (percent) | 12.5 | 12.8 | .3 | 7.3 | 6.3 | –1.0 |
Total, 65 years and over | ||||||
Civilian labor force | 1,044 | 889 | –155 | 6,847 | 7,258 | 411 |
Participation rate (percent) | 7.9 | 6.7 | –1.2 | 23.3 | 23.6 | .3 |
Employed | 964 | 841 | –123 | 6,471 | 6,899 | 428 |
Employment–population ratio | 7.3 | 6.4 | –.9 | 22.1 | 22.4 | .3 |
Unemployed | 80 | 48 | –32 | 376 | 358 | –18 |
Unemployment rate (percent) | 7.6 | 5.4 | –2.2 | 5.5 | 4.9 | –.6 |
Notes: A person with a disability has at least one of the following conditions: is deaf or has serious difficulty hearing; is blind or has serious difficulty seeing even when wearing glasses; has serious difficulty concentrating, remembering, or making decisions because of a physical, mental, or emotional condition; has serious difficulty walking or climbing stairs; has difficulty dressing or bathing; or has difficulty doing errands alone, such as visiting a doctor’s office or shopping because of a physical, mental, or emotional condition. Updated population controls are introduced annually with the release of January data. Source: U.S. Bureau of Labor Statistics, Current Population Survey. | ||||||
The unemployment rate for people with a disability was unchanged over the year, at 12.4 percent in the fourth quarter of 2013. Among workers with a disability, the unemployment rate for those 65 years and older declined by 2.2 percentage points to 5.4 percent in the fourth quarter, while the rates for men and women ages 16 to 64 changed little. By comparison, among those with no disability, the unemployment rates for men and women ages 16 to 64 and for workers 65 years and older declined over the year.
Both foreign-born and native-born individuals experienced a decline in their jobless rates in 2013. By the end of the year, the unemployment rate for the foreign born was 6.4 percent, while that for the native born was 6.7 percent. (See table 10.) The foreign born are people who reside in the United States but were born outside the country or outside one of its outlying areas, such as Puerto Rico or Guam, to parents who were not U.S. citizens. The foreign born comprise legally admitted immigrants; refugees; temporary residents, such as students and temporary workers; and undocumented immigrants.
| Employment status and nativity | Total | Men | Women | ||||||
|---|---|---|---|---|---|---|---|---|---|
| Fourth quarter, 2012 | Fourth quarter, 2013 | Change, fourth quarter 2012 to fourth quarter 2013 | Fourth quarter, 2012 | Fourth quarter, 2013 | Change, fourth quarter 2012 to fourth quarter 2013 | Fourth quarter, 2012 | Fourth quarter, 2013 | Change, fourth quarter 2012 to fourth quarter 2013 | |
Foreign-born, 16 years and older | |||||||||
Civilian labor force | 25,244 | 25,505 | 261 | 14,428 | 14,756 | 328 | 10,817 | 10,749 | –68 |
Participation rate (percent) | 66.2 | 65.9 | –.3 | 78.2 | 78.7 | .5 | 55.0 | 53.9 | –1.1 |
Employed | 23,292 | 23,874 | 582 | 13,423 | 13,868 | 445 | 9,869 | 10,006 | 137 |
Employment–population ratio | 61.1 | 61.7 | .6 | 72.7 | 74.0 | 1.3 | 50.2 | 50.2 | 0 |
Unemployed | 1,952 | 1,631 | –321 | 1,004 | 888 | –116 | 948 | 743 | –205 |
Unemployment rate (percent) | 7.7 | 6.4 | –1.3 | 7.0 | 6.0 | –1.0 | 8.8 | 6.9 | –1.9 |
Native-born, 16 years and older | |||||||||
Civilian labor force | 129,968 | 129,285 | –683 | 67,977 | 67,459 | –518 | 61,991 | 61,826 | –165 |
Participation rate (percent) | 63.1 | 62.2 | –.9 | 68.4 | 67.3 | –1.1 | 58.1 | 57.4 | –.7 |
Employed | 120,257 | 120,573 | 316 | 62,686 | 62,643 | –43 | 57,571 | 57,931 | 360 |
Employment–population ratio | 58.4 | 58.0 | –.4 | 63.1 | 62.5 | –.6 | 54.0 | 53.8 | –.2 |
Unemployed | 9,711 | 8,712 | –999 | 5,292 | 4,816 | –476 | 4,419 | 3,895 | –524 |
Unemployment rate (percent) | 7.5 | 6.7 | –.8 | 7.8 | 7.1 | –.7 | 7.1 | 6.3 | –.8 |
Notes: The foreign born are those residing in the United States who were not U.S. citizens at birth. That is, they were born outside the United States or one of its outlying areas, such as Puerto Rico or Guam, to parents who were not U.S. citizens. The native born are people who were born in the United States or one of its outlying areas, such as Puerto Rico or Guam or who were born abroad of at least one parent who was a U.S. citizen. Updated population controls are introduced annually with the release of January data. Source: U.S. Bureau of Labor Statistics, Current Population Survey. | |||||||||
The foreign born made up 16 percent of the U.S. civilian labor force in the fourth quarter of 2013. The labor force participation rate of the foreign born, at 65.9 percent in the fourth quarter, was little changed over the year, while that for the native born declined by 0.9 percentage point to 62.2 percent. Among the foreign born, the participation rate for men was up over the year (78.7 percent), while the rate for women declined to 53.9 percent. Foreign-born men continued to be more likely to participate in the labor force than native-born men in 2013, at 78.7 percent and 67.3 percent, respectively. By contrast, native-born women (57.4 percent) were more likely to be labor force participants than women who were foreign born (53.9 percent).
CPS DATA INDICATE continued gradual improvement in the U.S. labor market in 2013 in most major unemployment and employment measures. Both the number of unemployed and the unemployment rate fell over the year, with much of the improvement occurring among women. However, the proportion of the unemployed that was jobless for long periods continued to be high by historical standards. Employment, as measured by the CPS, expanded over the year, yet the pace of growth was notably slower than the increase in each of the prior 2 years. Among the employed, adult women saw a larger gain in employment than adult men for the second consecutive year, accounting for nearly three-fifths of the gains in 2013. In addition, the number of people employed part time for economic reasons declined in 2013 but remained at historically high levels. The labor force participation rate continued to decline over the year. The modest increase in median weekly earnings for full-time wage and salary workers did not keep pace with inflation and ranks among the smallest increase in earnings since the inception of the series more than three decades ago.
Catherine A. Wood, "Unemployment continued its downward trend in 2013," Monthly Labor Review, U.S. Bureau of Labor Statistics, April 2014, https://doi.org/10.21916/mlr.2014.11
1 The data in this article are based on information collected in the Current Population Survey (CPS)—also called the household survey—a monthly sample survey of about 60,000 households nationwide that the U.S. Census Bureau conducts for the U.S. Bureau of Labor Statistics (BLS). Although the CPS is a monthly survey, the data analyzed throughout the article are seasonally adjusted quarterly averages, unless otherwise noted. All over-the-year changes are comparisons of fourth-quarter data from 2012 with fourth-quarter data from 2013. Effective with the data for January 2013, updated population estimates were used in the household survey. Each year, the Census Bureau updates the population estimates to reflect new information and assumptions about the growth of the population during the decade. In accordance with usual practice, BLS did not revise the official household survey estimates for December 2012 and earlier months. For additional information on the population adjustments and their effect on national labor force estimates, see “Adjustments to Household Survey Population Estimates in January 2013” (U.S. Bureau of Labor Statistics, February 2013), https://www.bls.gov/cps/cps13adj.pdf.
2 People whose ethnicity is identified as Hispanic or Latino may be of any race. About 90 percent of people of Hispanic or Latino ethnicity identify themselves as White race in the CPS.
3 The National Bureau of Economic Research determines the beginning and ending dates of recessions. The most recent recession began in December 2007 and ended in June 2009. Turning points for recessions are quarterly in this analysis.
4 Unemployment rates by occupation are based on the last job an individual held. Excluded are unemployed people who have no previous work experience.
5 The duration of joblessness is the length of time (through the current reference week) that people classified as unemployed have been looking for work. This measure refers to the duration of the current spell of unemployment, rather than to that of a completed spell.
6 For additional information, see Thomas Luke Spreen, “Ranks of those unemployed for a year or more up sharply,” Issues in Labor Statistics, Summary 10–10 (U.S. Bureau of Labor Statistics, October 2010), www.bls.gov/opub/ils/pdf/opbils87.pdf.
7 For more information and analysis of recent data, see Randy E. Ilg, “How long before the unemployed find jobs or quit looking,” Issues in Labor Statistics, Summary 11–1 (U.S. Bureau of Labor Statistics, May 2011), www.bls.gov/opub/ils/pdf/opbils89.pdf; Harley J. Frazis, “Labor force flows in the most recent recession,” Issues in Labor Statistics, Summary 10–08 (U.S. Bureau of Labor Statistics, July 2010), www.bls.gov/opub/ils/pdf/opbils85.pdf; and Harley J. Frazis and Randy E. Ilg, “Trends in labor force flows during recent recessions,” Monthly Labor Review, April 2009, pp. 3–18, www.bls.gov/opub/mlr/2009/04/art1full.pdf.
8 Effective with the data for January 2013, updated population estimates were used in the household survey. Each year, the Census Bureau updates the population estimates to reflect new information and assumptions about the growth of the population during the decade. In accordance with usual practice, the BLS did not revise the official household survey estimates for December 2012 and earlier months. For additional information on the population adjustments and their effect on national labor force estimates, see “Adjustments to Household Survey Population Estimates in January 2013” (U.S. Bureau of Labor Statistics, February 2013), https://www.bls.gov/cps/cps13adj.pdf.
9 See endnote 3.
10 For additional information, see Emy Sok, “Involuntary part-time work on the rise,” Issues in Labor Statistics, Summary 08–08 (U.S. Bureau of Labor Statistics, December 2008), www.bls.gov/opub/ils/pdf/opbils71.pdf.
11 For more research on labor force participation, see, for example, Michelle L. Barnes, Fabia Gumbau-Brisa, and Giovanni P. Olivei, “Cyclical versus secular: decomposing the recent decline in U.S. labor force participation,” Public Policy Briefs, no. 13-2 (Federal Reserve Bank of Boston, July 2013), http://www.bostonfed.org/economic/ppb/2013/ppb132.pdf.
12 For additional information on labor force participation by age, and specifically among older workers, see Willem Van Zandweghe, “Interpreting the recent decline in labor force participation,” Economic Review (Federal Reserve Bank of Kansas City, Q1 2012), pp. 5–34, http://www.kansascityfed.org/publicat/econrev/pdf/12q1VanZandweghe.pdf; Emy Sok, “Record unemployment among older workers does not keep them out of the job market,” Issues in Labor Statistics, Summary 10–04 (U.S. Bureau of Labor Statistics, March 2010), https://www.bls.gov/opub/btn/archive/record-unemployment-among-older-workers-does-not-keep-them-out-of-the-job-market.pdf; and Abraham Mosisa and Steven Hipple, “Trends in labor force participation in the United States,” Monthly Labor Review, October 2006, pp. 35–57, https://www.bls.gov/opub/mlr/2006/10/art3full.pdf.
13 See Teresa L. Morisi, “The early 2000s: a period of declining teen summer employment rates,” Monthly Labor Review, May 2010, pp. 23–35, https://www.bls.gov/opub/mlr/2012/05/art2full.pdf; and “Youth enrollment and employment during the school year,” Monthly Labor Review, February 2008, pp. 51–63, https://www.bls.gov/opub/mlr/2008/02/art3full.pdf.
14 “People not in the labor force who want a job” are a measure of people who reported wanting a job without having necessarily looked for one; conceptually, this group includes all people who reported that they currently want a job.
15 For additional analysis of people marginally attached to the labor force, see Sharon Cohany, “Ranks of discouraged workers and others marginally attached to the labor force rise during recession,” Issues in Labor Statistics, Summary 09–04 (U.S. Bureau of Labor Statistics, April 2009), https://www.bls.gov/opub/ils/pdf/opbils74.pdf.
16 For further information, see Steven E. Haugen, “Measures of labor underutilization from the current population survey,” Working Paper 424 (U.S. Bureau of Labor Statistics, March 2009), www.bls.gov/osmr/research-papers/2009/pdf/ec090020.pdf.
17 Data on earnings are collected from one-fourth of the CPS sample each month and are limited to wage and salary workers. Self-employed workers, both incorporated and unincorporated, are excluded from CPS earnings estimates, and as such, self-employment income is not considered. Importantly, note that the comparisons of earnings are on a broad level and do not control for many factors that can be significant in explaining earnings differences.
18 Veterans who served in more than one wartime period are classified into only the most recent one.