An official website of the United States government
An official website of the United States government
The .gov means it's official.
Federal government websites often end in .gov or .mil. Before sharing sensitive information,
make sure you're on a federal government site.
The site is secure.
The
https:// ensures that you are connecting to the official website and that any
information you provide is encrypted and transmitted securely.
As California’s labor market recovery continues in 2014, a lot of attention is being paid to the Bay Area technology industry, including the industries with a strong presence in Silicon Valley. Employment in this part of the economy has grown at a rate that has propped up the recovery of all nonfarm employment throughout the state. This surge in employment is particularly interesting because it highlights the difference in how northern and southern California have fared recovering jobs after the Great Recession.1
The current rate of growth in technology contrasts greatly with this industry’s performance in the wake of the 2001 recession. During that period, the tech industry suffered a substantial decline. As a result, large, northern California cities like San Francisco and San Jose lagged behind their southern counterparts—including Los Angeles, San Diego, and Riverside. Southern California cities generally benefited from having smaller technology centers, and were buoyed by their dominant leisure and hospitality industry.2
As the state recovers from the 2007–2009 recession, the tables have turned. Employment in technology-driven industries is growing at a faster pace than other industries. Accordingly, employment growth in several large, northern California cities is outpacing growth in southern parts of the state.
This article offers a look at California employment growth in four different North American Industry Classification System (NAICS) sectors—professional and business services, information, leisure and hospitality, and education and health services. With respect to professional and business services, a more detailed examination of the three industry groups that make up this sector is conducted. The analysis focuses on eight California areas (four northern and four southern) that had total nonfarm employment of 750,000 or more in both 2008 and 2014.3 The northern areas examined are San Francisco–San Mateo–Redwood City Metropolitan Division, Oakland–Fremont–Hayward Metropolitan Division, San Jose–Sunnyvale–Santa Clara MSA, and Sacramento–Arden–Arcade–Roseville Metropolitan Statistical Area (MSA). The southern areas are Los Angeles–Long Beach–Glendale Metropolitan Division, Santa Ana–Anaheim–Irvine Metropolitan Division, San Diego–Carlsbad–San Marcos MSA, and Riverside–San Bernardino–Ontario MSA.4 The results offer an interesting perspective on different post-recession recovery patterns for the northern and southern California areas.
Data from the Current Employment Statistics (CES) survey, conducted by the Bureau of Labor Statistics, are used to calculate employment recovery ratios—the ratio of employment in an industry at a given time compared with the industry’s peak employment.5 This analysis compares employment levels in January 2008 with those in January 2014. January 2008 was the month where nonfarm employment across the nation reached its peak. This data point serves as an adequate proxy for peak employment in the selected areas. The January 2014 end date allows for year-over-year comparisons of not seasonally adjusted data.6
Using the January 2014 and January 2008 data points, a recovery ratio is calculated to determine the percent of peak nonfarm employment recovered in the eight large California areas studied at selected supersector and detailed industry level. A value less than one indicates that January 2014 employment was below the January 2008 level. Conversely, a value greater than one signals that January 2014 employment was above the January 2008 peak. More precisely, a ratio of 1.06 would indicate 6 percent growth above the January 2008 level, whereas a ratio of .98 would show that the January 2014 rate was only 98 percent of January 2008 employment.
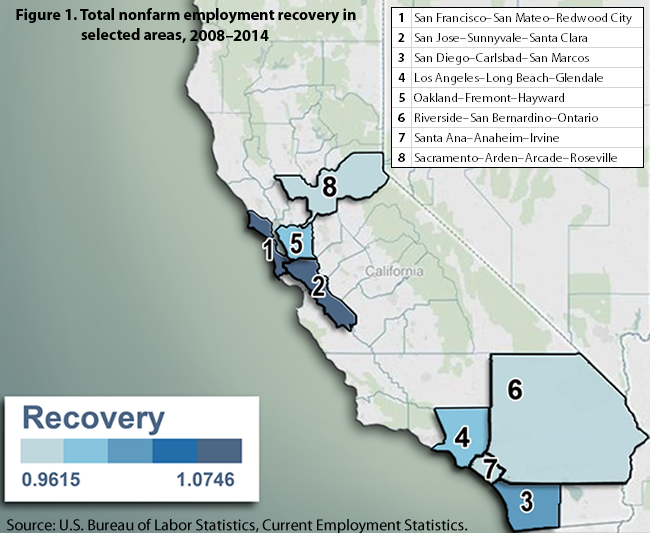
The first step in the analysis requires calculating recovery ratios of the four selected sectors in each of the eight large areas studied. Of the eight areas, only three had recovery ratios greater than 1.00. Values range from 0.96 in Sacramento—Arden—Arcade—Roseville to 1.07 in San Francisco—San Mateo—Redwood City. As figure 1 shows, two of the three Bay Area localities stand out with the highest recovery ratios.
The professional and business services sector composed the largest share of total nonfarm employment in San Francisco–San Mateo–Redwood City Metropolitan Division, San Jose–Sunnyvale–Santa Clara MSA, Santa Ana–Anaheim–Irvine Metropolitan Division, and San Diego–Carlsbad–San Marcos MSA. Of those areas, the two northern areas, San Francisco–San Mateo–Redwood City Metropolitan Division and San Jose–Sunnyvale–Santa Clara MSA had the larger percentages compared to the southern two areas.
The information sector has the smallest share of total nonfarm employment in every area. San Francisco–San Mateo–Redwood City Metropolitan Division, San Jose–Sunnyvale–Santa Clara MSA, and Los Angeles–Long Beach–Glendale Metropolitan Division have information sectors with larger shares of total nonfarm employment compared to the other areas.
The leisure and hospitality sector accounts for about 10 percent of total employment across the eight areas examined. The sector’s highest share is held in the northern area of San Francisco-San Mateo-Redwood City area, with 13 percent. The lowest share is found in the southern area of Riverside—San Bernardino—Ontario, where only 6.9 percent of workers are employed in this sector. Despite these two outliers, the southern areas generally have a greater concentration of workers in leisure and hospitality. Three of the four southern areas have more than 10 percent of workers in this sector. Three of the four northern areas have 10 percent or fewer workers in this sector. (See table 1.)
| Area | Education and health services | Leisure and hospitality | Professional and business services | Information |
|---|---|---|---|---|
| San Francisco–San Mateo–Redwood City | 13.3 | 13.0 | 23.2 | 4.8 |
| San Jose–Sunnyvale–Santa Clara | 15.3 | 8.8 | 19.7 | 6.3 |
| San Diego–Carlsbad–San Marcos | 13.7 | 12.4 | 17.1 | 1.8 |
| Los Angeles–Long Beach–Glendale | 17.6 | 10.4 | 14.5 | 4.8 |
| Oakland–Fremont–Hayward | 16.8 | 9.4 | 16.5 | 2.1 |
| Riverside–San Bernardino–Ontario | 14.8 | 6.9 | 10.8 | .9 |
| Santa Ana–Anaheim–Irvine | 12.5 | 12.7 | 18.4 | 1.7 |
| Sacramento–Arden–Arcade–Roseville | 15.0 | 10.0 | 13.3 | 1.7 |
| Source: U.S. Bureau of Labor Statistics, Current Employment Statistics survey. | ||||
Education and health services represents a large share of employment in all eight areas without significant differences in composition or relative share of total nonfarm. The industry is large and recovering strongly, with few differences across the eight areas.
Having established the relative size of key industries in each area, the next step in the analysis is to calculate recovery ratios at the sector level to see which sectors are driving the total nonfarm recovery.
Across most areas, education and health services was the sector with the highest recovery ratio. Because this sector’s growth, driven by health care and social assistance, was fairly consistent throughout the north and south regions, analysis here does little to explain why one part of the state is outperforming the others. In the four southern areas, leisure and hospitality was the sector that showed the second largest recovery ratios. In the north, information generally showed outsized recovery ratios. The two areas where the Silicon Valley is located, San Francisco—San Mateo—Redwood City Metropolitan Division and San Jose—Sunnyvale—Santa Clara MSA, were the only areas where recovery in the information sector outpaced recovery in education and health services. In addition, the Sacramento–Arden–Arcade–Roseville MSA showed the second largest recovery ratio in professional and business services (See Table 2.)
| Area | Education and health services | Leisure and hospitality | Professional and business services | Information |
|---|---|---|---|---|
| San Francisco–San Mateo–Redwood City | 1.22 | 1.15 | 1.19 | 1.31 |
| San Jose–Sunnyvale–Santa Clara | 1.29 | 1.16 | 1.08 | 1.44 |
| San Diego–Carlsbad–San Marcos | 1.25 | 1.04 | 1.01 | .76 |
| Los Angeles–Long Beach–Glendale | 1.20 | 1.11 | 1.03 | 1.00 |
| Oakland–Fremont–Hayward | 1.21 | 1.13 | 1.05 | .75 |
| Riverside–San Bernardino–Ontario | 1.27 | 1.06 | .96 | .73 |
| Santa Ana–Anaheim–Irvine | 1.20 | 1.07 | .99 | .83 |
| Sacramento–Arden–Arcade–Roseville | 1.14 | .99 | 1.04 | .75 |
| Source: U.S. Bureau of Labor Statistics, Current Employment Statistics survey. | ||||
The information sector has substantially stronger recovery ratios in San Francisco-San Mateo-Redwood City, and San Jose-Sunnyvale-Santa Clara. Even though the information industry is relatively small, it is important because the information industry is dominated by very different types of firms in the northern and southern areas. In the southern areas, information employment is driven by the motion picture industry and related support activities. While in the Bay Area, the motion pictures industry plays a relatively small role compared to the software and Internet service related industries. The strong information recovery ratios in San Francisco-San Mateo-Redwood City and San Jose-Sunnyvale-Santa Clara support the positive impact of technology on total nonfarm employment growth in those areas.
Similar to the job recovery for the information sector, recovery ratios for professional and business services are highest in the two northern areas where Silicon Valley is located, and lowest in the southern areas. Professional and business services is the industry in which the effect of the technology sector is most apparent. A deeper look at this particular industry yields interesting results.
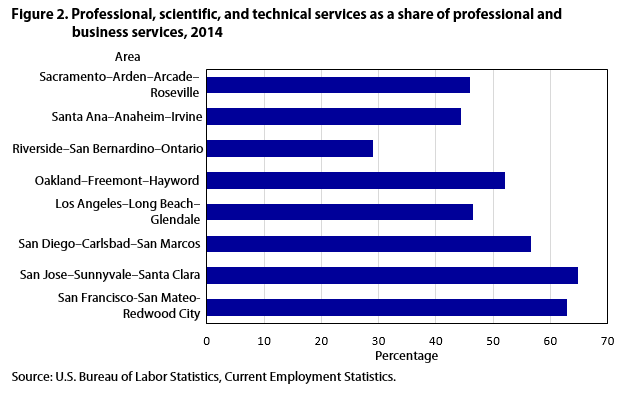
Professional and business services comprises three industry groups: professional, scientific, and technical services; management of companies and enterprises; and administrative and support and waste remediation services. Of these three, professional, scientific, and technical services captures the largest portion of the Silicon Valley tech industry growth. This industry group includes, among other services, a wide range of technology-based services related to Internet software, computer design, and consulting services. (See figure 2.)
The recovery ratios for each of the industry groups within professional and business services demonstrates the strength of the recovery in the Bay Area. Professional, scientific, and technical services, along with administrative and support and waste remediation services make up about 50 percent and 40 percent, respectively; the recovery ratios in these areas go further toward explaining the recovery in the professional and business services sector. (See table 3.) The high recovery ratios for management of companies and enterprises is misleading, however, as this industry group makes up less than 10 percent of professional and business services across the eight areas.
| Area | Professional, scientific, and technical services | Management of companies and enterprises | Administrative and support and waste remediation services |
|---|---|---|---|
| San Francisco–San Mateo–Redwood City | 1.26 | 0.97 | 1.14 |
| San Jose–Sunnyvale–Santa Clara | 1.19 | 1.07 | 1.01 |
| San Diego–Carlsbad–San Marcos | 1.05 | 1.30 | 1.13 |
| Los Angeles–Long Beach–Glendale | 1.03 | 1.04 | 1.02 |
| Oakland–Fremont–Hayward | .93 | 1.22 | .95 |
| Riverside–San Bernardino–Ontario | .86 | .86 | .98 |
| Santa Ana–Anaheim–Irvine | .99 | 1.07 | .95 |
| Sacramento–Arden–Arcade–Roseville | .90 | 1.22 | 1.13 |
| Source: U.S. Bureau of Labor Statistics, Current Employment Statistics survey. | |||
The employment recovery in California has been strongest in those areas most heavily invested in the technology industry. The greatest recovery gains, both in total nonfarm employment and tech-intensive industries, occurred in the Silicon Valley areas, San Francisco-San Mateo-Redwood City Metropolitan Division and San Jose-Sunnyvale-Santa Clara MSA. These two areas had total nonfarm recovery ratios over 1.06 compared with an average of 0.98 across the other six large areas.
Looking deeper into the composition of professional and business services, the effect of growth in professional, scientific, and technical services was the clear driver of the strong performance in the Silicon Valley areas. Lower total nonfarm recovery ratios are most prevalent in those areas with the weakest technology industries and the least active professional, scientific, and technical services industry groups.
An analysis of the data reveals that there exists a strong relationship between employment recovery in the technology related industries and recovery at the total nonfarm level. This highlights the importance of the technology industry in employment recovery from the most recent recession. Because technology related industries are proportionally larger and higher growth in the San Francisco-San Mateo-Redwood City Metropolitan Division and San Jose-Sunnyvale-Santa Clara MSA areas, employment recovery has occurred at a much faster clip in the Silicon Valley areas than it has in the southern areas. This growth has bolstered northern California’s recovery, creating a much higher rate of growth in the northern areas than found in the southern areas
Nicole Havins, "Technology industries helped post-Great Recession jobs grow faster in northern than in southern California ," Monthly Labor Review, U.S. Bureau of Labor Statistics, December 2014, https://doi.org/10.21916/mlr.2014.39
1 Refers to the recession beginning December 2007 and ending June 2009 according to the National Bureau of Economic Research (NBER) “US business cycle expansions and contractions,” http://www.nber.org/cycles.html.
2 Mary Daly and Fred Furlong, “Profile of a recession—the U.S. and California." FRBSF Economic Letter, February 22, 2002, http://www.frbsf.org/economic-research/publications/economic-letter/2002/february/profile-of-a-recession-the-us-and-california/.
3 The monthly Regional and State Employment and Unemployment release notes the largest and smallest changes in total nonfarm employment for areas with average employment greater than 750,000.
4 State and metropolitan area estimates are currently published based on the 2009 area definitions outlined by the Office of Management and Budget in OMB bulletin 10-02. The new 2013 definitions outlined in OMB bulletin 13-01 will become the standard CES metropolitan area definitions with the release of January 2015 preliminary data in March 2015. For the scope of this analysis note that the current CES area definitions still include Marin County as part of the San Francisco-San Mateo-Redwood City Metropolitan Division.
5 The CES survey collects monthly employment, hours, and earnings data from approximately 144,000 business represented by about 554,000 establishments.
6 CES Metropolitan Statistical Area (MSA) and metropolitan division data are not seasonally adjusted for industries below the total nonfarm employment level. Also note that, since January 2014, data have not been benchmarked and year-over-year comparisons may include some effect of differing seasonality between the benchmarked history and sample based data.