An official website of the United States government
An official website of the United States government
The .gov means it's official.
Federal government websites often end in .gov or .mil. Before sharing sensitive information,
make sure you're on a federal government site.
The site is secure.
The
https:// ensures that you are connecting to the official website and that any
information you provide is encrypted and transmitted securely.
The current school choice debate has many possible consequences, not just for students, but also for teachers. Broadly speaking, schools are either publicly or privately funded. Public schools are funded by the government through federal, state, and local taxes, and most are part of a larger school system. Elected school board members and education officials implement and oversee strict rules and procedures that public schools must follow. Private schools do not receive government money and thus have to raise their own funds. Private school officials may have more leeway to run schools as they see fit, but funders and others may play a significant administrative role.
Given the proliferation in school privatization, this article analyzes the fundamental differences between the two sectors with regard to teacher staffing and pay disparities. We employ the Current Population Survey (CPS) to document differences between teachers in the two sectors with regard to unionization density, gender and race or ethnicity, educational attainment, and relative pay gaps between public and private sector teachers and between both and other college graduates.
The debate about school privatization and the push toward both publicly and privately funded charter schools should include differences in teacher staffing and relative pay by school ownership. Staffing and pay differences across type of ownership may be due to or may influence factors such as teacher cohesion and student achievement. For example, teachers may trade off between pay and safer schools or smaller class sizes. (The pupil–teacher ratio in 2010 was 16.0 for public schools and 12.2 for private schools.)1 Or it could be that lower paid teachers desire to work at higher paying schools but competition prevents them from finding such employment.
The teachers studied in this article are elementary, middle, and secondary school teachers. Previous research on relative teacher pay has either analyzed teachers without respect to the type of school ownership or restricted the analysis to those employed in the public sector. Moreover, much of the focus has been on identifying a reasonable comparison group or set of occupations similar to teaching.2 Not much inquiry has been directed specifically toward pay differentials of teachers across ownership structures—that is, teachers in publicly or privately funded school systems.3
Student academic achievement depends in large part on the quality and experience of teachers. Thus, the ability of schools to recruit and retain excellent instructors is of great importance and is fundamentally linked to relative teacher pay. The opportunity cost of choosing to become a teacher is high if relative teacher pay falls substantially behind the pay of other professionals or other career paths. This consideration of opportunity cost also applies when teachers are deciding between the two sectors.
Research on elementary and secondary school teachers has shown that their pay has not been commensurate with that of other professionals and the gap has been widening.4 Although research on this topic has been contradictory,5 two previous studies by Sylvia Allegretto, Sean Corcoran, and Lawrence Mishel clearly evidenced a long-run decline in relative teacher pay.6 In their 2004 piece, they analyzed teachers in the public and private sectors as a group in comparison to other college graduates. Critics of the article inveighed against their selection of teachers from both sectors, because the two sectors differ on several fronts, making the teacher pay gap appear even larger with the inclusion of the private sector teachers. In response, in 2008 Allegretto, Corcoran, and Mishel published the results of a study in which the sample of teachers was restricted to those in the public sector. This work showed that public school teachers earned, on average, 15 percent less than comparable workers in 2006 but had slightly better fringe benefits than other professionals had—making up close to 2 percentage points of the pay gap.
Both studies documented long-run increases in the teacher pay gap, especially for women. In their 2008 paper, Allegretto, Corcoran, and Mishel found that the pay gap between female public school teachers and comparably educated women—for whom the labor market changed dramatically over the 1960–2000 period—fell by nearly 28 percentage points, from a relative wage advantage of 14.7 percent in 1960 to a pay disadvantage of 13.2 percent in 2000.7 Among all public school teachers, the relative wage disadvantage fell by almost 20 percentage points over the same period. Furthermore, the teacher pay gap has been linked to a sharp decline in high-achieving graduates entering the teaching profession, with potential candidates preferring other careers.8 The research design and data for the analysis presented here follow those employed by Allegretto, Corcoran, and Mishel. Among the main demographic findings are that (1) teachers, regardless of whether they are in the public or private sphere, are overwhelmingly female and (2) whites are overrepresented, while Blacks and Hispanics are underrepresented, in the teaching profession, compared with their respective shares in the workforce. Also, unionization rates differ starkly by sector, by Census division, and for teachers, compared with the workforce in general: regardless of the Census division in which they work, teachers in both sectors have higher union density compared with the overall workforce in the corresponding sector. Furthermore, the union density of public sector teachers is greater than that of their private sector counterparts—and this public–private disparity holds for the overall workforce, by sector, for each division.
Given the documented importance of gender, other demographics, and union representation in the literature,9 a regression-based approach is utilized to estimate relative teacher pay. A repeated cross section of respondent data from 1996 to 2012 is pooled to estimate pay gaps for four teacher groups: unionized public sector teachers, unionized private sector teachers, nonunionized public sector teachers, and nonunionized private sector teachers. Thus, we compare teacher pay relative to that of comparable workers and among the four teacher groups. Main results from our regression-based analyses reveal that nonunionized teachers in the private sector have the largest pay gap (–32.1 percent), and unionized public sector teachers have the smallest pay gap of the four teacher groups, but still a negative one (–13.2 percent), relative to comparable nonteacher workers. The relative teacher pay gaps are larger for male teachers than for female teachers.
We use CPS data from 1996 through 2012. These data allow for the identification of workers by occupation, education, industry, age, gender, race, union affiliation, and state of residence, along with weekly earnings. Thus, we are able to identify teachers and whether they work in publicly or privately owned schools. The use of the CPS does not allow for the separate identification of finer sector details, such as breaking out religious-based schools or comparing private and public sector charter schools.
The CPS data used in this analysis are nonimputed data.10 When a survey respondent fails to report any earnings, the Bureau of Labor Statistics (BLS, the Bureau) imputes his or her earnings. The imputation procedure is based on a Census Bureau “hot deck” methodology that finds a respondent or “donor” in the survey who closely matches the nonrespondent in characteristics such as location, age, race, and education. Importantly, occupation is not necessarily one of the criteria used to impute earnings, and nonresponding teachers are often assigned the average earnings of nonteacher college graduates. Thus, on average, the inclusion of imputed data creates a systemic bias that increases average teacher pay and decreases the average pay of other college graduates.11
In addition, the share of CPS earnings data that are imputed has grown markedly over time; hence, the bias has worsened. In 1983, imputed earnings data in the CPS were 12.3 percent; by the start of our research in 1996, imputations accounted for 24.5 percent of the sample, and at the end of the research in 2012, imputations made up 35.2 percent of the sample. Imputed data are not available in 1994 and only for the last 4 months of 1995; thus, for consistency, we begin our analysis in 1996.
The sample is restricted to workers 21 years of age and older who worked at least 35 hours per week. It is composed of 1.486 million total (weighted) observations pertaining to 56,531 teachers, 47,779 in the public sector and 8,752 in the private sector.
The first part of the analysis is descriptive and reports differences in staffing trends between the two sectors by demographics, as well as differences in union affiliation and average weekly pay. Then, econometric methods are used to analyze and compare the relative pay differentials between teachers in the two sectors and between teachers and nonteachers. The fundamental differences reported in the descriptive statistics are utilized as important controls in the econometric analysis. Initially, a pooled repeated cross-sectional dataset generates regression-based estimates, controlling for time. Lastly, annual estimates are generated from 1996 through 2012 to report relative pay trends over time.
Table 1 shows the staffing differences of teachers in the two sectors by demographic and other characteristics. On average over the entire sample period, the majority of teachers were employed in public schools (85 percent) while most nonteachers worked in the private sector (84 percent). However, the public sector share of all teachers decreased over time, falling from 85 percent in 1996 to 81 percent in 2012. Thus, the incidence of teachers in the private sector has trended upward over time, with the share of private sector teachers working at for-profit schools increasing (from 6 percent in 1996 to 10 percent in 2012) more than the share working at nonprofit schools (from 9 percent to 10 percent).
| Characteristic(1) | Teachers | Nonteacher workers | All | ||
|---|---|---|---|---|---|
| Public | Private | Public | Private | ||
Percentage of all workers | 4 | 96 | 100 | ||
Percentage of sample of teachers | 85 | 15 | … | … | … |
Percentage of sample of nonteachers | … | … | 16 | 84 | … |
Female | 72 | 73 | 51 | 42 | 44 |
Mean age | 41.6 | 41.1 | 43.3 | 39.4 | 40.0 |
Standard deviation | (10.8) | (11.2) | (10.6) | (11.0) | (11.0) |
Race: | |||||
White | 84 | 85 | 71 | 70 | 71 |
Black | 8 | 6 | 14 | 9 | 10 |
Hispanic | 6 | 6 | 9 | 15 | 14 |
Other | 2 | 3 | 6 | 6 | 6 |
Married | 71 | 70 | 66 | 60 | 62 |
Education:(2) | |||||
Some college or associate's degree | 2 | 5 | 31 | 29 | 28 |
Bachelor's degree | 50 | 54 | 24 | 21 | 22 |
Master's degree and above | 47 | 40 | 20 | 8 | 11 |
Mean weekly pay, 2010 dollars | $1,013 | $836 | $958 | $888 | $901 |
Standard deviation | (412.5) | (389) | (527.2) | (601.9) | (586.4) |
Mean weekly hours | 43.5 | 43.4 | 41.6 | 42.8 | 42.7 |
Standard deviation | (6.8) | (6.9) | (5.8) | (6.7) | (6.6) |
Union membership | 65 | 28 | 36 | 9 | 15 |
Number of observations | 47,779 | 8,752 | 228,895 | 1,200,395 | 1,485,821 |
| Notes: (1) In percent, unless otherwise indicated. (2) Percentages do not sum to 100 because shares of those without a high school diploma and high school graduates are not reported in the table. Note: Weighted sample of workers who worked at least 35 hours per week and were at least 21 years old. Imputed data are excluded. Detailed entries may not sum to totals because of rounding. Source: Authors' analysis of CPS data, 1996–2012. | |||||
Gender. Teaching remains a feminized occupation, with stark differences in the gender makeup of teachers compared with that of the overall workforce. Although women accounted for approximately 44 percent of the overall sample, they are disproportionally represented as teachers. Moreover, their share has not changed much over time. Women account for a slightly higher share of teachers in the private (73 percent) versus the public (72 percent) sector. Table 1 also shows differences between teachers in the private and the public sectors with regard to race, percentage of union membership, education level, and weekly pay. We next examine these differences in detail.
Race or ethnicity. The racial and ethnic makeup of teachers has changed over time, reflecting, in part, the racial shift in the overall population and workforce. Figure 1 shows the racial or ethnic share of workers and teachers in both sectors over time.12 The figure offers a comparison of nonteacher workforce shares with teacher shares and indicates whether a racial or ethnic cohort is under- or overrepresented as teachers across the two ownership structures. Note that the share of non-Hispanic Whites in the overall workforce, in both sectors, has declined over time, as has the share of White teachers, although Whites are consistently overrepresented in the teaching profession.
The share of Black workers who are not teachers has remained fairly steady in the private sector, at 9 percent to 10 percent, over time. Because Blacks represent a relatively higher, albeit slightly decreasing, share of workers in the public sector,13 they are a disproportionate share of public workers in the nonteacher workforce. However, Blacks are underrepresented as teachers in both ownership arrangements.
Figure 1 also depicts the growing share of Hispanic workers in the United States.14 Hispanic shares of the workforce and of teachers have increased over time. During the 1996–2012 period, Hispanic shares of the private sector nonteacher workforce increased from 12 percent to 17 percent and Hispanic shares of the public sector nonteacher workforce grew from 8 percent to 11 percent. Hispanic shares of teachers also increased over the same timeframe, from 4 percent to 8 percent in the private sector and from 5 percent to 9 percent in the public sector. Despite this relatively equal growth, Hispanics remain far more underrepresented as teachers in the private sector than in the public sector. For instance, in 2011–2012, Hispanics were 17 percent of the private sector workforce but just 8 percent of teachers in the private sector. The disparity was smaller in the public sector, where Hispanics were 11 percent of the workforce and 9 percent of teachers.
Workforce shares for the catchall “other” group were similar between the two sectors over the 1996–2012 timeframe, as was the growth of the group in each sector. Shares of this cohort have been growing, but diverging, over time. At the beginning of the period, the group’s share of private school teachers was 1 percent and its share of public school teachers was 2 percent. By 2011–2012, the group made up 5 percent of private school teachers and 4 percent of public school teachers—still small, but growing, shares compared with the representation of the “other” group in the overall workforce.
In general, Whites are overrepresented in the teaching profession, regardless of sector, while Blacks, Hispanics, and those in the “other” category are underrepresented. In the 2011–2012 period, the distribution of the nonteacher workforce in the private sector was 66 percent White, 9 percent Black, 17 percent Hispanic, and 7 percent “other,” while teacher representation was 81 percent White, 6 percent Black, 8 percent Hispanic, and 5 percent “other.” For public sector nonteacher workers, the percentages were 69 percent for Whites, 13 percent for Blacks, 11 percent for Hispanics, and 7 percent for “others,” while the teacher distribution was 80 percent (Whites), 8 percent (Blacks), 9 percent (Hispanics), and 4 percent (“others”).
Generally, Hispanics are more likely to be employed in the private sector while Blacks are more likely to work in the public sector. Thus, teacher underrepresentation for Hispanics is far greater in the private sector, whereas, for Blacks, it is far greater in the public sector.
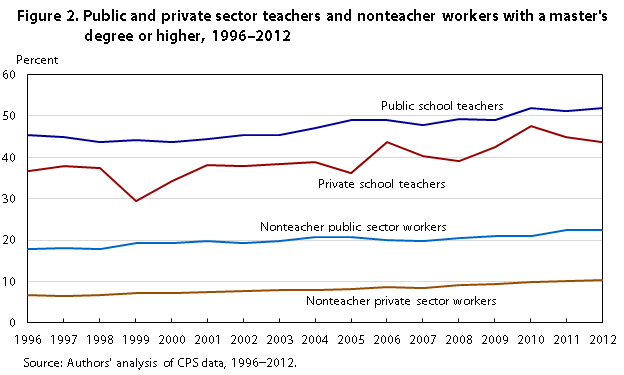
Education. There are also large differences in the educational attainment of teachers across the two types of ownership. Today, for all intents and purposes, teachers teaching in a formal setting are required to have at least a bachelor’s degree. Figure 2 shows the percentage of teachers who have at least a master’s degree.
The share of teachers with a master’s degree increased in both sectors over the 1996–2012 timeframe, but, regardless of the year, the share has always been higher in the public sector. In 2012, the share of teachers with at least a master’s degree was 52 percent in the public sector and 44 percent in the private sector.
Figure 2 also shows the trends for nonteacher workers. In both the public and the private sector, the share is much lower than that for teachers in either sector. About 22 percent of workers in the public sector have at least a master’s degree, while just 1 in 10 do in the private sector.
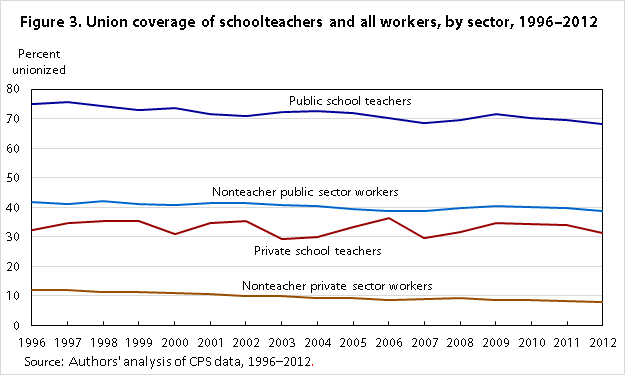
Unionization. The percentage of workers represented by a union (union members or workers covered by a union contract) is one of the main institutional differences between the two sectors. Figure 3 shows the trends in union representation for teachers and for all nonteacher workers, for both sectors.
The well-known longer term decline in unionization in the United States is evident in the trend line for the nonteacher private sector workforce. Union representation among this workforce fell from 12 percent to 8 percent over the 1996–2012 period. Public sector unionization was consistently higher, for both teachers and nonteachers, but all the rates are declining except those for private school teachers, which are erratic, perhaps because of the smaller sample size. Still, the general trend for this group has been flat. The union–nonunion gap for teachers across the two sectors is very large: in 2012, union density was 68 percent in the public sector and 31 percent in the private sector.
Figure 4 shows union densities for teachers and nonteachers across the two sectors and by Census division.15 A comparison of the two panels in the chart shows that teachers, in either sector, are represented by unions at higher rates than their respective nonteacher counterparts. Large disparities exist in particular in the low-union-density West South Central division (Arkansas, Louisiana, Oklahoma, and Texas), in which teacher unionization rates are 42 percent in the public sector and 28 percent in the private sector while rates for the nonteaching workforce are a much smaller 18 percent in the public sector and 4 percent in the private sector.
Weekly wages. Figure 5 shows the mean weekly wages of various groups of workers. Over the 1996–2012 period, trends in real wages (in 2010 dollars) were up for all groups by various degrees. Five groups are represented in the figure, in order from highest to lowest wages throughout the period examined: nonteacher college graduates (those with at least a bachelor’s degree), public school teachers, all workers, private school teachers, and nonteacher workers without a bachelor’s degree.
Wage growth from 1996 through 2012 was highest for the all-worker group (17.9 percent) and lowest for public school teachers (2.9 percent), compared with wage growth of 10.4 percent for teachers in the private sector. Average wages for college graduates increased by 12.4 percent during tight labor markets from 1996 to 2000, the peak year of the economic cycle, but wages were essentially unchanged from 2001 to 2012. Over the same timeframe, weekly pay increased by 2.9 percent ($28.70) for teachers in the public sector and by 10.4 percent ($79.70) for teachers in the private sector. The trends suggest that pay in the private sector is more responsive to economic cycles; union contracts may insulate pay fluctuations for teachers in the public sector to some degree. In 2012, the average weekly wage of teachers in the public sector was $1,021.60, compared with $845.00 for teachers in the private sector, a difference of $176.60. Thus, teachers in the public arena make, on average, 21 percent more than their private sector counterparts.
Another, slightly different, look at wage trends is given in figure 6, which depicts four ratios during the period from 1996 to 2012: public school teachers to all workers, private school teachers to all workers, public school teachers to nonteacher college graduates, and private school teachers to nonteacher college graduates. A few points to highlight are that, over the given timeframe, (1) all of these ratios trended lower, (2) there was never any change in the order of the ratios, and (3) all of the ratios were always less than 1, except for the wages of teachers in the public sector compared with those of all workers. The wage ratio of less than 1 for both private and public school teachers in relation to nonteacher college graduates reiterates what was seen in figure 5: that teachers earned less than other college graduates, on average, and that the gaps grew from 1996 to 2012. These results for the United States are in line with those found in other member countries of the Organisation for Economic Co-operation and Development: teacher salaries in most of those countries are lower than the salaries of nonteacher college graduates. In the U.S. case, however, the difference is larger.16
The descriptive analysis presented here shows that teacher staffing differences with regard to demographics, weekly wages, and unionization density vary considerably with the type of school ownership, public or private. Of course, differences may be driven by an array of factors, so the next section utilizes regression-based analyses to control for the many factors that may influence teacher pay differentials.
We begin the analysis with a typical statistical earnings function that estimates pay differentials for teachers compared with those for other workers, as well as pay differentials between public and private school teachers:
 (1)
(1)
Here, ln yi is the natural logarithm of the weekly wage,17 X is a vector of individual characteristics,19 Allegretto, Corcoran, and Mishel discuss in detail the issue of using hourly, weekly, or annual earnings to estimate teacher pay differentials. As they state, annual earnings of teachers cannot be directly compared with those of nonteachers, given that teachers are typically contracted to work only a 9-month year.20 In addition, differences arise over how much time teachers devote to professional development outside of their official 9-month contract. The time that other workers (especially professionals) take for vacation, as well as time that they otherwise spend off the job, also muddles an annual analysis, because time spent off the job frequently is included in measures of weeks worked by nonteachers, but not teachers.
Finally, considerable debate arises in regard to analyses of hourly pay of teachers and other professionals because the number of hours teachers work at home is uncertain but mostly likely is more than that of other professionals. Still, Allegretto, Corcoran, and Mishel compared results on hourly and weekly earnings measures and found no substantial differences.21 In sum, in documenting trends in pay over time, the pay interval under study (weekly, annual, or hourly) is immaterial as regards changes in relative pay.
Teacher pay gaps: private vs. public. We begin the analysis by pooling repeated cross-sectional annual datasets into one dataset in order to estimate teacher relative pay. Tables 2, 3, and 4 respectively present the results of regression analyses on the wages of all teachers, female teachers, and male teachers. It is prudent to provide separate analyses by gender because most teachers are women. The distinct regressions for women and for men allow for the returns to all coefficients to vary, whereas the regressions with the genders together (which include a dummy variable on gender) do not.
Five regressions are carried out on each of three datasets: all teachers, female teachers, and male teachers.22 For each dataset, model 1 (a regression on the sample of all teachers) includes an intercept and a simple dichotomous variable that equals 1 if the observation is a teacher and 0 otherwise, along with state and year controls. As table 2 shows, in model 1 the coefficient of TEACHER (without regard to sector) is 0.192 and is significant at the 1-percent level. Note that the coefficients of dichotomous variables in this model may be calculated in percentage terms as (eb – 1) × 100; therefore, without any controls beyond YEAR and STATE, we find that teachers, on average, earn 21.2 percent more than nonteacher workers.
| Variable | Model number | ||||
|---|---|---|---|---|---|
| 1 | 2 | 3 | 4 | 5 | |
Teacher | 0.192** (.003) | 0.019** (.006) | 0.019** (.006) | -0.314** (.005) | -0.387** (.006) |
Public sector | ... | .125** (.001) | .088** (.001) | -.021** (.001) | -.049** (.001) |
Teacher × Public sector | ... | .103** (.007) | .129** (.006) | .199** (.006) | .190** (.008) |
Union covered | ... | ... | ... | ... | .161** (.001) |
Teacher × Union covered | ... | ... | ... | ... | .082** (.011) |
Public sector × Union covered | ... | ... | ... | ... | -.054** (.003) |
Teacher × Public sector × Union covered | ... | ... | ... | ... | -.026* (.012) |
Overall marginal effect: | |||||
Overall public sector teacher premium:(1) | |||||
Union and nonunion | ... | .122** (.003) | .149** (.003) | -.115** (.002) | ... |
Union | ... | ... | ... | ... | -.141** (.003) |
Nonunion | ... | ... | ... | ... | -.197** (.004) |
Overall private sector teacher premium:(1) | |||||
Union and nonunion | ... | .019** (.006) | .019** (.006) | -.314** (.005) | ... |
Union | ... | ... | ... | ... | -.305** (.009) |
Nonunion | ... | ... | ... | ... | -.387** (.006) |
Demographic | No | No | Yes | Yes | Yes |
Education | No | No | No | Yes | Yes |
Union | No | No | No | No | Yes |
Year fixed effects | Yes | Yes | Yes | Yes | Yes |
State fixed effects | Yes | Yes | Yes | Yes | Yes |
R-squared | .043 | .049 | .228 | .398 | .404 |
Number of observations | 1,485,821 | 1,485,821 | 1,485,821 | 1,485,821 | 1,485,821 |
Notes: (1) Not controlling for union in models 1–4. * Statistically significant at p < .05. Note: Weighted sample of workers who worked at least 35 hours per week and were at least 21 years old. Imputed data are excluded. The dependent variable is the logarithm of weekly earnings. The demographic vector includes controls for age (as a quadratic), marital status, gender, race, and ethnicity. The education vector includes five education-level dummy variables (master's degree or higher, bachelor's degree, some college, high school, and less than high school). Standard errors are in parentheses. Source: Authors' analysis of CPS data, 1996–2012. | |||||
Model 2 adds controls for PUBLIC and an interaction for TEACHER × PUBLIC. The interaction coefficient allows us to differentiate between the public sector premium of teachers and the premium associated with other public sector workers. In other words, it will allow us to see if there is a specific public sector premium for teachers (different from the one in the whole economy). The marginal effects are found in the middle of the table. With this model, we can now estimate separate effects for public school and private school teachers. Again, YEAR and STATE are the other controls in the model. According to model (2), when the coefficients are transformed into percentages, we see that, on average, private school teachers earn 1.9 percent, and public school teachers earn 13.0 percent, more than other workers.23 Thus, in this model, the private-vs.-public gap between teachers is about 11 percentage points, meaning that private sector teachers earn, on average, about 12 percent less than teachers in the public sector.
Model 3 includes a set of demographic controls: gender, race or ethnicity, an age quadratic, marital status, and regional dummies. The effect on the wages of private sector teachers is unchanged from that of model 2 and remains a positive 1.9 percent. The coefficient for public sector teachers is larger, however, and translates into a 16.1-percent gap with other workers. It is in model 4, with the inclusion of educational controls, that the marginal effects of being a teacher become negative: the relative teacher pay gaps are –10.9 percent with public sector workers and –26.9 percent with private sector workers and the gap between teachers in the private versus the public sector is 16 percentage points.
As indicated during our descriptive statistical analyses, private sector unionization density for all workers and for teachers is considerably lower than the corresponding densities for the public sector. For this reason, model 5 adds a UNION dummy variable along with corresponding TEACHER interactions. The resultant estimated pay gaps with nonteacher workers are now calculated for union and nonunion teachers in both sectors, yielding valuable information given that union density is high for public teachers and low for teachers in the private sector.
Results indicate that the pay gap between nonteacher workers and similar unionized public school teachers is –13.2 percent while it is –17.9 percent for nonnunionized public school teachers. The gap for unionized private school teachers is –26.2 percent, compared with –32.1 percent for the more likely situation of nonunion private school teachers. Thus, unionization helps to mitigate the teacher pay gap with nonteacher workers for both sectors, but regardless of union status, the gap is much larger in the private sector.
Given that most teachers are female, we use the same model, specifications, and interpretation as before to perform separate analyses by gender; results are reported in tables 3 and 4 for the women’s and men’s samples, respectively. The qualitative results are seen to be similar as we progress from model 1 through model 5. The most notable difference is that the teacher coefficient for the sample of men turns negative in model 3, when the set of demographic controls is added—in contrast to model 4, when the education controls are added for the sample of all teachers and for female teachers. We leave it to the reader to interpret the regression results for models 1 through 4; we turn instead to the interpretation of the output from model 5, focusing on teachers from both sectors and on union versus nonunion effects.
| Variable | Model number | ||||
|---|---|---|---|---|---|
| 1 | 2 | 3 | 4 | 5 | |
Teacher | 0.311 (.003) | 0.130 (.007) | 0.077 (.007) | -0.273 (.006) | -0.349 (.007) |
Public sector | ... | .154 (.002) | .117 (.002) | -.009 (.002) | -.032 (.002) |
Teacher × Public sector | ... | .095 (.008) | .125 (.007) | .204 (.006) | .196 (.008) |
Union covered | ... | ... | ... | ... | .102 (.003) |
Teacher × Union covered | ... | ... | ... | ... | .153 (.012) |
Public sector × Union covered | ... | ... | ... | ... | -.022 (.004) |
Teacher × Public sector × Union covered | ... | ... | ... | ... | -.075 (.014) |
Overall marginal effect: | |||||
Union and nonunion | ... | .225 (.003) | .201 (.003) | -.069 (.003) | ... |
Union | ... | ... | ... | ... | -.074 (.004) |
Nonunion | ... | ... | ... | ... | -.152 (.005) |
Overall private sector teacher premium:(1) | |||||
Union and nonunion | ... | 130 (.007) | .077 (.007) | -.273 (.006) | ... |
Union | ... | ... | ... | ... | -.196 (.010) |
Nonunion | ... | ... | ... | ... | -.349 (.007) |
Demographic | No | No | Yes | Yes | Yes |
Education | No | No | No | Yes | Yes |
Union | No | No | No | No | Yes |
Year fixed effects | Yes | Yes | Yes | Yes | Yes |
State fixed effects | Yes | Yes | Yes | Yes | Yes |
R-squared | .071 | .083 | .169 | .368 | .372 |
Number of observations | 673,439 | 673,439 | 673,439 | 673,439 | 673,439 |
| Notes: (1) Not controlling for union in models 1–4. Note: Weighted sample of workers who worked at least 35 hours per week and were at least 21 years old. Imputed data are excluded. The dependent variable is the logarithm of weekly earnings. The demographic vector includes controls for age (as a quadratic), marital status, gender, race, and ethnicity. The education vector includes five education-level dummy variables (master's degree or higher, bachelor's degree, some college, high school, and less than high school). Standard errors are in parentheses. All regression results are significant at p < .01. Source: Authors' analysis of CPS data, 1996–2012. | |||||
| Variable | Model number | ||||
|---|---|---|---|---|---|
| 1 | 2 | 3 | 4 | 5 | |
Teacher | 0.145** (.005) | 0.019 (.013) | -0.068** (.011) | -0.403** (.010) | -0.465** (.012) |
Public sector | ... | .145** (.002) | .064** (.002) | -.030** (.002) | -.064** (.002) |
Teacher × Public sector | ... | .026† (.014) | .090** (.012) | .162** (.011) | .153** (.015) |
Union covered | ... | ... | ... | ... | .176** (.002) |
Teacher × Union covered | ... | ... | ... | ... | .034 (.021) |
Public sector × Union covered | ... | ... | ... | ... | -.046** (.003) |
Teacher × Public sector × Union covered | ... | ... | ... | ... | -.005 (.023) |
Overall marginal effect: | |||||
Overall public sector teacher premium:(1) | |||||
Union and nonunion | ... | .045** (.006) | .023** (.005) | -.240** (.005) | ... |
Union | ... | ... | ... | ... | -.283** (.006) |
Nonunion | ... | ... | ... | ... | -.312** (.008) |
Union and nonunion | ... | .019** (.013) | -.068** (.011) | -.403** (.010) | ... |
Union | ... | ... | ... | ... | -.431** (.017) |
Nonunion | ... | ... | ... | ... | -.465** (.012) |
Demographic | No | No | Yes | Yes | Yes |
Education | No | No | No | Yes | Yes |
Union | No | No | No | No | Yes |
Year fixed effects | Yes | Yes | Yes | Yes | Yes |
State fixed effects | Yes | Yes | Yes | Yes | Yes |
R-squared | .034 | .041 | .237 | .391 | .399 |
Observations | 813,396 | 813,396 | 813,396 | 813,396 | 813,396 |
Notes: (1) Not controlling for union in models 1–4. † Significant at p < .10. Note: Weighted sample of workers who worked at least 35 hours per week and were at least 21 years old. Imputed data are excluded. The dependent variable is the logarithm of weekly earnings. The demographic vector includes controls for age (as a quadratic), marital status, gender, race, and ethnicity. The education vector includes five education-level dummy variables (master's degree or higher, bachelor's degree, some college, high school, and less than high school). Standard errors are in parentheses. Source: Authors' analysis of CPS data, 1996–2012. | |||||
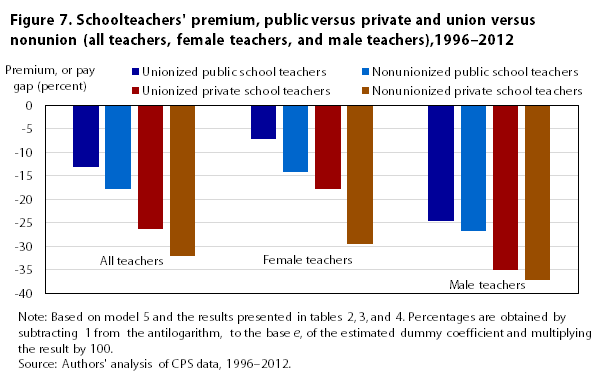
Because, as mentioned, women are the lion’s share of teachers in both sectors, one might think that the separate results for the sample of female teachers would mirror the pooled results. However, in all four cases—public school teachers, private school teachers, union-affiliated teachers, and nonunion teachers—the pay gaps for women are less than that for the pooled sample—meaning that the pay gaps for men are much greater than that for the overall sample. Figure 7 summarizes the results of the set of regressions based on model 5 for the total sample and by gender. The relative pay gaps reported in table 4 for male teachers are all much larger than those for female teachers, and the differences, by sector, between union and nonunion teachers are not nearly as stark. For female public sector teachers, the pay gaps with female nonteacher workers are –7.2 percent for union workers and –14.2 percent for nonunion workers; for the male sample of public sector teachers, the corresponding pay gaps with male nonteacher workers are –24.6 percent and –26.8 percent.
For female private sector teachers, the pay gaps are –17.8 percent for union workers and –29.5 percent for nonunion workers; the analogous figures for male private sector teachers are –35.0 percent for union workers and –37.2 percent for nonunion workers. The large pay gaps faced by male teachers are, at least in part, why the share of teachers by gender has not changed much in decades.
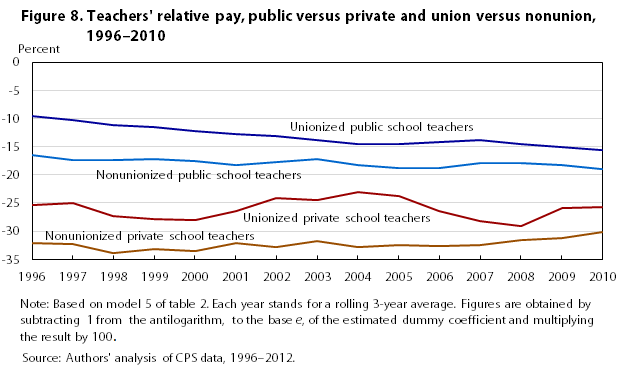
The preceding section on pooled data from 1996 through 2012 and by gender provided single point estimates for analyzing relative teacher pay over that period. In this section, we turn to documenting the teacher pay gaps over time to determine how they have been trending. To do so, we utilize the results obtained from model 5, as shown in in tables 2, 3, and 4, and we run the analysis on 3 successive years of pooled data so that we have large enough sample sizes, particularly for male teachers in the private sector. Otherwise, we used data years 1996, 1997, and 1998 to estimate the pay differential for 1996; data years 1997, 1998, and 1999 to estimate the pay differential for 1997; and so forth.
Figure 8 presents trends for the four teacher groups, and the pay gaps are reported in percentage terms from model 5. Generally, teachers in the public sector fared better than those in the private sector. Conditional on the sector, unionized teachers’ pay was higher than that of teachers not covered by a union contract. Keep in mind that, for our repeated cross-sectional sample (pooling all years), 84.5 percent of teachers are employed in the public sector and have a unionization rate of 65.1 percent; conversely, 15.5 percent of teachers are in the private sector, and relatively few of those (27.9 percent) are unionized. Although this rate of unionization among private sector teachers is far below that of public sector teachers, it is far above that of private sector nonteacher workers, who have a 9.0-percent unionization rate.
Figure 8 shows that the overall pay differential for unionized public sector teachers went from –9.5 percent to –15.6 percent; however, compared with the wage differentials for the other three groups, this one was still the smallest gap across the timeframe. The largest pay gap in 2010 was for nonunionized teachers in the private sector: –30.2 percent, about the same as the –32.0 percent in 1996. Over time, the differential between the four groups has narrowed.
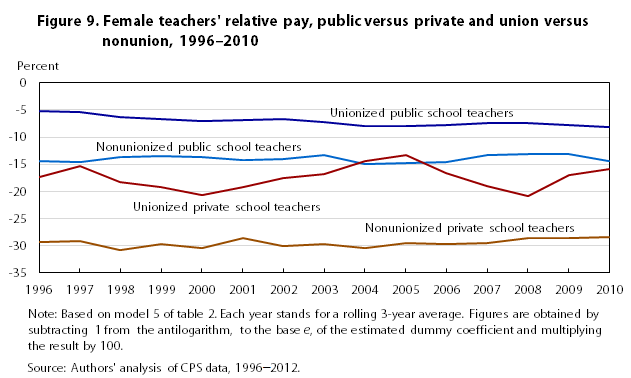
The trends for female teachers are illustrated in figure 9 for the four teacher groups. The relative pay gap for unionized public sector female teachers is less than the gap for the other three cohorts, although it worsened from –5.2 percent to –8.1 percent over the period of study. The largest relative pay gap was for nonunionized private sector female teachers, –28.4 percent, a percentage that was relatively flat over the timeframe examined. (The gap was –29.5 percent in 1996.) The two middle groups—nonunionized public sector female teachers and unionized private sector female teachers—had similar outcomes over the
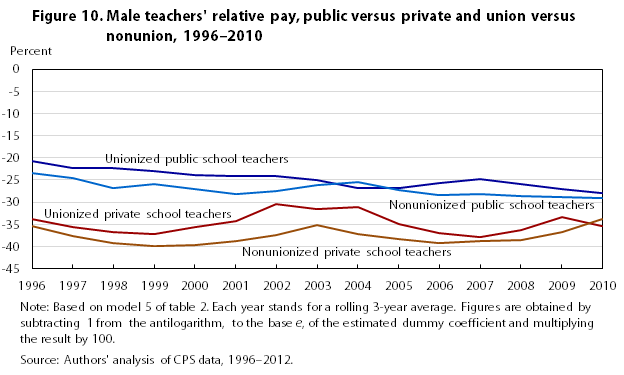
The pay gaps are much larger for all four cohorts of male teachers for all years studied, as shown in figure 10. The negative pay gap for unionized public sector male teachers grew from –20.8 percent in
Much debate has surrounded school choice and the privatization of schools. Given that teachers are an integral part of student learning and achievement, an examination of teacher pay by type of ownership is important. This article has examined how teacher pay compares with that of other professionals and how pay differs for teachers working in the public versus the private sector. In general, teachers earn less than other comparable college graduates, but the difference is mitigated if they are employed in the public sector—and more so if they have union representation as well. The mitigating effects are stronger for female than male teachers, so the within-gender pay gaps are much larger for male teachers. Public sector teachers generally receive better pay than private sector teachers, even when the former are not unionized. The reason may be a spillover effect: nonunionized teachers in the public sector gain some of the benefits afforded unionized public sector teachers by contracts negotiated under collective bargaining. This effect may also be at work, though to a lesser degree, for teachers in the private sector (a topic for future discussion).
The opportunity cost of becoming a teacher and remaining in the profession becomes more and more important as relative teacher pay falls further behind that of other professions. The large negative pay gap for male teachers most likely is a factor in why the gender mix of teachers has not changed much over time. That women, once a somewhat captive labor pool for the teaching profession, have many more opportunities outside the profession today than in the past means that growing pay differentials will make it all the more difficult to recruit and retain teachers. The movement toward private schools and charter schools, which do not have the union density of public schools, is also problematic, given the larger pay differentials across types of ownership.
Sylvia A. Allegretto and Ilan Tojerow, "Teacher staffing and pay differences: public and private schools," Monthly Labor Review, U.S. Bureau of Labor Statistics, September 2014, https://doi.org/10.21916/mlr.2014.33
1 Digest of education statistics (National Center for Education Statistics, 2010), Table 76, http://nces.ed.gov/programs/digest/d12/tables/dt12_076.asp.
2 See Andrew G. Biggs and Jason Richwine, Assessing the compensation of public-school teachers (Washington, DC: The Heritage Center for Data Analysis, November 1, 2011); and Sylvia A. Allegretto, Sean P. Corcoran, and Lawrence Mishel, How does teacher pay compare? Methodological challenges and answers (Washington, DC: Economic Policy Institute, 2004). Chapter 3 of the latter publication uses the National Compensation Survey (NCS) to identify 16 occupations similar to teaching on the basis of occupational leveling factors that measure skills and job tasks. Michael Podgursky and Ruttaya Tongrut, “(Mis-)measuring the relative pay of public school teachers,” Education Finance and Policy, Fall 2006, pp. 425–440, argue against employing household surveys, such as the Current Population Survey (CPS), in favor of using data from firms, such as data collected by the NCS, or state administrative data. Michael Podgursky, “Fringe benefits,” Education Next, Summer 2003, pp. 71–76, argues that professions chosen as alternatives to public sector teaching should be carefully considered. He suggests that journalists, registered nurses, and military officers are appropriate comparisons, along with private school teachers.
3 Biggs and Richwine, Assessing the compensation, argue that public sector teachers are overpaid compared with both private sector teachers and the private sector in general. See also Allegretto, Corcoran, and Mishel, How does teacher pay compare? in which the analysis included public and private school teachers without distinction; and Podgursky and Tongrut, “(Mis-)measuring the relative pay,” in which table 1 estimates separate public and private school teacher pay gaps that are similar to the teacher pay gaps we report here. However, Podgursky and Tongrut reject these pay gap estimates resulting from the use of CPS data, preferring NCS data (on firms) to CPS data (on households).
4 See Sylvia A. Allegretto, Sean P. Corcoran, and Lawrence Mishel, The teaching penalty: teacher pay losing ground (Washington, DC: Economic Policy Institute, 2008). Using U.S. Census Bureau data, these authors show that the pay gap between female public school teachers and comparably educated women—for whom the labor market dramatically changed over the 1960–2000 period—grew by nearly 28 percentage points, from a relative wage advantage of 14.7 percent in 1960 to a disadvantage of 13.2 percent in 2000. Among all public school teachers, the relative wage disadvantage grew almost 20 percentage points over the same period.
5 As mentioned earlier, Biggs and Richwine, Assessing the compensation, argue that public sector teachers are overpaid compared with both private sector teachers and the private sector in general. (See, however, Podgursky and Tongrut, “(Mis-)measuring the relative pay,” for the view that public sector teachers are not overpaid.)
6 Allegretto, Corcoran, and Mishel, The teaching penalty, especially endnote 1; and Allegretto, Corcoran, and Mishel, How does teacher pay compare? For a different view, see Podgursky and Tongrut, “(Mis-)-measuring the relative pay.”
7 Allegretto, Corcoran, and Mishel, The teaching penalty.
8 Sean P. Corcoran, William N. Evans, and Robert M Schwab, “Women, the labor market, and the declining relative quality of teachers,” Journal of Policy Analysis and Management, Summer 2004, pp. 449–470.
9 For a discussion of the union premium, see David Card, Thomas Lemieux, and W. Craig Riddel, “Unions and wage inequality,” Journal of Labor Research. vol. 25, no. 4, 2004, pp. 519–562. For the gender pay gap, see Francine D. Blau and Lawrence M. Kahn, “Gender differences in pay,” Journal of Economic Perspectives. Fall 2000, pp. 75–99. For an overview of the racial pay gap, see Roland G. Fryer, “Racial inequality in the 21st century: the declining significance of discrimination," in David Card and Orley Ashenfelter, eds., Handbook of labor economics, vol. 4, part B (pp. 855–971) (Amsterdam: Elsevier, 2011).
10 The research is based on nonimputed earnings data from 1996 on. (Nonimputed data for 1994–1995 are not available.) For more details, see Allegretto, Corcoran, and Mishel, How does teacher pay compare? p. 9; and Barry T. Hirsh and Edward J. Schumacher, “Match bias in wage gap estimates due to earnings imputation,” Journal of Labor Economics, vol. 22, no. 3, 2004. Separate regressions were run including and excluding imputed data, and the results were found not to change either significantly or qualitatively.
11 For more on imputation see Allegretto, Corcoran, and Mishel, How does teacher pay compare? endnote 4.
12 Three-year averages are used to increase the sample size. The racial and ethnic variables are jointly used to construct non-Hispanic White, Black, and “other” groups, the last of which comprises Asians and all other racial and ethnic groups sans Whites, Blacks, and Hispanics.
13 The Black share of public sector workers declined from 15 percent in 1996 to 13 percent in 2012.
14 Hispanic is classified as an ethnicity; Hispanics may be of any race. People in the race categories in this table (White, Black, and other) all are non-Hispanic.
15 States within the nine Census divisions are as follows: 1. New England: Connecticut, Maine, Massachusetts, New Hampshire, Rhode Island, Vermont. 2. Middle Atlantic: New Jersey, New York, Pennsylvania. 3. East North Central: Indiana, Illinois, Michigan, Ohio, Wisconsin. 4. West North Central: Iowa, Kansas, Minnesota, Missouri, Nebraska, North Dakota, South Dakota. 5. South Atlantic: Delaware, District of Columbia, Florida, Georgia, Maryland, North Carolina, South Carolina, Virginia, West Virginia. 6. East South Central: Alabama, Kentucky, Mississippi, Tennessee. 7. West South Central: Arkansas, Louisiana, Oklahoma, Texas. 8. Mountain: Arizona, Colorado, Idaho, Montana, Nevada, New Mexico, Utah, Wyoming. 9. Pacific: Alaska, California, Hawaii, Oregon, Washington.
16 Education at a glance 2012: OECD indicators (Paris: OECD Publishing, 2012).
17 By using the natural logarithm of the wage, we can directly capture the percent change for each independent variable and a log transformation makes the positively skewed wage distribution more normal.
18 Individual characteristics include controls for gender, race or ethnicity, age quadratic, educational attainment, and marital status. A specification also was used that interacted state and year effects, but the results are not qualitatively different from those reported. Regressions are not shown but are available upon request.
19 Weekly earnings are usual weekly earnings for those not paid by the hour and hourly wages times usual hours for those who are paid hourly.
20 Allegretto, Corcoran, and Mishel, How does teacher pay compare? and The teaching penalty. (See also Podgursky and Tongrut, “(Mis-)measuring the relative pay.”)
21 Allegretto, Corcoran, and Mishel, The teaching penalty.
22 As a test of the robustness of our results, we also estimated the same models separately for public and private elementary and middle school teachers, on the one hand, and public and private secondary school teachers, on the other. The main results are qualitatively similar; all results are available from the authors upon request.
23 The 1.9-percent and 13.0-percent figures are obtained from table 2 by taking the antilogarithm, to the base e, of the estimated dummy coefficient, subtracting 1, and multiplying the result by 100.