Department of Labor Logo United States Department of Labor
Dot gov

The .gov means it's official.
Federal government websites often end in .gov or .mil. Before sharing sensitive information, make sure you're on a federal government site.

Https

The site is secure.
The https:// ensures that you are connecting to the official website and that any information you provide is encrypted and transmitted securely.

Article
May 2014

Measuring the distribution of wages in the United States from 1996 through 2010 using the Occupational Employment Survey

The microdata collected by the Occupational Employment Statistics (OES) program provide a unique opportunity to study wage inequality in the United States using employer-provided survey data. These data contain information on establishment characteristics as well as on wages and occupations for the millions of employees who work in the 400,000 establishments surveyed each year. Using these data, we replicate many of the wage variance trends that other authors have found using data from the Current Population Survey (CPS) of households. We show that most of the growth in wage inequality during the 1996–2009 period occurred within the private sector, within particular industry groups such as professional and business services, and within occupational groups such as healthcare occupations. Industry and particularly occupation explain more of overall wage variation in the (employer-reported) OES than in the (employee-reported) CPS. The amount of wage variance explained by occupation is also growing more quickly in the OES than in the CPS. In an examination not possible with the CPS data, we find that within the private sector, wage differences among establishments explain far more of the level and the trend of wage variance than do wage differences among occupations.

By nearly every measure, the distribution of wages in the United States has been growing more unequal since the late 1970s.1 In this article, we show how data from the Occupational Employment Statistics (OES) survey can be used to measure the changing distribution of wages in the United States since the late 1990s, and we describe aspects of this changing distribution of wages that the OES data are uniquely well suited to describe.

There is an enormous literature devoted to understanding the nature and sources of growing wage inequality. Much of this literature relies on data on the wages and characteristics of individual workers from the Current Population Survey (CPS). For example, many studies have examined the changing composition of the workforce and changing returns to education and experience2 and the growing dispersion of wages among the most educated and experienced workers.3 Growing inequality has been attributed to the differential impact of technology on differing portions of the worker skill distribution,4 to the differential ‘offshorability’ of occupational tasks,5 to changing labor market institutions such as declining unionization levels,6 to the declining real value of the minimum wage,7 and to the growing fraction of workers subject to performance-based pay from their employers.8 Although these explanations for growing inequality are concerned with the policies and incentives faced by employers, the CPS data used in this literature contain little if any information on the businesses employing these workers.

Other researchers have studied wage inequality using data collected from employers. These studies have built on evidence that establishments play an important role in determining individual wages.9 Several authors have used employer microdata to study growing earnings variance in the United States from the mid-1970s to the early 2000s, and have found that the increasing variance is due more to variation between establishments than to variation within establishments.10 However, the employer-provided data used in this literature have limited information on the characteristics of workers in each establishment.

This disconnect between wage inequality studies based on individual worker microdata versus studies based on employer-provided microdata can be bridged with data from the Occupational Employment Statistics program. The OES data are unique in containing information on establishment characteristics as well as information on wages and occupations for all employees within surveyed establishments. Our analysis of the occupational data in the OES complements a small yet growing literature that analyzes the relationship between occupations and increasing wage inequality.11

The OES data are collected from a large semiannual survey of establishments. These data allow us to use a single source of wage information as we decompose increasing wage inequality in the United States into its within- and between-occupation components and into its within- and between-establishment components. However, the OES was not designed to study the time series of wage inequality (or any other time series12), and as such, we describe the adjustments we have made to the confidential OES microdata that are necessary for analyzing wage variance trends.

Using the OES data, we replicate many of the wage variance trends that other authors have found using the CPS data. We show that most of the growth in wage inequality for the period of our study has occurred within the private sector, within particular industry groups such as professional and business services, and within occupational groups such as healthcare. We show that occupations explain a growing fraction of all wage variance, and, in an examination not possible with the CPS data, we find that within the private sector, wage differences among establishments explain far more of the level and the trend of wage variance than do wage differences among occupations.

Using the OES data to make comparisons over time

The Occupational Employment Statistics survey is designed to measure occupational employment and wages in the United States by geography and industry and is the only such survey of its size and scope. Since 1997, the OES has covered all workers in the United States except for agricultural workers, private household workers, and unincorporated self-employed workers without employees. Every year, approximately 400,000 private and local government establishments are asked to report the number of employees in each occupation within specific wage intervals. At the same time, complete employment data are obtained from the federal and state governments.13 An example of a portion of a survey form is given in the following exhibit.

For large establishments, the survey form lists 50 to 225 detailed occupations (occupations preprinted on the survey form are selected based on the industry and the size of the establishment). Small establishments receive a blank survey form and write in descriptions of the work done by their employees. These employer-provided descriptions are coded into occupations by staff in state labor agencies (as part of the OES federalstate partnership). Wage intervals on the OES survey form are given in both hourly and annual nominal dollars.14 To calculate average wages, the OES program obtains the mean of each wage interval every year from the National Compensation Survey (NCS). These mean wages are then assigned to all employees in that wage interval.15 Approximately 25 percent of jobs in the OES data are imputed (with an establishment nonresponse rate of approximately 20 percent).

The OES program underwent a large number of improvements between 1996 and 2002, many affecting the comparability of data over time. The first year of a truly national OES survey was 1996, when wage data were collected from 400,000 establishments in every industry and every state. In 1997, the program began including establishments with less than 5 employees in the sample. Improvements to the sampling and weighting methodologies took place in 1998. In 1999, changes in the width of the wage intervals were instituted, making them more uniform in natural logarithm (wage) terms, as well as the addition of a 12th wage category. Nominal wage intervals printed on the form were shifted again in 2005 and 2009. In addition, 1999 was the first year that the occupations used in the OES were those of the Standard Occupational Classification system. The year 2001 was the last in which data were collected in October, November, and December; beginning with November 2002, data have been collected from 200,000 establishments each November and 200,000 establishments each May. The 2002 sample was the first designed using the North American Industry Classification System (NAICS) in place of the older Standard Industrial Classification (SIC) system. Each of these survey changes is designed to improve the quality of OES data but has the downside of creating difficulty in comparing estimates from year to year.

The OES survey is not designed to produce time-series statistics. To reduce variance and include data in each estimate from large employers that are surveyed only once each 3 years, published estimates from the OES program are based on the previous 3 years of data. Over each 3-year survey cycle, large establishments are sampled with certainty, and no establishment is sampled more than once. Before any of the estimates described in this paper were made, much preparatory work was devoted to the creation of appropriate weights in order to have the OES data in each individual panel be self-representing. Using the methodology described in the 2009 chapter entitled “Are the new jobs good jobs?”16 we reweight the data to November (or May) benchmarks of total employment by detailed industry and by broad industry and establishment-size groups from the Quarterly Census of Employment and Wages (QCEW). This reweighting forces the establishments in each separate panel to match the overall distribution of establishments during that November (or May), by detailed industries and by size groups within broad industries. This reweighting performs well for national-level estimates for broad categories of industries and occupations but would be inappropriate to use for more detailed levels of geography, industry, or occupation.17

We have assembled OES microdata for the private sector from fall 1996 through May 2010 and for both the private and government sectors from fall 1998 through May 2010.18 After making the adjustments to weights described above, we create time series using each survey date.

Comparing OES data to CPS data

Because OES data have never before been used to study national wage inequality trends in this way,19 we show how measures of inequality derived from OES data compare with more familiar measures derived from the CPS. Our preparation of CPS microdata follows the methodology of Thomas Lemieux.20 Although the CPS-based literature on wage inequality uses several measures of wage inequality, including the gaps in wages between the 90th, 50th, and 10th percentiles of the wage distribution as well as the overall variance of wages, we examine only the variance of wages. This is because the OES data are collected in intervals (as described below), so we cannot calculate exact percentiles of the OES wage distribution without making assumptions about the distribution of wages within each interval.21

Following Lemieux, we use the CPS Outgoing Rotation Group (ORG) samples. In the CPS data, we define hourly wages as the reported hourly wage for those who are paid by the hour (approximately two-thirds of employed people), and as the ratio of usual weekly earnings divided by usual weekly hours for those not paid hourly. We use Lemieux’s imputation of usual hours for those who report that their usual hours vary. We multiply both hourly and weekly topcoded earnings by 1.4. For this project, we trim all hourly earnings in the CPS by dropping earnings for those reporting real hourly earnings less than $1 or greater than $100 (in constant November 2007 dollars). We also drop all imputed wage observations. Trimming the very few outliers in the hourly wage distribution has a very substantial effect on the time series of variance. Removing imputations slightly raises the variance in any given year, but the time trends of the variance of trimmed wages are similar whether imputed values are or are not included in the data. To be consistent with the manner in which wages are treated in the OES, we raise all subminimum hourly wages to state-specific minimum wage levels. This reduces the overall variance of wages in the CPS with little impact on the time trend of the variance in wage levels.

There are two important differences between the scope of OES and CPS earnings data that we are unable to control for. First, CPS earnings data are based on an individual’s main job (individuals with multiple jobs are only asked about their earnings on their main job), whereas the OES earnings data are recorded for all jobs. Second, earnings questions in the CPS are not asked of the self-employed (either incorporated or unincorporated), while the OES does include wages for the incorporated self-employed.

The measurement of wages is very different in the CPS and OES. The CPS collects wage information in exact dollars and cents, while the OES survey collects wage information in discrete wage intervals (11 wage intervals for 19961998, and 12 intervals thereafter). To address the importance of this difference, we assign each observation in the CPS microdata to the OES wage interval in which that wage falls. Figure 1 shows the overall distribution of employment in the OES and the CPS by these wage intervals, dropping observations with imputed wages, for the fall of each calendar year.22 For example, looking at the third panel in figure 1 titled “Fall 1998 all sectors,” we see that roughly 18 percent of jobs in both the CPS and the OES data are in the first wage interval, about 14 percent of jobs in both datasets are in the second wage interval, and so forth.

In 1998 and in every subsequent year, the distribution of employment by wage interval is quite similar between the OES and the CPS data. However, the distributions in 1996 and 1997 are markedly different in the first two intervals, although the distributions are essentially the same for all other intervals. We have no simple explanation for this discrepancy.23 Because the distributions of wages between the CPS and the OES are so different for 1996 and 1997, we do not use these years in our analysis of the distribution of wages. The remainder of this paper shows results based on data beginning in 1998, when the distribution of employment by wage interval is quite similar between the OES and the CPS data.

There are other notable features of the wage distributions in figure 1. First, the changes in nominal wage intervals that took place in 1999, 2005, and 2009 are evident in the figure. The intervals of various widths (in log terms) in 19961998 were replaced with intervals of approximately equal width (in log terms) in 1999. In 2005 and 2009, the endpoints of all the intervals were shifted slightly to keep pace with nominal wage growth. For example, in 19992004, there were six intervals for workers earning less than $20 per hour, but beginning in 2005, there were only five such intervals. Second, the interaction between these nominal wage intervals and inflation changes the shape of the distribution of “intervalized” wages (that is, wages expressed in discrete wage intervals) from period to period: the nominal wage distribution shifts to the right between years when the nominal wage intervals are unchanging but nominal wage inflation takes place.

In figures 2 and 3, we show overall employment and mean wage levels in the CPS and OES (observations with imputed wages are included in employment totals, and observations from the incorporated self-employed are included in employment totals for the CPS even though no wage data are collected). The CPS data in figures 2 and 3 are monthly data, not seasonally adjusted. The OES data in these figures are from each data collection panel (the Oct/Nov/Dec surveys in 19982001, and each May and November survey in 20022010). All wage data are adjusted for inflation. The employment and mean wage series have similar trends in the two data sources, although the OES data show higher mean wages, particularly when imputed responses are included. This may be because establishments paying higher wages are more likely to respond to the survey, or because nonrespondents in smaller areas, which tend to have lower wages, are less likely to be imputed with respondents in the same area, and may have their wage structure imputed from respondents in other, higher wage areas.

Comparisons of variance trends in the CPS and OES data

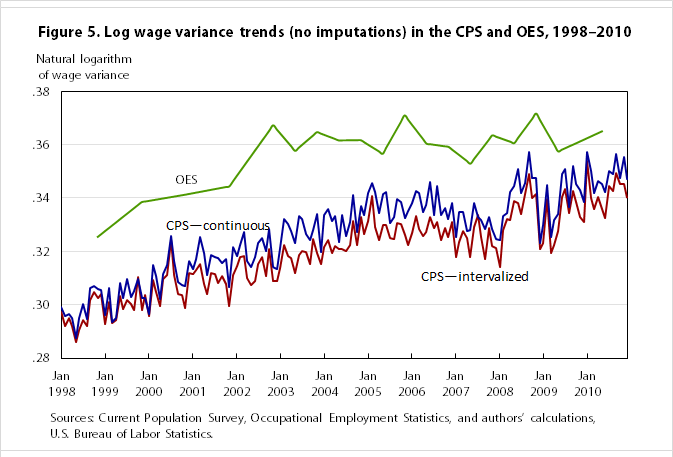
The interval-based collection of wage data in the OES will tend to reduce the variance of wages calculated from the OES data relative to that calculated from CPS data. However, as explained above, each wage observation in the CPS can be assigned to a wage interval like those used in the OES, and each wage observation in the CPS can be assigned an intervalized wage corresponding to the mean wage for all CPS observations in the same interval at the same date. Thus, we can calculate the variance of wages in the CPS for both the “continuous” and the intervalized data. A time series for both these versions of the variance of ln(wage) from the CPS, as well as the variance of ln(wage) in the OES, is shown in figures 4 and 5.24 As in figures 2 and 3 (and in all successive figures), the CPS data in figures 4 and 5 are monthly, and the OES data are from each survey panel. Although variance levels in the CPS are slightly lower when wages are intervalized, the time-series properties of these series are very similar. Both versions of ln(wage) variances are lower in the CPS than in the OES, although time trends from both datasets are similar. More curiously, dropping the imputed wage values has different impacts on measured wage variance trends in the CPS and the OES: dropping the imputed wages slightly increases wage variance in the CPS, but decreases wage variance in the OES.

We can also compare ln(wage) variance trends in the CPS and OES within sectors, industries, and occupations. Sector is defined as private industry, federal government, state government, and local government. Variance trends in the CPS and OES—dropping imputed values from both datasets—are shown by sector in figure 6, by industry in figure 7, and by occupation in figure 8.

In figure 6, we show the trends in ln(wage) variances by sector. Although the OES and CPS show similar patterns of ln(wage) variance by sector and over time, the higher wage variance in the OES data than in the CPS data is driven by the wage variance within the private sector. For federal government workers, ln(wage) variance is higher in the CPS than the OES. Also of interest in figure 6 is that both data sources show that wage variance has increased over time in the federal government sector and in the private sector, but not in the state and local government sectors.

Select a sector to chart:


CPS data -- "Intervalized" wage variance, no imputations
DateFederal governmentState governmentsLocal governmentsPrivate Sector

Jan 1998

0.1900.2700.2620.296

Feb 1998

0.2280.2660.2460.290

Mar 1998

0.2010.2550.2510.294

Apr 1998

0.2200.2450.2490.294

May 1998

0.1770.2300.2600.285

Jun 1998

0.1890.2700.2520.289

Jul 1998

0.2030.2680.2660.294

Aug 1998

0.1970.2550.2560.290

Sep 1998

0.2360.2640.2650.301

Oct 1998

0.1970.2790.2590.306

Nov 1998

0.2200.2970.2610.299

Dec 1998

0.2340.2520.2590.302

Jan 1999

0.2040.2740.2720.289

Feb 1999

0.2220.2940.2590.300

Mar 1999

0.2090.2380.2690.291

Apr 1999

0.2040.2470.2250.297

May 1999

0.2420.2720.2450.304

Jun 1999

0.2290.2400.2740.299

Jul 1999

0.2390.2660.2650.304

Aug 1999

0.2010.3050.2450.297

Sep 1999

0.2200.2460.2480.303

Oct 1999

0.2120.2600.2390.310

Nov 1999

0.2000.2600.2480.299

Dec 1999

0.2280.2600.2580.297

Jan 2000

0.2370.2790.2520.290

Feb 2000

0.1740.2840.2500.314

Mar 2000

0.1930.2800.2600.310

Apr 2000

0.2530.2530.2410.301

May 2000

0.2020.2570.2590.309

Jun 2000

0.2080.2720.2470.313

Jul 2000

0.2540.2700.2990.321

Aug 2000

0.2220.2720.2510.313

Sep 2000

0.1980.2630.2510.306

Oct 2000

0.2330.2570.2370.305

Nov 2000

0.2030.2800.2210.306

Dec 2000

0.2070.2620.2560.317

Jan 2001

0.1920.2540.2460.316

Feb 2001

0.2460.2690.2470.318

Mar 2001

0.2030.2970.2520.326

Apr 2001

0.2140.2450.2660.320

May 2001

0.1930.2510.2400.309

Jun 2001

0.2240.2540.2760.315

Jul 2001

0.2700.2750.2630.317

Aug 2001

0.2340.2660.2390.319

Sep 2001

0.2700.2690.2460.314

Oct 2001

0.2470.2660.2470.316

Nov 2001

0.2310.2510.2480.306

Dec 2001

0.2590.2300.2320.326

Jan 2002

0.2200.2410.2580.319

Feb 2002

0.2460.2630.2610.321

Mar 2002

0.2860.2570.2400.331

Apr 2002

0.2460.2890.2490.314

May 2002

0.2380.2690.2460.312

Jun 2002

0.2540.2810.2800.310

Jul 2002

0.2120.2490.2530.323

Aug 2002

0.2320.2590.2600.324

Sep 2002

0.2410.2820.2680.319

Oct 2002

0.2050.2790.2370.330

Nov 2002

0.2450.2760.2280.317

Dec 2002

0.2580.2790.2450.311

Jan 2003

0.2600.2780.2560.319

Feb 2003

0.2040.2850.2680.333

Mar 2003

0.2560.2890.2440.330

Apr 2003

0.2270.2810.2560.328

May 2003

0.2590.2970.2640.320

Jun 2003

0.2250.2610.2830.331

Jul 2003

0.2260.2830.2700.331

Aug 2003

0.2660.2410.2730.324

Sep 2003

0.2790.2640.2350.327

Oct 2003

0.2520.2850.2360.330

Nov 2003

0.2640.2760.2540.333

Dec 2003

0.2370.2420.2770.317

Jan 2004

0.2940.2590.2740.332

Feb 2004

0.2380.2690.2500.339

Mar 2004

0.2610.2580.2660.330

Apr 2004

0.2600.2720.2650.332

May 2004

0.2370.2630.2590.318

Jun 2004

0.2600.2300.2560.335

Jul 2004

0.2500.2680.2520.325

Aug 2004

0.3000.2770.2820.325

Sep 2004

0.2450.2560.2430.344

Oct 2004

0.2630.2660.2530.325

Nov 2004

0.2570.2660.2580.336

Dec 2004

0.2570.2920.2490.335

Jan 2005

0.3190.2730.2770.341

Feb 2005

0.2440.2740.2620.349

Mar 2005

0.2280.2970.2780.339

Apr 2005

0.2400.2340.2350.339

May 2005

0.2800.2750.2460.344

Jun 2005

0.2410.2450.2660.345

Jul 2005

0.2560.2400.2720.327

Aug 2005

0.2670.2960.2510.328

Sep 2005

0.2470.2910.2320.341

Oct 2005

0.2310.2840.2430.340

Nov 2005

0.2790.2820.2750.327

Dec 2005

0.2510.2810.2500.334

Jan 2006

0.2460.2880.2630.336

Feb 2006

0.2260.2800.2460.345

Mar 2006

0.2260.2780.2530.342

Apr 2006

0.2600.2290.2440.338

May 2006

0.2530.2570.2550.338

Jun 2006

0.2080.2600.2800.344

Jul 2006

0.2560.2660.2590.330

Aug 2006

0.2550.2820.2760.342

Sep 2006

0.3140.2910.2180.334

Oct 2006

0.2410.2450.2500.336

Nov 2006

0.1990.2680.2610.331

Dec 2006

0.2440.2550.2530.338

Jan 2007

0.2720.2540.2470.326

Feb 2007

0.3250.2750.2630.332

Mar 2007

0.2140.2380.2270.339

Apr 2007

0.2430.2900.2350.330

May 2007

0.2590.2680.2390.329

Jun 2007

0.2550.2350.2640.339

Jul 2007

0.2690.2980.2560.328

Aug 2007

0.2340.2810.2450.331

Sep 2007

0.2870.2840.2560.327

Oct 2007

0.2330.2680.2580.333

Nov 2007

0.1960.2560.2690.327

Dec 2007

0.2170.2680.2590.324

Jan 2008

0.2360.2650.2400.327

Feb 2008

0.2570.2560.2650.335

Mar 2008

0.2580.2370.2640.338

Apr 2008

0.2460.2860.2450.347

May 2008

0.2440.2780.2490.349

Jun 2008

0.2850.2440.2420.359

Jul 2008

0.2470.2880.2420.340

Aug 2008

0.2360.2840.2630.343

Sep 2008

0.2510.2830.2790.357

Oct 2008

0.2950.2640.2570.349

Nov 2008

0.2200.2750.2830.348

Dec 2008

0.2900.2370.2490.323

Jan 2009

0.2560.2860.2280.333

Feb 2009

0.2620.2520.2770.347

Mar 2009

0.2830.2500.2310.327

Apr 2009

0.2370.2920.2240.337

May 2009

0.2220.2740.2270.339

Jun 2009

0.2610.3010.2730.349

Jul 2009

0.2420.2800.2580.354

Aug 2009

0.2890.2540.2670.334

Sep 2009

0.2360.2560.2620.356

Oct 2009

0.2290.2580.2490.351

Nov 2009

0.2320.2800.2330.351

Dec 2009

0.2700.2660.2660.339

Jan 2010

0.2770.2550.2510.360

Feb 2010

0.2980.2580.2730.352

Mar 2010

0.2670.2700.2650.341

Apr 2010

0.2570.2670.2440.354

May 2010

0.2940.2980.2480.345

Jun 2010

0.2960.2530.2620.344

Jul 2010

0.3420.2810.2630.349

Aug 2010

0.3200.2740.2360.348

Sep 2010

0.2600.2630.2620.360

Oct 2010

0.2290.2900.2250.353

Nov 2010

0.2460.2660.2330.359

Dec 2010

0.2970.2740.2800.341
CPS data -- "reported wage" variance, no imputations
DateFederal governmentState governmentsLocal governmentsPrivate Sector

Jan 1998

0.1980.2720.2690.299

Feb 1998

0.2400.2710.2410.295

Mar 1998

0.2110.2530.2490.299

Apr 1998

0.2190.2500.2420.300

May 1998

0.1790.2290.2650.289

Jun 1998

0.1920.2760.2550.294

Jul 1998

0.2130.2650.2680.299

Aug 1998

0.2090.2600.2540.294

Sep 1998

0.2450.2630.2690.305

Oct 1998

0.2040.2720.2580.312

Nov 1998

0.2250.2940.2620.304

Dec 1998

0.2400.2460.2540.307

Jan 1999

0.2020.2720.2720.295

Feb 1999

0.2230.2910.2630.305

Mar 1999

0.2240.2380.2690.296

Apr 1999

0.2170.2500.2310.301

May 1999

0.2410.2810.2500.308

Jun 1999

0.2350.2470.2780.304

Jul 1999

0.2350.2700.2680.309

Aug 1999

0.2050.3170.2460.302

Sep 1999

0.2180.2540.2570.307

Oct 1999

0.2130.2600.2410.315

Nov 1999

0.2050.2610.2500.304

Dec 1999

0.2280.2670.2660.302

Jan 2000

0.2320.2870.2540.295

Feb 2000

0.1790.2840.2540.320

Mar 2000

0.1910.2840.2630.315

Apr 2000

0.2580.2630.2480.306

May 2000

0.2060.2560.2610.315

Jun 2000

0.2100.2740.2530.318

Jul 2000

0.2620.2770.2990.326

Aug 2000

0.2240.2740.2520.318

Sep 2000

0.1990.2620.2540.311

Oct 2000

0.2360.2580.2380.311

Nov 2000

0.2040.2800.2210.312

Dec 2000

0.2090.2610.2510.323

Jan 2001

0.1980.2640.2490.321

Feb 2001

0.2520.2710.2460.323

Mar 2001

0.2020.3030.2510.332

Apr 2001

0.2190.2400.2730.326

May 2001

0.1910.2500.2370.315

Jun 2001

0.2310.2600.2780.320

Jul 2001

0.2740.2830.2640.322

Aug 2001

0.2430.2680.2410.324

Sep 2001

0.2830.2780.2470.318

Oct 2001

0.2530.2660.2540.321

Nov 2001

0.2350.2540.2500.311

Dec 2001

0.2610.2310.2340.331

Jan 2002

0.2220.2360.2610.325

Feb 2002

0.2520.2650.2650.327

Mar 2002

0.2980.2610.2400.337

Apr 2002

0.2470.2850.2540.320

May 2002

0.2550.2750.2540.316

Jun 2002

0.2520.2830.2840.316

Jul 2002

0.2150.2530.2560.328

Aug 2002

0.2250.2620.2610.330

Sep 2002

0.2480.2810.2700.324

Oct 2002

0.2100.2820.2420.335

Nov 2002

0.2440.2710.2330.322

Dec 2002

0.2470.2840.2500.316

Jan 2003

0.2540.2780.2630.325

Feb 2003

0.2090.2920.2690.338

Mar 2003

0.2620.2910.2420.336

Apr 2003

0.2290.2780.2590.333

May 2003

0.2610.3010.2590.325

Jun 2003

0.2250.2680.2820.336

Jul 2003

0.2250.2790.2760.336

Aug 2003

0.2600.2480.2740.329

Sep 2003

0.2840.2660.2340.333

Oct 2003

0.2560.2810.2400.336

Nov 2003

0.2490.2750.2560.339

Dec 2003

0.2370.2420.2760.323

Jan 2004

0.3020.2580.2780.337

Feb 2004

0.2380.2680.2600.344

Mar 2004

0.2610.2560.2690.335

Apr 2004

0.2610.2760.2620.338

May 2004

0.2380.2670.2570.324

Jun 2004

0.2560.2310.2570.341

Jul 2004

0.2460.2660.2540.330

Aug 2004

0.2970.2820.2810.331

Sep 2004

0.2440.2580.2410.350

Oct 2004

0.2570.2690.2530.330

Nov 2004

0.2510.2680.2630.341

Dec 2004

0.2710.2950.2530.340

Jan 2005

0.3180.2700.2760.347

Feb 2005

0.2490.2700.2630.355

Mar 2005

0.2340.2920.2780.345

Apr 2005

0.2430.2440.2380.343

May 2005

0.2820.2900.2480.349

Jun 2005

0.2360.2410.2710.350

Jul 2005

0.2700.2450.2730.335

Aug 2005

0.2830.2940.2510.336

Sep 2005

0.2510.2880.2340.348

Oct 2005

0.2340.2860.2440.347

Nov 2005

0.2810.2810.2710.335

Dec 2005

0.2680.2800.2480.342

Jan 2006

0.2530.2920.2580.344

Feb 2006

0.2250.2920.2430.352

Mar 2006

0.2320.2800.2510.349

Apr 2006

0.2700.2300.2460.345

May 2006

0.2510.2600.2610.345

Jun 2006

0.2080.2630.2790.351

Jul 2006

0.2540.2670.2570.338

Aug 2006

0.2640.2890.2740.348

Sep 2006

0.3090.2920.2180.341

Oct 2006

0.2460.2380.2450.344

Nov 2006

0.2030.2710.2570.339

Dec 2006

0.2490.2510.2570.345

Jan 2007

0.2790.2570.2440.332

Feb 2007

0.3220.2820.2640.337

Mar 2007

0.2140.2390.2300.345

Apr 2007

0.2520.2970.2350.336

May 2007

0.2560.2690.2360.335

Jun 2007

0.2570.2330.2660.345

Jul 2007

0.2740.2990.2590.334

Aug 2007

0.2450.2820.2410.337

Sep 2007

0.2930.2860.2530.333

Oct 2007

0.2350.2750.2610.338

Nov 2007

0.1940.2610.2670.333

Dec 2007

0.2150.2690.2640.329

Jan 2008

0.2330.2620.2380.332

Feb 2008

0.2580.2600.2640.340

Mar 2008

0.2580.2400.2610.343

Apr 2008

0.2420.2850.2460.353

May 2008

0.2430.2780.2520.354

Jun 2008

0.2890.2500.2490.363

Jul 2008

0.2520.2920.2470.347

Aug 2008

0.2450.2830.2630.350

Sep 2008

0.2530.2820.2800.364

Oct 2008

0.2910.2650.2610.356

Nov 2008

0.2290.2800.2860.355

Dec 2008

0.2830.2400.2510.330

Jan 2009

0.2610.2860.2310.338

Feb 2009

0.2680.2530.2810.352

Mar 2009

0.2790.2480.2350.333

Apr 2009

0.2470.2950.2230.342

May 2009

0.2190.2720.2260.345

Jun 2009

0.2590.3020.2780.354

Jul 2009

0.2480.2770.2610.359

Aug 2009

0.2950.2570.2660.339

Sep 2009

0.2380.2610.2660.360

Oct 2009

0.2320.2600.2490.356

Nov 2009

0.2290.2810.2360.356

Dec 2009

0.2810.2700.2690.343

Jan 2010

0.2750.2630.2570.365

Feb 2010

0.2890.2540.2760.357

Mar 2010

0.2690.2710.2620.347

Apr 2010

0.2620.2680.2470.359

May 2010

0.2960.2990.2520.350

Jun 2010

0.3000.2550.2680.349

Jul 2010

0.3550.2750.2690.354

Aug 2010

0.3240.2740.2350.354

Sep 2010

0.2560.2640.2640.365

Oct 2010

0.2180.2940.2280.358

Nov 2010

0.2550.2700.2340.363

Dec 2010

0.2960.2710.2820.347
OES data -- wage variance, no imputations
DateFederal governmentState governmentsLocal governmentsPrivate Sector

Jan 1998

nullnullnullnull

Feb 1998

nullnullnullnull

Mar 1998

nullnullnullnull

Apr 1998

nullnullnullnull

May 1998

nullnullnullnull

Jun 1998

nullnullnullnull

Jul 1998

nullnullnullnull

Aug 1998

nullnullnullnull

Sep 1998

nullnullnullnull

Oct 1998

nullnullnullnull

Nov 1998

0.1550.2490.2710.332

Dec 1998

nullnullnullnull

Jan 1999

nullnullnullnull

Feb 1999

nullnullnullnull

Mar 1999

nullnullnullnull

Apr 1999

nullnullnullnull

May 1999

nullnullnullnull

Jun 1999

nullnullnullnull

Jul 1999

nullnullnullnull

Aug 1999

nullnullnullnull

Sep 1999

nullnullnullnull

Oct 1999

nullnullnullnull

Nov 1999

0.1570.2540.2580.351

Dec 1999

nullnullnullnull

Jan 2000

nullnullnullnull

Feb 2000

nullnullnullnull

Mar 2000

nullnullnullnull

Apr 2000

nullnullnullnull

May 2000

nullnullnullnull

Jun 2000

nullnullnullnull

Jul 2000

nullnullnullnull

Aug 2000

nullnullnullnull

Sep 2000

nullnullnullnull

Oct 2000

nullnullnullnull

Nov 2000

0.1590.2440.2710.352

Dec 2000

nullnullnullnull

Jan 2001

nullnullnullnull

Feb 2001

nullnullnullnull

Mar 2001

nullnullnullnull

Apr 2001

nullnullnullnull

May 2001

nullnullnullnull

Jun 2001

nullnullnullnull

Jul 2001

nullnullnullnull

Aug 2001

nullnullnullnull

Sep 2001

nullnullnullnull

Oct 2001

nullnullnullnull

Nov 2001

0.1580.2400.2660.361

Dec 2001

nullnullnullnull

Jan 2002

nullnullnullnull

Feb 2002

nullnullnullnull

Mar 2002

nullnullnullnull

Apr 2002

nullnullnullnull

May 2002

nullnullnullnull

Jun 2002

nullnullnullnull

Jul 2002

nullnullnullnull

Aug 2002

nullnullnullnull

Sep 2002

nullnullnullnull

Oct 2002

nullnullnullnull

Nov 2002

0.1680.2410.2700.387

Dec 2002

nullnullnullnull

Jan 2003

nullnullnullnull

Feb 2003

nullnullnullnull

Mar 2003

nullnullnullnull

Apr 2003

nullnullnullnull

May 2003

0.172null0.2770.373

Jun 2003

nullnullnullnull

Jul 2003

nullnullnullnull

Aug 2003

nullnullnullnull

Sep 2003

nullnullnullnull

Oct 2003

nullnullnullnull

Nov 2003

0.1660.2450.2950.375

Dec 2003

nullnullnullnull

Jan 2004

nullnullnullnull

Feb 2004

nullnullnullnull

Mar 2004

nullnullnullnull

Apr 2004

nullnullnullnull

May 2004

0.178null0.2720.378

Jun 2004

nullnullnullnull

Jul 2004

nullnullnullnull

Aug 2004

nullnullnullnull

Sep 2004

nullnullnullnull

Oct 2004

nullnullnullnull

Nov 2004

0.1730.2480.2700.379

Dec 2004

nullnullnullnull

Jan 2005

nullnullnullnull

Feb 2005

nullnullnullnull

Mar 2005

nullnullnullnull

Apr 2005

nullnullnullnull

May 2005

0.178null0.2850.373

Jun 2005

nullnullnullnull

Jul 2005

nullnullnullnull

Aug 2005

nullnullnullnull

Sep 2005

nullnullnullnull

Oct 2005

nullnullnullnull

Nov 2005

null0.2550.2790.383

Dec 2005

nullnullnullnull

Jan 2006

nullnullnullnull

Feb 2006

nullnullnullnull

Mar 2006

nullnullnullnull

Apr 2006

nullnullnullnull

May 2006

0.173null0.2810.375

Jun 2006

nullnullnullnull

Jul 2006

nullnullnullnull

Aug 2006

nullnullnullnull

Sep 2006

nullnullnullnull

Oct 2006

nullnullnullnull

Nov 2006

null0.2410.2670.378

Dec 2006

nullnullnullnull

Jan 2007

nullnullnullnull

Feb 2007

nullnullnullnull

Mar 2007

nullnullnullnull

Apr 2007

nullnullnullnull

May 2007

0.181null0.2770.369

Jun 2007

nullnullnullnull

Jul 2007

nullnullnullnull

Aug 2007

nullnullnullnull

Sep 2007

nullnullnullnull

Oct 2007

nullnullnullnull

Nov 2007

null0.2550.2770.379

Dec 2007

nullnullnullnull

Jan 2008

nullnullnullnull

Feb 2008

nullnullnullnull

Mar 2008

nullnullnullnull

Apr 2008

nullnullnullnull

May 2008

0.186null0.2920.373

Jun 2008

nullnullnullnull

Jul 2008

nullnullnullnull

Aug 2008

nullnullnullnull

Sep 2008

nullnullnullnull

Oct 2008

nullnullnullnull

Nov 2008

null0.2410.2720.385

Dec 2008

nullnullnullnull

Jan 2009

nullnullnullnull

Feb 2009

nullnullnullnull

Mar 2009

nullnullnullnull

Apr 2009

nullnullnullnull

May 2009

0.189null0.2700.375

Jun 2009

nullnullnullnull

Jul 2009

nullnullnullnull

Aug 2009

nullnullnullnull

Sep 2009

nullnullnullnull

Oct 2009

nullnullnullnull

Nov 2009

null0.2460.2690.381

Dec 2009

nullnullnullnull

Jan 2010

nullnullnullnull

Feb 2010

nullnullnullnull

Mar 2010

nullnullnullnull

Apr 2010

nullnullnullnull

May 2010

0.194null0.2820.383

Jun 2010

nullnullnullnull

Jul 2010

nullnullnullnull

Aug 2010

nullnullnullnull

Sep 2010

nullnullnullnull

Oct 2010

nullnullnullnull

Nov 2010

nullnullnullnull

Dec 2010

nullnullnullnull

Figure 7 shows these variance trends over time for 14 industry groups. These groups are not standard industry supersectors, but are instead large groupings designed for comparability between the SIC codes used in earlier years of the data and the NAICS codes used in recent years. All federal government employment is reported to the OES as “general government,” but a large portion of state and local government employment is reported in the education industry group and the health and social assistance industry group. Workers surveyed in the CPS are asked the industry and sector of their employer in separate questions. For consistency with the OES, we assign to the industry of “general government” local and state government workers in the CPS who report industries other than education or health and social assistance and also all federal government workers in the CPS.

Select an industry to chart:


CPS data -- "Intervalized" wage variance, no imputations
DateMiningRetail TradeWholesale, Transport, & UtilitiesConstructionManufacturingInformationFinance & Real EstateProfessional & Business ServicesEducationHealth & Social AssistanceArts, Entertainment, & RecreationFood & LodgingOther ServicesGeneral Government

Jan 1998

0.2510.2120.2650.2300.2510.3170.3130.3240.3000.2800.3090.1100.2260.258

Feb 1998

0.2460.1860.2600.1970.2620.2770.2900.3400.2990.2680.1860.1150.2160.259

Mar 1998

0.2230.1800.2540.2310.2510.3170.3030.3360.3270.2630.2110.1520.1980.249

Apr 1998

0.2410.1990.2730.2050.2570.2780.3140.3470.3270.2770.1550.1180.1950.251

May 1998

0.1860.2030.2600.1930.2580.2810.2820.3280.3090.2610.2160.1120.1860.247

Jun 1998

0.2750.1790.2680.2370.2600.3220.2750.3200.2350.2870.2850.1310.2210.255

Jul 1998

0.2620.2050.2570.2220.2450.2750.3270.3500.2820.2670.1560.1080.2240.261

Aug 1998

0.2340.2000.2600.2300.2580.2980.3040.3290.2650.2600.2280.0990.1750.254

Sep 1998

0.2270.2020.2790.2230.2450.3230.2870.3840.3090.2730.1220.1060.2100.265

Oct 1998

0.2850.2150.2610.2310.2720.2980.2950.3450.3470.2810.2260.1450.2380.260

Nov 1998

0.2670.2100.2640.1870.2640.2960.3070.3540.3390.2720.1930.1160.2260.273

Dec 1998

0.1690.1990.2680.2410.2560.2860.3060.3420.3140.2880.2730.1310.1720.263

Jan 1999

0.2450.1950.2580.2120.2560.2750.2970.3230.2830.2580.2040.0970.2400.268

Feb 1999

0.2580.1950.2670.1910.2690.3020.3210.3550.3240.2760.1900.1080.2290.273

Mar 1999

0.2510.2080.2600.1940.2560.2920.2960.3200.3160.2610.1950.1280.1810.258

Apr 1999

0.1930.2130.2620.2210.2580.2360.3170.3660.3120.2740.1870.1300.2120.237

May 1999

0.3910.2020.2620.1900.2700.2750.2980.3480.3110.3000.2020.1230.2450.263

Jun 1999

0.2130.2110.2450.2090.2650.2780.2930.3620.2680.2720.2160.1010.2730.265

Jul 1999

0.2730.2170.2420.2170.2540.3180.3220.3800.3490.2780.2220.1450.1960.267

Aug 1999

0.3920.2140.2540.1920.2570.2620.2810.3470.3080.2840.1720.1130.2290.265

Sep 1999

0.2240.2200.2550.2010.2590.2720.3370.3680.2990.2830.2400.1380.1930.249

Oct 1999

0.1640.2250.2660.2200.2610.3180.3290.3170.2930.2980.2610.1710.2210.248

Nov 1999

0.3160.2000.2430.2030.2780.3050.2850.3230.2960.2860.2170.1360.2140.251

Dec 1999

0.2200.1940.2480.2480.2630.2660.2690.3480.2990.2620.1590.1200.2090.264

Jan 2000

0.1930.2120.2680.1750.2650.2730.2750.3260.2660.2520.2290.1430.2180.264

Feb 2000

0.2000.2100.2830.2070.2770.2990.2980.3850.3330.2910.2390.0980.2160.260

Mar 2000

0.2280.2150.2480.2230.2630.3320.3120.3940.2980.2730.1630.1220.2070.263

Apr 2000

0.2970.2200.2580.2020.2650.2980.3010.3560.2980.2600.1690.1110.2370.255

May 2000

0.1900.2070.2470.1900.2770.3130.3360.3810.2930.2730.2160.1180.3080.256

Jun 2000

0.2300.2090.2620.2030.2680.2870.3240.3800.2960.2860.2460.1220.2400.261

Jul 2000

0.3130.2030.2970.2140.2890.2930.3460.3920.2730.2570.2150.1260.2150.288

Aug 2000

0.2040.2270.2730.2110.2610.3100.2970.3750.2570.3120.1900.1680.2430.262

Sep 2000

0.2720.2440.2430.2020.2620.3010.2950.3570.2790.2760.2080.1340.2100.254

Oct 2000

0.2210.2270.2440.2270.2890.2670.3150.3390.3200.2840.1930.1560.2330.249

Nov 2000

0.2560.1980.2570.1970.2700.3000.3010.3810.3340.2580.3580.1420.1950.242

Dec 2000

0.2660.2030.2370.2090.2740.3490.3350.4050.2780.2760.3070.1090.2480.259

Jan 2001

0.2230.2200.2380.2280.2810.2900.3240.3940.2880.2590.2420.1230.1950.246

Feb 2001

0.1470.2080.2650.2130.2770.3030.3460.3820.3270.2810.2110.1310.2330.265

Mar 2001

0.2120.2330.2840.2120.2910.3020.3340.4050.2920.2850.2890.1050.2420.267

Apr 2001

0.1790.2580.2580.2190.2660.2850.3430.3740.3340.2820.2150.1140.2740.260

May 2001

0.1910.2740.2500.2080.2790.2800.3040.3560.2630.2580.2120.1220.2220.252

Jun 2001

0.2380.2190.2650.2340.2730.2810.3340.3630.3080.2960.2170.1120.2170.273

Jul 2001

0.2620.2030.2490.2230.2710.2970.3280.3810.3260.2860.1870.1530.2460.270

Aug 2001

0.2220.2480.2550.2250.2620.3230.3050.3690.2970.2920.2700.1480.2610.253

Sep 2001

0.2280.2270.2380.2300.2770.3100.3620.3500.2990.2600.2940.1330.2070.266

Oct 2001

0.2510.2400.2590.2230.2820.2700.3020.3590.3170.3120.1730.1480.2200.258

Nov 2001

0.1650.2030.2700.2070.2660.3260.2740.3790.2800.2620.2140.1310.2200.251

Dec 2001

0.1900.2020.2810.1890.2840.3280.3260.3880.2780.2900.2490.1160.2310.244

Jan 2002

0.1190.2250.2690.2390.2480.2930.3050.4140.3680.2870.2730.1280.2370.252

Feb 2002

0.2830.2280.2410.2180.2690.3350.3250.4120.3460.2920.2260.1310.2290.270

Mar 2002

0.2850.2320.2620.2590.2860.2910.3760.3940.3400.2780.2240.1430.2430.256

Apr 2002

0.1580.2150.2430.2210.2770.2990.3550.3950.2630.2750.2440.1520.2370.270

May 2002

0.1250.2460.2610.2100.2820.2590.3430.3840.2550.2740.2480.1440.1880.261

Jun 2002

0.2100.2070.2390.2340.2830.3350.2970.3930.2570.2780.1630.1380.2190.283

Jul 2002

0.1910.2360.2880.2290.2620.3310.3120.3940.3030.2910.1940.1240.2430.256

Aug 2002

0.1980.2220.2700.2210.2800.3000.3410.3620.3280.2800.2680.1490.2350.267

Sep 2002

0.1490.2450.2620.1920.2760.3020.3580.3640.2970.2960.1700.1360.2140.273

Oct 2002

0.1360.2510.2660.2350.2710.3070.3210.4020.3270.3200.2450.1590.2620.258

Nov 2002

0.1680.2210.2570.2140.2790.3410.2980.3500.2850.2990.2360.1400.2840.250

Dec 2002

0.2120.2040.2750.1910.2470.3220.3210.3970.2800.2780.2040.1420.2330.263

Jan 2003

0.1470.2400.2790.2310.2620.2770.3290.3870.3380.2660.2550.1200.2690.267

Feb 2003

0.2400.2420.2540.2410.2800.3420.3370.3760.3620.2970.3070.1370.2840.273

Mar 2003

0.1940.2320.2760.2540.2800.3600.3360.3780.3090.2990.2730.1440.2670.269

Apr 2003

0.1650.2300.2520.2350.2790.3090.3530.3870.2850.3180.2950.1540.2380.266

May 2003

0.2020.2280.2520.2030.2780.2860.3330.3960.3050.2830.2280.1480.2490.281

Jun 2003

0.1640.2210.2590.2470.2860.3160.3140.4370.2940.2820.2630.1580.2440.279

Jul 2003

0.2180.2390.2680.2290.2710.3730.3470.3860.3120.2960.2710.1300.2600.273

Aug 2003

0.1530.2440.2580.2490.2850.3120.3140.3770.2960.2830.2520.1450.2650.279

Sep 2003

0.2450.2490.2780.1860.2830.3410.3180.3540.3560.3100.2700.1540.2490.253

Oct 2003

0.1820.2590.2680.2200.2730.3080.3350.3870.3580.3010.3260.1620.2570.263

Nov 2003

0.2400.2200.2640.2570.2860.3360.3120.3910.2940.2800.2790.1540.3170.269

Dec 2003

0.2180.2210.2510.2400.2790.3330.3470.3770.3110.2820.2130.1570.2540.270

Jan 2004

0.1580.2450.2940.2210.2990.3040.3630.3490.2940.2870.2510.1470.2490.278

Feb 2004

0.2950.2470.2900.2420.3190.3410.3060.3810.3190.3000.2360.1470.2840.262

Mar 2004

0.1600.2570.2580.2350.2660.3190.3760.3670.3380.3090.3740.1460.2760.274

Apr 2004

0.2470.2390.2570.2200.2890.3420.3100.3870.3340.3300.3340.1690.3040.273

May 2004

0.1590.2430.2520.2230.2730.3240.3360.3850.3090.2850.2940.1360.2750.269

Jun 2004

0.1380.2310.2780.2220.3120.3490.3520.4000.2610.2910.2190.1530.2640.258

Jul 2004

0.1230.2560.2770.2350.2680.3140.2960.3770.2790.3260.2400.1470.1970.267

Aug 2004

0.2120.2440.2630.2190.2820.2720.3640.3880.2710.2730.2500.1570.3070.294

Sep 2004

0.3570.2430.2800.2210.3150.3040.3690.3750.3120.3010.4950.1290.2660.253

Oct 2004

0.2620.2390.2750.2110.2560.3200.3350.3740.3560.3020.2350.1700.2590.268

Nov 2004

0.2080.2350.2730.2320.3130.3430.3320.3900.3180.3040.3420.1500.3120.272

Dec 2004

0.2470.2550.2500.2310.2720.3350.3210.3810.3700.3140.4010.1460.2420.272

Jan 2005

0.3390.2650.2620.1980.3120.2780.3490.4080.3070.3200.3150.1720.2720.287

Feb 2005

0.2360.2760.2760.2330.3180.3480.3370.4210.3210.3030.3520.1370.2590.272

Mar 2005

0.2610.2650.3100.2220.2840.3250.3020.3620.3160.3230.2190.1670.2560.294

Apr 2005

0.3740.2560.2650.2260.2840.3900.3600.3790.3460.3220.2570.1400.2420.248

May 2005

0.3190.2550.2560.2330.2960.3080.3560.4210.3340.3220.2370.1300.2980.268

Jun 2005

0.2740.2220.2660.2250.3030.3500.3280.4210.3500.3240.3330.1490.2490.265

Jul 2005

0.2770.2420.2830.1950.2990.3560.3180.3820.3280.2850.1670.1390.2610.266

Aug 2005

0.2000.2310.2630.2090.2960.3600.3500.3800.3100.2890.1850.1590.2000.274

Sep 2005

0.2490.2610.3000.2220.3120.3520.3620.4280.3160.2870.2100.1450.2840.261

Oct 2005

0.2380.2470.2720.2410.2870.3390.3440.3760.3300.3330.2350.1430.2640.265

Nov 2005

0.1870.2410.2580.2120.2960.3910.2910.3970.3380.3000.2710.1380.2430.286

Dec 2005

0.1560.2400.2660.2120.2990.2730.3640.3810.3200.3050.2280.1520.2500.269

Jan 2006

0.1330.2450.2590.1990.3000.3560.3180.3930.2910.3200.2690.1490.2290.278

Feb 2006

0.2370.2870.2690.2560.2780.3770.3480.3870.2850.3090.3480.1460.3010.267

Mar 2006

0.2740.2590.2730.2240.2910.3450.3330.3900.2810.3190.3930.1300.2500.275

Apr 2006

0.4950.2460.2420.2340.2920.3170.3510.4170.3470.3050.2490.1290.2300.254

May 2006

0.2290.2320.2450.2170.3020.4020.3480.3960.3120.3080.3000.1250.3120.266

Jun 2006

0.1520.2540.2690.2270.3170.3610.3330.3940.3340.3090.3820.1270.2650.274

Jul 2006

0.2970.2530.2580.2030.2860.2980.3140.3870.3180.3160.2860.1450.2660.272

Aug 2006

0.2240.2370.2640.2310.2840.3360.3390.4150.2900.3240.2380.1520.2610.286

Sep 2006

0.1480.2460.2790.2150.3150.3100.3350.3770.3600.2870.2350.1470.2460.264

Oct 2006

0.2770.2440.2520.2350.2920.3550.3450.3980.3230.3030.3080.1400.2410.262

Nov 2006

0.2270.2220.2790.2050.3060.3560.3130.3900.2760.3030.3610.1840.2710.265

Dec 2006

0.2070.2270.2580.2330.2950.2930.3410.3800.3340.3190.2850.1570.2610.265

Jan 2007

0.0940.2320.2660.2020.2830.3800.3610.3650.2950.3040.2710.1590.2750.260

Feb 2007

0.3220.2430.2780.2430.2960.3190.3520.3660.3030.2880.3260.1410.2510.286

Mar 2007

0.2560.2480.2750.2190.3130.3410.3340.3930.3470.3050.2980.1800.2800.243

Apr 2007

0.1710.2470.2500.2310.2750.3310.3090.4080.3130.3220.2240.1350.2950.260

May 2007

0.2310.2280.2540.2040.2830.3770.3730.3760.2890.3120.2690.1080.2430.259

Jun 2007

0.1510.2300.2920.2470.3030.3590.3600.3860.2850.3050.3350.1230.2520.263

Jul 2007

0.2020.2450.2670.2340.2960.3010.3430.3820.3070.2920.2540.1480.2680.284

Aug 2007

0.2480.2130.2600.2500.2710.3160.3310.3950.3080.3160.3050.1620.1790.260

Sep 2007

0.2590.2510.2590.2110.3110.3350.3590.3820.2500.2890.1590.1450.2180.278

Oct 2007

0.1930.2360.2620.2090.3000.3120.3080.3870.3410.3170.3170.1460.2320.268

Nov 2007

0.1750.2230.2600.2260.2900.3580.3190.3930.3060.2880.2240.1560.2500.268

Dec 2007

0.1970.2460.2880.2370.2870.3570.3250.3550.2660.2990.2880.1160.2480.269

Jan 2008

0.1840.2140.2660.2130.2900.3240.3470.3750.2600.3250.3250.1350.2370.256

Feb 2008

0.1800.2650.2700.2140.2850.3630.3340.4030.3270.3080.3200.1320.1900.270

Mar 2008

0.2020.2570.2760.2540.3100.2980.3600.3770.3200.3120.2430.1310.2300.265

Apr 2008

0.2130.2610.2520.2220.3280.2860.3440.3900.3420.3540.2130.1530.2550.270

May 2008

0.1810.2450.2990.2450.3190.3840.3620.3900.3080.3220.2640.1260.2380.267

Jun 2008

0.1520.2610.2980.2210.2980.3270.3980.4180.2960.3570.2380.1280.3270.257

Jul 2008

0.1760.2620.2680.2330.3110.3330.3560.3930.2640.3290.3160.1220.2680.271

Aug 2008

0.3050.2290.2570.2550.3110.3080.3560.4410.2740.3220.2740.1300.2390.277

Sep 2008

0.2420.2460.3040.2760.3240.3530.3780.4300.3280.3500.3050.1540.2310.288

Oct 2008

0.2710.2430.2890.2330.3440.2990.3130.4250.3180.3330.2970.1320.2340.271

Nov 2008

0.1470.2200.2980.2650.3030.3180.3440.4390.3320.3210.2620.1530.2700.282

Dec 2008

0.2140.2290.2780.2130.2880.3330.3140.3790.2900.2950.2740.1200.2960.258

Jan 2009

0.1950.2370.3020.2580.2920.3370.3130.4040.2580.3120.2800.1470.2640.261

Feb 2009

0.3530.2690.2920.2500.2900.3580.3520.4000.2830.3300.2360.1040.2620.282

Mar 2009

0.1940.2010.2830.2320.3040.2730.3330.4060.2940.2910.2870.0980.2670.257

Apr 2009

0.2740.2440.2520.2410.3110.3380.3360.3760.2740.3020.2840.1210.2500.258

May 2009

0.1070.2150.2780.2250.3110.3480.3480.3850.3250.3090.2050.1220.2510.255

Jun 2009

0.2110.2260.2910.2320.2950.3660.3710.4070.3160.3330.2780.1150.2780.290

Jul 2009

0.2000.2410.2760.2510.3350.3930.3750.4320.2670.3130.2970.1190.2660.271

Aug 2009

0.2040.2080.3000.2560.2980.3610.3350.3940.2770.3040.2840.1300.3020.280

Sep 2009

0.1530.2470.2700.2400.3030.4030.3820.4310.3680.3390.2440.1100.2650.273

Oct 2009

0.2510.2310.2620.2510.3310.3490.3330.4420.2840.3470.2450.1450.2900.259

Nov 2009

0.2180.2260.2930.2480.3160.3300.3430.4180.3140.3400.2780.1130.2450.257

Dec 2009

0.1640.1980.2910.2260.2830.4080.3410.4470.3240.2970.2870.1080.2320.275

Jan 2010

0.2380.2330.2880.2730.3380.3670.3740.4080.3050.3360.3410.1220.2460.270

Feb 2010

0.3430.2280.2670.2780.3130.3280.3950.4120.2890.3200.2910.0940.2660.279

Mar 2010

0.1900.2300.2760.2570.3130.3160.3640.3950.3140.3230.3150.1050.2620.280

Apr 2010

0.2980.2260.2930.2520.3270.3280.3840.4340.2960.3120.1940.1370.2290.263

May 2010

0.3250.2300.2800.2080.3060.3720.4020.4190.3020.3100.2420.1190.2380.282

Jun 2010

0.2520.2210.2650.2130.3210.3180.3680.4490.2830.3410.2200.0920.2400.273

Jul 2010

0.2190.2450.2620.2610.3440.3240.3810.4270.2990.3100.3070.1180.2510.292

Aug 2010

0.2860.2310.2790.2410.3180.3030.3950.4170.3250.3350.2160.1150.2300.268

Sep 2010

0.1600.2390.2660.2660.3150.4100.4180.4540.3360.3220.2400.1010.2630.280

Oct 2010

0.2850.1970.3000.2270.3180.3250.3600.4250.2880.3550.2550.1470.3030.260

Nov 2010

0.2210.2310.3200.2620.3140.3860.3490.4290.2980.3690.2320.1340.2460.263

Dec 2010

0.2880.2180.3210.2370.2840.3720.3730.4100.3030.3170.2210.1070.2330.296
CPS data -- "reported wage" variance, no imputations
DateMiningRetail TradeWholesale, Transport, & UtilitiesConstructionManufacturingInformationFinance & Real EstateProfessional & Business ServicesEducationHealth & Social AssistanceArts, Entertainment, & RecreationFood & LodgingOther ServicesGeneral Government

Jan 1998

0.2470.2120.2590.2190.2550.3170.3080.3340.3050.2730.3290.1200.2390.264

Feb 1998

0.2550.1910.2570.1940.2610.2900.3010.3450.3040.2640.1820.1270.2200.260

Mar 1998

0.2320.1820.2520.2250.2530.3260.3110.3420.3370.2570.2260.1640.1990.250

Apr 1998

0.2330.2030.2760.2030.2540.2760.3150.3610.3350.2720.1710.1280.2080.249

May 1998

0.2020.2060.2610.1830.2540.2860.2850.3400.3130.2600.2080.1220.1940.249

Jun 1998

0.2990.1780.2740.2290.2600.3240.2820.3240.2340.2830.2960.1450.2260.259

Jul 1998

0.2570.2060.2520.2160.2450.2780.3280.3590.3040.2670.1710.1190.2230.263

Aug 1998

0.2340.2010.2590.2250.2570.3070.3140.3310.2730.2620.2490.1100.1760.258

Sep 1998

0.2240.1990.2880.2140.2480.3260.2870.3840.3070.2710.1290.1180.2090.269

Oct 1998

0.2970.2160.2610.2140.2700.2920.3040.3600.3720.2850.2240.1570.2390.259

Nov 1998

0.3060.2110.2590.1750.2630.2920.3120.3710.3480.2680.2030.1280.2340.274

Dec 1998

0.1790.1980.2690.2440.2560.2870.3130.3520.3240.2910.2850.1420.1680.261

Jan 1999

0.2490.1970.2590.2120.2570.2870.3050.3290.2800.2620.2060.1080.2410.266

Feb 1999

0.2760.1970.2670.1910.2700.3050.3300.3510.3320.2780.1950.1180.2370.274

Mar 1999

0.2390.2090.2620.1890.2570.2910.2950.3280.3400.2670.2050.1350.1900.260

Apr 1999

0.1930.2160.2630.2160.2570.2390.3260.3700.3210.2740.1970.1410.2220.243

May 1999

0.3830.2020.2640.1910.2700.2820.2980.3540.3130.3040.2090.1340.2540.268

Jun 1999

0.2250.2170.2480.2090.2650.2800.2960.3610.2670.2760.2160.1120.2740.270

Jul 1999

0.2650.2190.2450.2170.2540.3190.3230.3830.3670.2820.2230.1550.1990.270

Aug 1999

0.3810.2150.2570.1930.2550.2680.2890.3450.3200.2860.1780.1210.2340.269

Sep 1999

0.2330.2190.2550.2010.2570.2730.3380.3750.3040.2840.2600.1510.2000.256

Oct 1999

0.1710.2220.2680.2170.2650.3170.3300.3240.3030.3010.2750.1880.2240.249

Nov 1999

0.3090.1980.2470.1990.2800.3070.2830.3320.3080.2890.2180.1490.2210.253

Dec 1999

0.2220.1950.2480.2450.2640.2670.2720.3480.3070.2660.1620.1320.2110.270

Jan 2000

0.1930.2140.2760.1770.2640.2750.2770.3310.2650.2520.2420.1560.2200.267

Feb 2000

0.2050.2110.2740.2080.2740.3180.3040.3890.3410.2940.2460.1100.2250.263

Mar 2000

0.2200.2170.2500.2240.2620.3390.3150.3970.3060.2760.1710.1320.2090.267

Apr 2000

0.2990.2200.2610.1970.2650.2950.3050.3620.2940.2600.1750.1250.2470.261

May 2000

0.1980.2090.2500.1950.2760.3270.3380.3860.3040.2730.2190.1300.3120.258

Jun 2000

0.2370.2120.2560.1990.2720.2940.3270.3840.3020.2880.2420.1310.2510.265

Jul 2000

0.3130.2040.2930.2130.2890.2990.3510.3960.2840.2600.2280.1360.2250.292

Aug 2000

0.1860.2280.2770.2070.2640.3100.2970.3760.2600.3170.1920.1850.2410.264

Sep 2000

0.2850.2410.2500.2030.2600.3090.2980.3590.2930.2790.2070.1470.2170.256

Oct 2000

0.2240.2310.2420.2260.2910.2630.3210.3450.3280.2890.2040.1720.2320.251

Nov 2000

0.2620.1980.2600.2020.2690.2970.3070.3870.3440.2620.3610.1560.1980.242

Dec 2000

0.2880.2050.2390.2100.2740.3560.3360.4120.2960.2790.3140.1200.2540.256

Jan 2001

0.2150.2220.2390.2170.2780.2950.3240.4030.2880.2640.2360.1390.1980.252

Feb 2001

0.1480.2040.2680.2120.2810.3100.3440.3910.3410.2830.2250.1420.2440.267

Mar 2001

0.2150.2320.2880.2090.2920.3160.3390.4100.3030.2860.2850.1150.2530.268

Apr 2001

0.1780.2580.2620.2150.2660.2940.3490.3790.3440.2810.2080.1280.2780.263

May 2001

0.2050.2780.2520.2080.2770.2990.3130.3590.2600.2590.2160.1340.2280.251

Jun 2001

0.2250.2170.2660.2370.2770.2820.3410.3670.3190.3010.2100.1190.2200.276

Jul 2001

0.2620.2020.2480.2250.2720.3000.3290.3830.3400.2900.1920.1650.2480.274

Aug 2001

0.2190.2460.2530.2190.2650.3290.3060.3710.3010.2980.2700.1610.2610.256

Sep 2001

0.2070.2270.2440.2290.2720.3130.3690.3500.3120.2620.2960.1450.2110.272

Oct 2001

0.2390.2420.2590.2240.2840.2800.3030.3640.3220.3130.1820.1580.2230.263

Nov 2001

0.1760.2010.2710.2090.2650.3410.2750.3820.2990.2640.2240.1420.2250.254

Dec 2001

0.1910.2040.2820.1910.2870.3360.3280.3910.2770.2880.2560.1240.2400.245

Jan 2002

0.1170.2280.2740.2450.2490.3030.3040.4160.3820.2890.2890.1390.2380.253

Feb 2002

0.2850.2290.2420.2160.2700.3470.3280.4140.3540.2930.2360.1450.2290.273

Mar 2002

0.3040.2340.2680.2560.2860.2970.3810.3920.3370.2800.2360.1580.2460.259

Apr 2002

0.1580.2180.2450.2190.2770.2970.3590.4040.2670.2760.2550.1680.2380.273

May 2002

0.1220.2460.2600.2100.2820.2590.3480.3840.2530.2750.2490.1530.1980.270

Jun 2002

0.1960.2050.2440.2350.2790.3410.3020.3930.2510.2810.1680.1540.2290.286

Jul 2002

0.1940.2380.2890.2200.2630.3300.3120.4010.3090.2910.1930.1360.2510.258

Aug 2002

0.1930.2220.2720.2160.2770.3110.3440.3710.3280.2810.2750.1630.2370.267

Sep 2002

0.1420.2470.2650.1830.2750.3070.3580.3640.3070.2980.1820.1490.2200.275

Oct 2002

0.1470.2490.2630.2330.2720.3130.3200.4080.3280.3240.2520.1730.2630.263

Nov 2002

0.1580.2210.2600.2110.2790.3470.3040.3520.3000.3030.2470.1470.2940.251

Dec 2002

0.1920.2080.2780.1930.2510.3250.3260.3980.2880.2800.2110.1520.2390.265

Jan 2003

0.1510.2410.2850.2290.2680.2780.3360.3860.3320.2670.2630.1300.2750.271

Feb 2003

0.2460.2430.2560.2410.2780.3410.3430.3850.3590.2980.3150.1500.2880.277

Mar 2003

0.2010.2300.2800.2550.2850.3690.3340.3860.3080.2970.2880.1550.2690.270

Apr 2003

0.1690.2320.2540.2340.2840.3110.3610.3920.2970.3160.2870.1680.2410.267

May 2003

0.2120.2240.2550.2040.2790.2880.3360.3990.3160.2850.2320.1600.2610.280

Jun 2003

0.1610.2230.2620.2440.2880.3240.3230.4390.2890.2830.2630.1700.2460.280

Jul 2003

0.2100.2400.2690.2270.2730.3720.3530.3900.3270.2960.2660.1440.2670.275

Aug 2003

0.1440.2450.2560.2510.2820.3190.3150.3780.3030.2860.2540.1570.2800.281

Sep 2003

0.2550.2500.2830.1910.2880.3440.3100.3580.3500.3100.2760.1680.2500.254

Oct 2003

0.1850.2600.2670.2210.2740.3100.3420.3860.3730.3020.3210.1750.2580.265

Nov 2003

0.2540.2200.2650.2580.2910.3370.3110.3900.2980.2840.3040.1680.3200.268

Dec 2003

0.1990.2200.2540.2450.2790.3380.3550.3800.3180.2900.2170.1700.2630.271

Jan 2004

0.1480.2470.2950.2200.3010.3020.3640.3530.2970.2860.2690.1570.2610.282

Feb 2004

0.2890.2430.2920.2470.3160.3430.3110.3880.3290.3050.2400.1620.2880.267

Mar 2004

0.1600.2600.2580.2360.2680.3200.3790.3700.3380.3130.3790.1580.2760.276

Apr 2004

0.2240.2410.2570.2200.2920.3480.3130.3920.3460.3310.3250.1810.3140.274

May 2004

0.1720.2420.2550.2240.2760.3220.3420.3840.3040.2850.2990.1510.2760.269

Jun 2004

0.1530.2290.2810.2180.3160.3510.3490.4060.2700.2900.2320.1680.2700.259

Jul 2004

0.1370.2550.2810.2320.2730.3160.2960.3880.2750.3250.2400.1580.2060.266

Aug 2004

0.2280.2430.2710.2150.2880.2660.3650.3930.2690.2730.2550.1720.3170.295

Sep 2004

0.3510.2450.2840.2240.3170.3070.3740.3770.3110.3030.4960.1440.2700.253

Oct 2004

0.2560.2390.2760.2130.2610.3350.3330.3820.3590.3000.2290.1860.2660.268

Nov 2004

0.2120.2360.2730.2340.3220.3520.3330.3880.3220.3030.3450.1640.3250.275

Dec 2004

0.2590.2520.2580.2320.2720.3330.3250.3860.3830.3160.3920.1570.2480.277

Jan 2005

0.3330.2660.2630.1970.3170.2800.3550.4180.3080.3190.3350.1860.2750.286

Feb 2005

0.2200.2810.2800.2360.3230.3510.3340.4230.3350.3040.3580.1470.2610.273

Mar 2005

0.2670.2620.3100.2230.2900.3260.3030.3720.3250.3230.2270.1770.2580.294

Apr 2005

0.3790.2530.2690.2290.2910.3990.3640.3770.3450.3200.2520.1530.2410.253

May 2005

0.3080.2590.2530.2240.3010.3190.3610.4340.3220.3200.2370.1390.3030.273

Jun 2005

0.2700.2240.2650.2210.3040.3480.3340.4270.3510.3250.3300.1620.2540.266

Jul 2005

0.2830.2400.2840.1990.2960.3730.3240.3900.3380.2850.1810.1600.2660.269

Aug 2005

0.1980.2300.2680.2080.2980.3540.3540.3800.3160.2860.1890.1800.2130.276

Sep 2005

0.2500.2640.2990.2290.3090.3660.3730.4280.3170.2860.2170.1600.2940.263

Oct 2005

0.2220.2500.2720.2380.2850.3550.3480.3800.3400.3330.2510.1590.2750.267

Nov 2005

0.1910.2430.2600.2120.2970.3840.2960.4100.3400.3000.2890.1580.2590.284

Dec 2005

0.1480.2410.2690.2110.2980.2810.3710.3890.3430.3040.2300.1710.2630.270

Jan 2006

0.1350.2470.2650.2040.3050.3550.3230.3940.2940.3210.2740.1590.2550.278

Feb 2006

0.2200.2900.2730.2620.2760.3900.3570.3950.2970.3070.3400.1620.3170.268

Mar 2006

0.2860.2580.2780.2270.2970.3590.3350.3960.2800.3180.3850.1490.2600.275

Apr 2006

0.5170.2450.2450.2390.2900.3240.3600.4230.3580.3030.2580.1400.2410.258

May 2006

0.2380.2320.2450.2180.3020.4080.3600.3990.3120.3120.3050.1370.3110.270

Jun 2006

0.1510.2540.2710.2240.3200.3720.3330.3930.3360.3130.4080.1440.2780.274

Jul 2006

0.3270.2540.2600.2080.2850.3100.3130.3920.3230.3150.2870.1590.2800.270

Aug 2006

0.2390.2400.2690.2310.2820.3480.3390.4180.2860.3300.2420.1680.2670.289

Sep 2006

0.1470.2490.2860.2140.3180.3140.3400.3790.3570.2920.2410.1640.2520.264

Oct 2006

0.2970.2440.2540.2380.2970.3570.3490.4040.3250.3010.2980.1590.2430.259

Nov 2006

0.2390.2230.2850.2060.3080.3690.3190.3880.2750.3050.3580.1970.2870.264

Dec 2006

0.1930.2270.2620.2330.2920.3020.3480.3890.3400.3190.2790.1720.2630.267

Jan 2007

0.0850.2340.2720.2020.2830.3840.3710.3690.2940.3060.2780.1690.2810.261

Feb 2007

0.3350.2440.2820.2460.2980.3330.3600.3730.3040.2890.3160.1500.2550.289

Mar 2007

0.2580.2500.2770.2230.3110.3480.3350.3950.3500.3080.3080.1880.2860.245

Apr 2007

0.1750.2520.2480.2300.2740.3250.3100.4180.3080.3230.2420.1400.3020.265

May 2007

0.2300.2320.2540.2120.2870.3680.3770.3820.2880.3170.2740.1160.2450.257

Jun 2007

0.1630.2400.2920.2480.3030.3650.3680.3910.2860.3060.3300.1270.2600.264

Jul 2007

0.2150.2490.2710.2400.3000.3110.3420.3870.3110.2920.2650.1600.2670.287

Aug 2007

0.2450.2160.2620.2590.2730.3190.3280.4030.3210.3170.3120.1660.1850.261

Sep 2007

0.2530.2570.2620.2120.3140.3310.3680.3870.2530.2890.1560.1570.2250.278

Oct 2007

0.2040.2400.2660.2110.3010.3180.3210.3840.3350.3170.3240.1530.2400.272

Nov 2007

0.1720.2240.2610.2260.2940.3680.3210.4010.3120.2930.2240.1610.2580.268

Dec 2007

0.1970.2500.2880.2420.2880.3610.3310.3640.2650.3050.2860.1210.2490.272

Jan 2008

0.1860.2190.2670.2170.2950.3350.3510.3790.2620.3290.3250.1370.2430.254

Feb 2008

0.1830.2680.2730.2180.2870.3750.3420.4070.3180.3100.3210.1390.1910.271

Mar 2008

0.2080.2610.2750.2510.3170.3030.3600.3790.3310.3130.2490.1330.2390.265

Apr 2008

0.1930.2640.2570.2280.3340.2950.3510.3950.3360.3520.2180.1590.2540.269

May 2008

0.1780.2520.3050.2490.3190.3860.3650.3920.3030.3250.2810.1300.2410.268

Jun 2008

0.1530.2630.2990.2190.3010.3290.3970.4240.3010.3590.2480.1290.3350.263

Jul 2008

0.1780.2650.2640.2330.3100.3310.3510.3960.2670.3310.3240.1390.2750.276

Aug 2008

0.3050.2340.2580.2530.3090.3160.3560.4400.2880.3260.2770.1470.2460.279

Sep 2008

0.2510.2480.3060.2780.3310.3570.3760.4260.3390.3500.3150.1710.2370.288

Oct 2008

0.2720.2490.2890.2330.3410.3010.3140.4230.3220.3330.3010.1490.2450.274

Nov 2008

0.1640.2180.2890.2710.3020.3180.3430.4400.3520.3210.2690.1720.2820.286

Dec 2008

0.2280.2310.2750.2180.2850.3420.3170.3860.2940.2980.2780.1360.2930.259

Jan 2009

0.2000.2380.3020.2600.2890.3420.3200.4040.2650.3120.2820.1570.2740.264

Feb 2009

0.3390.2720.2950.2490.2940.3640.3530.4010.2900.3290.2340.1130.2590.285

Mar 2009

0.1900.2030.2860.2410.3060.2780.3380.4060.2930.2920.2860.1060.2680.258

Apr 2009

0.2630.2420.2520.2480.3100.3330.3380.3780.2760.3060.2950.1300.2550.260

May 2009

0.1100.2180.2790.2260.3120.3530.3460.3800.3280.3130.2160.1320.2610.254

Jun 2009

0.2170.2260.2910.2300.2980.3710.3770.4100.3130.3360.2800.1200.2810.292

Jul 2009

0.2100.2440.2780.2510.3340.3940.3710.4320.2650.3140.2940.1260.2760.272

Aug 2009

0.2050.2120.2970.2550.3000.3760.3370.3970.2780.3040.2830.1400.3080.282

Sep 2009

0.1540.2470.2720.2410.3020.4080.3760.4320.3780.3370.2570.1190.2710.278

Oct 2009

0.2450.2340.2620.2560.3290.3480.3300.4460.2900.3490.2590.1540.2930.260

Nov 2009

0.2210.2280.3000.2460.3110.3300.3440.4210.3230.3410.2900.1250.2460.259

Dec 2009

0.1680.1990.2860.2340.2840.4080.3400.4510.3220.2990.2860.1180.2330.280

Jan 2010

0.2360.2340.2870.2780.3340.3680.3750.4110.3100.3390.3450.1300.2510.275

Feb 2010

0.3420.2270.2700.2850.3120.3280.4050.4180.2930.3190.3030.1000.2710.278

Mar 2010

0.1940.2330.2760.2560.3090.3190.3670.3990.3280.3280.3250.1090.2670.279

Apr 2010

0.2840.2270.2920.2570.3260.3310.3890.4410.2970.3120.1960.1470.2280.266

May 2010

0.3080.2300.2830.2120.3050.3760.4000.4190.3130.3140.2550.1270.2430.285

Jun 2010

0.2590.2250.2620.2090.3180.3220.3670.4560.2890.3420.2350.0990.2480.277

Jul 2010

0.2260.2400.2610.2640.3430.3280.3800.4310.2970.3130.3050.1250.2620.295

Aug 2010

0.2760.2300.2840.2390.3170.3140.4000.4210.3370.3380.2220.1240.2260.269

Sep 2010

0.1510.2430.2610.2720.3170.4210.4160.4590.3490.3270.2420.1090.2680.281

Oct 2010

0.3050.1940.2990.2330.3210.3250.3690.4240.2810.3590.2630.1580.3060.261

Nov 2010

0.2340.2330.3180.2640.3100.3870.3500.4260.2990.3710.2370.1460.2500.266

Dec 2010

0.2970.2200.3260.2380.2850.3890.3710.4110.3010.3200.2290.1160.2380.296
OES data -- wage variance, no imputations
DateMiningRetail TradeWholesale, Transport, & UtilitiesConstructionManufacturingInformationFinance & Real EstateProfessional & Business ServicesEducationHealth & Social AssistanceArts, Entertainment, & RecreationFood & LodgingOther ServicesGeneral Government

Jan 1998

nullnullnullnullnullnullnullnullnullnullnullnullnullnull

Feb 1998

nullnullnullnullnullnullnullnullnullnullnullnullnullnull

Mar 1998

nullnullnullnullnullnullnullnullnullnullnullnullnullnull

Apr 1998

nullnullnullnullnullnullnullnullnullnullnullnullnullnull

May 1998

nullnullnullnullnullnullnullnullnullnullnullnullnullnull

Jun 1998

nullnullnullnullnullnullnullnullnullnullnullnullnullnull

Jul 1998

nullnullnullnullnullnullnullnullnullnullnullnullnullnull

Aug 1998

nullnullnullnullnullnullnullnullnullnullnullnullnullnull

Sep 1998

nullnullnullnullnullnullnullnullnullnullnullnullnullnull

Oct 1998

nullnullnullnullnullnullnullnullnullnullnullnullnullnull

Nov 1998

0.2860.2180.2990.2370.2680.3240.3460.4090.2860.3290.2170.1060.2540.225

Dec 1998

nullnullnullnullnullnullnullnullnullnullnullnullnullnull

Jan 1999

nullnullnullnullnullnullnullnullnullnullnullnullnullnull

Feb 1999

nullnullnullnullnullnullnullnullnullnullnullnullnullnull

Mar 1999

nullnullnullnullnullnullnullnullnullnullnullnullnullnull

Apr 1999

nullnullnullnullnullnullnullnullnullnullnullnullnullnull

May 1999

nullnullnullnullnullnullnullnullnullnullnullnullnullnull

Jun 1999

nullnullnullnullnullnullnullnullnullnullnullnullnullnull

Jul 1999

nullnullnullnullnullnullnullnullnullnullnullnullnullnull

Aug 1999

nullnullnullnullnullnullnullnullnullnullnullnullnullnull

Sep 1999

nullnullnullnullnullnullnullnullnullnullnullnullnullnull

Oct 1999

nullnullnullnullnullnullnullnullnullnullnullnullnullnull

Nov 1999

0.2590.2310.3220.2370.2820.3360.3820.4370.2790.3530.2370.1240.2580.227

Dec 1999

nullnullnullnullnullnullnullnullnullnullnullnullnullnull

Jan 2000

nullnullnullnullnullnullnullnullnullnullnullnullnullnull

Feb 2000

nullnullnullnullnullnullnullnullnullnullnullnullnullnull

Mar 2000

nullnullnullnullnullnullnullnullnullnullnullnullnullnull

Apr 2000

nullnullnullnullnullnullnullnullnullnullnullnullnullnull

May 2000

nullnullnullnullnullnullnullnullnullnullnullnullnullnull

Jun 2000

nullnullnullnullnullnullnullnullnullnullnullnullnullnull

Jul 2000

nullnullnullnullnullnullnullnullnullnullnullnullnullnull

Aug 2000

nullnullnullnullnullnullnullnullnullnullnullnullnullnull

Sep 2000

nullnullnullnullnullnullnullnullnullnullnullnullnullnull

Oct 2000

nullnullnullnullnullnullnullnullnullnullnullnullnullnull

Nov 2000

0.2520.2290.3090.2420.2730.3530.3800.4350.2990.3460.2840.1180.2630.230

Dec 2000

nullnullnullnullnullnullnullnullnullnullnullnullnullnull

Jan 2001

nullnullnullnullnullnullnullnullnullnullnullnullnullnull

Feb 2001

nullnullnullnullnullnullnullnullnullnullnullnullnullnull

Mar 2001

nullnullnullnullnullnullnullnullnullnullnullnullnullnull

Apr 2001

nullnullnullnullnullnullnullnullnullnullnullnullnullnull

May 2001

nullnullnullnullnullnullnullnullnullnullnullnullnullnull

Jun 2001

nullnullnullnullnullnullnullnullnullnullnullnullnullnull

Jul 2001

nullnullnullnullnullnullnullnullnullnullnullnullnullnull

Aug 2001

nullnullnullnullnullnullnullnullnullnullnullnullnullnull

Sep 2001

nullnullnullnullnullnullnullnullnullnullnullnullnullnull

Oct 2001

nullnullnullnullnullnullnullnullnullnullnullnullnullnull

Nov 2001

0.2430.2450.3080.2480.2860.3440.3750.4550.2870.3460.3040.1400.2660.233

Dec 2001

nullnullnullnullnullnullnullnullnullnullnullnullnullnull

Jan 2002

nullnullnullnullnullnullnullnullnullnullnullnullnullnull

Feb 2002

nullnullnullnullnullnullnullnullnullnullnullnullnullnull

Mar 2002

nullnullnullnullnullnullnullnullnullnullnullnullnullnull

Apr 2002

nullnullnullnullnullnullnullnullnullnullnullnullnullnull

May 2002

nullnullnullnullnullnullnullnullnullnullnullnullnullnull

Jun 2002

nullnullnullnullnullnullnullnullnullnullnullnullnullnull

Jul 2002

nullnullnullnullnullnullnullnullnullnullnullnullnullnull

Aug 2002

nullnullnullnullnullnullnullnullnullnullnullnullnullnull

Sep 2002

nullnullnullnullnullnullnullnullnullnullnullnullnullnull

Oct 2002

nullnullnullnullnullnullnullnullnullnullnullnullnullnull

Nov 2002

0.2600.2460.3480.2530.3160.3700.4360.4770.2920.3560.2960.1270.2780.240

Dec 2002

nullnullnullnullnullnullnullnullnullnullnullnullnullnull

Jan 2003

nullnullnullnullnullnullnullnullnullnullnullnullnullnull

Feb 2003

nullnullnullnullnullnullnullnullnullnullnullnullnullnull

Mar 2003

nullnullnullnullnullnullnullnullnullnullnullnullnullnull

Apr 2003

nullnullnullnullnullnullnullnullnullnullnullnullnullnull

May 2003

0.2340.2500.3210.2510.2820.3800.3980.4560.2940.3620.3060.1330.2780.248

Jun 2003

nullnullnullnullnullnullnullnullnullnullnullnullnullnull

Jul 2003

nullnullnullnullnullnullnullnullnullnullnullnullnullnull

Aug 2003

nullnullnullnullnullnullnullnullnullnullnullnullnullnull

Sep 2003

nullnullnullnullnullnullnullnullnullnullnullnullnullnull

Oct 2003

nullnullnullnullnullnullnullnullnullnullnullnullnullnull

Nov 2003

0.2820.2390.3230.2480.3010.3730.3900.4500.3180.3690.3230.1280.2760.256

Dec 2003

nullnullnullnullnullnullnullnullnullnullnullnullnullnull

Jan 2004

nullnullnullnullnullnullnullnullnullnullnullnullnullnull

Feb 2004

nullnullnullnullnullnullnullnullnullnullnullnullnullnull

Mar 2004

nullnullnullnullnullnullnullnullnullnullnullnullnullnull

Apr 2004

nullnullnullnullnullnullnullnullnullnullnullnullnullnull

May 2004

0.2340.2410.3210.2470.2880.3960.3840.4680.2910.3600.3160.1360.2860.254

Jun 2004

nullnullnullnullnullnullnullnullnullnullnullnullnullnull

Jul 2004

nullnullnullnullnullnullnullnullnullnullnullnullnullnull

Aug 2004

nullnullnullnullnullnullnullnullnullnullnullnullnullnull

Sep 2004

nullnullnullnullnullnullnullnullnullnullnullnullnullnull

Oct 2004

nullnullnullnullnullnullnullnullnullnullnullnullnullnull

Nov 2004

0.2750.2370.3240.2480.3000.3550.3970.4620.2850.3590.3140.1380.2720.246

Dec 2004

nullnullnullnullnullnullnullnullnullnullnullnullnullnull

Jan 2005

nullnullnullnullnullnullnullnullnullnullnullnullnullnull

Feb 2005

nullnullnullnullnullnullnullnullnullnullnullnullnullnull

Mar 2005

nullnullnullnullnullnullnullnullnullnullnullnullnullnull

Apr 2005

nullnullnullnullnullnullnullnullnullnullnullnullnullnull

May 2005

0.2500.2410.3140.2420.2660.4030.3670.4610.2900.3520.2860.1380.2830.260

Jun 2005

nullnullnullnullnullnullnullnullnullnullnullnullnullnull

Jul 2005

nullnullnullnullnullnullnullnullnullnullnullnullnullnull

Aug 2005

nullnullnullnullnullnullnullnullnullnullnullnullnullnull

Sep 2005

nullnullnullnullnullnullnullnullnullnullnullnullnullnull

Oct 2005

nullnullnullnullnullnullnullnullnullnullnullnullnullnull

Nov 2005

0.2920.2310.3420.2390.3170.3440.3860.4620.3000.3730.3170.1290.2750.269

Dec 2005

nullnullnullnullnullnullnullnullnullnullnullnullnullnull

Jan 2006

nullnullnullnullnullnullnullnullnullnullnullnullnullnull

Feb 2006

nullnullnullnullnullnullnullnullnullnullnullnullnullnull

Mar 2006

nullnullnullnullnullnullnullnullnullnullnullnullnullnull

Apr 2006

nullnullnullnullnullnullnullnullnullnullnullnullnullnull

May 2006

0.2300.2410.3210.2360.2840.3950.3840.4490.2970.3680.3110.1340.2800.253

Jun 2006

nullnullnullnullnullnullnullnullnullnullnullnullnullnull

Jul 2006

nullnullnullnullnullnullnullnullnullnullnullnullnullnull

Aug 2006

nullnullnullnullnullnullnullnullnullnullnullnullnullnull

Sep 2006

nullnullnullnullnullnullnullnullnullnullnullnullnullnull

Oct 2006

nullnullnullnullnullnullnullnullnullnullnullnullnullnull

Nov 2006

0.2360.2310.3200.2380.2960.3470.3830.4600.2820.3650.2910.1270.2760.249

Dec 2006

nullnullnullnullnullnullnullnullnullnullnullnullnullnull

Jan 2007

nullnullnullnullnullnullnullnullnullnullnullnullnullnull

Feb 2007

nullnullnullnullnullnullnullnullnullnullnullnullnullnull

Mar 2007

nullnullnullnullnullnullnullnullnullnullnullnullnullnull

Apr 2007

nullnullnullnullnullnullnullnullnullnullnullnullnullnull

May 2007

0.2310.2330.2990.2380.2890.4070.3660.4450.2850.3630.2900.1300.2690.260

Jun 2007

nullnullnullnullnullnullnullnullnullnullnullnullnullnull

Jul 2007

nullnullnullnullnullnullnullnullnullnullnullnullnullnull

Aug 2007

nullnullnullnullnullnullnullnullnullnullnullnullnullnull

Sep 2007

nullnullnullnullnullnullnullnullnullnullnullnullnullnull

Oct 2007

nullnullnullnullnullnullnullnullnullnullnullnullnullnull

Nov 2007

0.2980.2280.3220.2450.3100.3490.3720.4530.3000.3710.2970.1190.2710.252

Dec 2007

nullnullnullnullnullnullnullnullnullnullnullnullnullnull

Jan 2008

nullnullnullnullnullnullnullnullnullnullnullnullnullnull

Feb 2008

nullnullnullnullnullnullnullnullnullnullnullnullnullnull

Mar 2008

nullnullnullnullnullnullnullnullnullnullnullnullnullnull

Apr 2008

nullnullnullnullnullnullnullnullnullnullnullnullnullnull

May 2008

0.2600.2210.2970.2510.2870.4020.3710.4600.3030.3610.2720.1290.2700.271

Jun 2008

nullnullnullnullnullnullnullnullnullnullnullnullnullnull

Jul 2008

nullnullnullnullnullnullnullnullnullnullnullnullnullnull

Aug 2008

nullnullnullnullnullnullnullnullnullnullnullnullnullnull

Sep 2008

nullnullnullnullnullnullnullnullnullnullnullnullnullnull

Oct 2008

nullnullnullnullnullnullnullnullnullnullnullnullnullnull

Nov 2008

0.2590.2130.3220.2470.3480.3810.3920.4710.2960.3790.3020.1140.2680.272

Dec 2008

nullnullnullnullnullnullnullnullnullnullnullnullnullnull

Jan 2009

nullnullnullnullnullnullnullnullnullnullnullnullnullnull

Feb 2009

nullnullnullnullnullnullnullnullnullnullnullnullnullnull

Mar 2009

nullnullnullnullnullnullnullnullnullnullnullnullnullnull

Apr 2009

nullnullnullnullnullnullnullnullnullnullnullnullnullnull

May 2009

0.2590.2120.3000.2540.2950.3870.3900.4650.2810.3730.2890.1070.2760.258

Jun 2009

nullnullnullnullnullnullnullnullnullnullnullnullnullnull

Jul 2009

nullnullnullnullnullnullnullnullnullnullnullnullnullnull

Aug 2009

nullnullnullnullnullnullnullnullnullnullnullnullnullnull

Sep 2009

nullnullnullnullnullnullnullnullnullnullnullnullnullnull

Oct 2009

nullnullnullnullnullnullnullnullnullnullnullnullnullnull

Nov 2009

0.3220.2070.3060.2510.3090.3400.3890.4710.2820.3740.2890.1000.2730.259

Dec 2009

nullnullnullnullnullnullnullnullnullnullnullnullnullnull

Jan 2010

nullnullnullnullnullnullnullnullnullnullnullnullnullnull

Feb 2010

nullnullnullnullnullnullnullnullnullnullnullnullnullnull

Mar 2010

nullnullnullnullnullnullnullnullnullnullnullnullnullnull

Apr 2010

nullnullnullnullnullnullnullnullnullnullnullnullnullnull

May 2010

0.3580.2120.2980.2470.3020.4070.3760.4660.2990.3800.2810.1100.2850.268

Jun 2010

nullnullnullnullnullnullnullnullnullnullnullnullnullnull

Jul 2010

nullnullnullnullnullnullnullnullnullnullnullnullnullnull

Aug 2010

nullnullnullnullnullnullnullnullnullnullnullnullnullnull

Sep 2010

nullnullnullnullnullnullnullnullnullnullnullnullnullnull

Oct 2010

nullnullnullnullnullnullnullnullnullnullnullnullnullnull

Nov 2010

nullnullnullnullnullnullnullnullnullnullnullnullnullnull

Dec 2010

nullnullnullnullnullnullnullnullnullnullnullnullnullnull

An examination of figure 7 shows that the higher wage variance in the OES than the CPS is concentrated in certain industry groups. These are mining; finance and real estate; professional and business services; and health and social assistance. These industries have large numbers of high-wage workers, and among them, only the health and social assistance industry has government employment reported in the OES. Increasing variance between 1998 and 2009 occurs within most but not all industries in both the CPS and the OES.

Figure 8 shows these variance trends over time for occupation groups. The groups used here are 19 large groupings designed for comparability between the older occupation codes used in the OES program and the standard SOC codes used beginning in 1999; they differ slightly from the major occupations of the SOC.25 Both government and private sector employers report the full distribution of their occupations to the OES.

Select an occupation grouping to chart:

The pattern of wage variance by occupation is similar in the CPS and the OES (with the exception of managers and healthcare workers in the 1998-to-2002 time period).26 Looking at wage variance levels, the wage variance of professional occupations (such as management, healthcare, and other professional and technical) is higher than the wage variance of service or “blue collar” occupations (such as maintenance and repair, construction and extraction, and production). The growth of wage variance is also most evident in the professional occupations of business and finance; life, physical, and social sciences; computers and math; and health care occupations.

In addition to comparing the variance trends in the CPS and OES within various categories, as is done in figures 6–8, we can also compare trends in how much total wage variance can be explained by each of these categories. In any year, the fraction of variance explained by a categorical variable is equivalent to the R2 of regressions with dummy variables for all categories of this variable (referred to as group fixed effects in the statistics and econometrics literatures). For example, in a regression with industry fixed effects, we regress the log wage for each individual i working in industry j in time period t as formula, where formula is an indicator variable that takes a value of 1 for the jth industry during time period t and 0 otherwise. We are interested in the total amount of variation in formula explained by these industry indicators. The fraction of variation explained by industry categories in each time period is the R2 value of the regression in that time period.

Figure 9 shows the fraction of log wage variance explained by each key variable in the CPS and the OES in single-category regressions for each time period. In both the OES and the CPS, regressions with indicators for sector explain only 23 percent of overall wage variation, while industry groups explain 1517 percent of wage variation. Industry explains slightly more of the variation in the (employer-reported) OES than in the (employee-reported) CPS. Occupation explains more of the variation in wages in the OES (about 40 percent) than these same variables explain in the CPS (about 30 percent). This phenomenon was also noted by Katharine G. Abraham and Jamie R. Spletzer,27 who attribute it to more accurate reporting of occupation by employers who answer the OES than by individuals who answer the CPS.

Figure 9. CPS and OES fraction of log wage variation explained, by variable

The OES does not contain information about the education levels of workers, but the CPS does. Much of the inequality literature based on CPS data notes the importance of education for explaining the variance of wages across individuals. Education explains about 28 percent of the variance in ln(wage) in the CPS, and this is constant over the time period of our analysis. As noted by several authors, such as Sergio Firpo, Nicole M. Fortin, and Thomas Lemieux,28 occupation explains more of wage variance than education in the CPS, and the amount of wage variation explained by occupation has been growing over time. We find that the amount of wage variance explained by occupation is growing more quickly in the OES than in the CPS.

Several authors using other datasets have found that establishments explain more than half of all private-sector wage variation,29 and this fraction has been rising over time. We confirm this result for the private sector in the OES,30 using establishment fixed effects for each of the hundreds of thousands of establishments surveyed in each panel of the OES, and show that knowledge of which establishment employs each worker explains a larger fraction of log wage variation than knowledge of any other single variable in the CPS or OES. Specifically, as seen in figure 9, knowing workers’ establishments explains 54 to 57 percent of the variance of wages, which is much higher than knowing only industries, occupations, sectors, or education levels (although knowing the establishment of a worker also identifies the industry and sector). Our results in figure 9 show that the explanatory power of establishments in explaining log wage variance is increasing over time. Growing amounts of wage inequality are due to differences between establishments, although much of this is due to differences between industries. Greater explanatory power to explain the growth of log wage variance over the 1998 to 2009 period—more than from knowing either the employer or the industry—comes from occupations.

WE SHOW THAT IT IS POSSIBLE to use the Occupational Employment Statistics (OES) microdata to examine trends in wage inequality in the United States. Trends found using the OES data for the period 19982010 broadly mirror trends derived from the more-widely used Current Population Survey (CPS) microdata. Both datasets show that during the 19982010 period, sector (private versus government) explains 23 percent of overall wage variation, while industry groups explain 1517 percent of wage variation, and occupation groups explain 3040 percent of wage variation. Industry and (particularly) occupation explain more of overall wage variation in the (employer-reported) OES than in the (employee-reported) CPS. The amount of wage variance explained by occupation is also growing more quickly in the OES than in the CPS.

Perhaps the most valuable feature of the OES for scholars of wage inequality is the employer information these data contain. In an examination not possible with CPS data, we show that within the private sector, establishments explain much more of wage inequality than occupations. In future work with these data, we plan to use the information uniquely contained in the OES microdata regarding the mix of occupations employed by each establishment to assess how changes in occupational sorting within establishments contributes to overall wage inequality growth in the United States.

Suggested citation:

James R. Spletzer and Elizabeth Weber Handwerker, "Measuring the distribution of wages in the United States from 1996 through 2010 using the Occupational Employment Survey," Monthly Labor Review, U.S. Bureau of Labor Statistics, May 2014, https://doi.org/10.21916/mlr.2014.18

Notes


1 See, for example, “Trends in the distribution of household income between 1979 and 2007,” (Congressional Budget Office, October 2011), www.cbo.gov/publication/42729.

2 John Bound and George Johnson, “Changes in the structure of wages in the 1980's: an evaluation of alternative explanations,” American Economic Review, June 1992, pp. 371392; Lawrence F. Katz and Kevin M. Murphy, “Changes in relative wages, 19631987: supply and demand factors,” Quarterly Journal of Economics, February 1992, pp. 3578; and Thomas Lemieux, “Increasing residual wage inequality: composition effects, noisy data, or rising demand for skill?” American Economic Review, June 2006, pp. 461498.

3 Thomas Lemieux, “The changing nature of wage inequality,” Journal of Population Economics, January 2008, pp. 2148; and David H. Autor, Lawrence F. Katz, and Melissa S. Kearney, “The polarization of the U.S. labor market,” American Economic Association annual meeting papers and proceedings, 2006, pp. 189194 and “Trends in U.S. wage inequality: re-assessing the revisionists,” Review of Economics and Statistics, May 2008, pp. 300323.

4 Chinhui Juhn, Kevin M. Murphy, and Brooks Pierce, “Wage inequality and the rise in returns to skill wage inequality and the rise in returns to skill,” Journal of Political Economy, June 1993, pp. 410-442; Katz and Murphy, “Changes in relative wages;” Daron Acemoglu, “Technical change, inequality, and the labor market,” Journal of Economic Literature, March 2002, pp. 7–72; and Autor, Katz, and Kearney, “The polarization of the U.S. labor market” and “Trends in U.S. wage inequality.”

5 Sergio Firpo, Nicole M. Fortin, and Thomas Lemieux, “Occupational tasks and changes in the wage structure,” working paper, February 2011, http://faculty.arts.ubc.ca/nfortin/FFL_Occupations_feb2011.pdf.

6 Lemieux, “The changing nature of wage inequality.”

7 David Card and John E. DiNardo, “Skill-biased technological change and rising wage inequality: some problems and puzzles,” Journal of Labor Economics, October 2002, pp. 733783; and David Lee, “Wage inequality in the United States during the 1980s: rising dispersion or falling minimum wage?” Quarterly Journal of Economics, August 1999, pp. 9771023.

8 Thomas Lemieux, W. Bentley MacLeod, and Daniel Parent, “Performance pay and wage inequality,” Quarterly Journal of Economics, February 2009, pp. 149.

9 Erica L. Groshen, “Sources of intra-industry wage dispersion: how much do employers matter?” Quarterly Journal of Economics, August 1991, pp. 869884, and “Five reasons why wages vary among employers,” Industrial Relations, Fall 1991, pp. 350381; Stephen G. Bronars and Melissa Famulari, “Wage, tenure, and wage growth variation within and across establishments,” Journal of Labor Economics, 1997, pp. 285317; David I. Levine, Dale Belman, and Gary Charness, How new is the new employment contract? Evidence from North American pay practice (Kalamazoo, MI: W.E. Upjohn Institute for Employment Research, 2002); John M. Abowd, Francis Kramarz, and David Margolis, “High wage workers and high wage firms,” Econometrica, February 1999, pp. 251–333; and Julia I. Lane, Laurie A. Salmon, and James R. Spletzer, “Establishment wage differentials,” Monthly Labor Review, April 2007, pp. 317, https://www.bls.gov/opub/mlr/2007/04/art1full.pdf.

10 Steve J. Davis and John Haltiwanger, “Wage dispersion between and within U.S. manufacturing plants,” Brookings papers on economic activity, 1991, pp. 115200; Timothy Dunne, Lucia Foster, John Haltiwanger, and Kenneth R. Troske, “Wage and productivity dispersion in United States manufacturing: the role of computer investment,” Journal of Labor Economics, April 2004, pp. 397429; Fredrik Andersson, Elizabeth E. Davis, Matthew L. Freedman, Julia I. Lane, Brian P. McCall, and Kristin Sandusky, “Decomposing the sources of earnings inequality: assessing the role of reallocation,” Industrial Relations: A Journal of Economy and Society, October 2012, pp. 779810; and Erling Barth, Alex Bryson, James C. Davis, and Richard Freeman, “The contribution of dispersion across plants to the increase in US earnings dispersion,” unpublished paper, 2011, http://cep.lse.ac.uk/seminarpapers/08-02-11-AB.pdf.

11 Autor, Katz, and Kearney, “Trends in U.S. Wage Inequality;” Firpo, Fortin, and Lemieux, “Occupational tasks and changes in the wage structure;” and Daron Acemoglu and David Autor, “Skills, tasks and technologies: implications for employment and earnings,” in David Card and Orley Ashenfelter, eds., Handbook of labor economics, vol. 4B (North Holland: 2011, pp. 1,043–1,171).

12 As stated on the OES website, “Challenges in using OES data as a time series include changes in the occupational, industrial, and geographical classification systems, changes in the way data are collected, changes in the survey reference period, and changes in mean wage estimation methodology, as well as permanent features of the methodology,” https://www.bls.gov/oes/oes_ques.htm. Many further details on the limitations of using OES data to construct time series are given in Katharine G. Abraham and James R. Spletzer, “Addressing the demand for time series and longitudinal data on occupational employment” in Susan N. Houseman and Kenneth F. Ryder, eds., Measurement issues arising from the growth of globalization: conference papers (National Academy of Public Administration and W.E. Upjohn Institute for Employment Research, 2010).

13 Data provided to OES by federal and state governments are not broken out into individual establishments.

14 Annual wage rates listed on OES survey forms are 2,080 times the hourly wage rates.

15 For 1996 to 2001, the lower bound of the top-most (open-ended) interval was used as the wage for workers in this interval. From 2002 forward, the mean wage from the NCS for workers in the top-most interval has been used. For 19962001, we multiply the wage in the top-most interval by 1.4.

16 Katharine G. Abraham and James R. Spletzer, “Are the new jobs good jobs?” in Labor in the new economy, NBER Studies in Income and Wealth, Katharine G. Abraham, James R. Spletzer, and Michael Harper, eds. (Chicago, IL: University of Chicago Press, 2010).

17 This was described in Katharine G. Abraham and James R. Spletzer, “Addressing the demand for time series and longitudinal data on occupational employment.”

18 Employment data are obtained from the federal government only in May, beginning in May 2005. Employment data for state governments are obtained only in November. In this paper, we “borrow” observations from the previous May in making estimates for federal government employment in November, and “borrow” observations from the previous November in making estimates for state government employment in May. The wage estimates used are those used by the OES program for each estimation date, adjusted for inflation.

19 In John Jones, “What do OES data have to say about increasing wage inequality?” Monthly Labor Review, June 2009, pp.3949, OES wage data were used to examine wage inequality, by examining the wages corresponding to selected percentiles of the wage distribution for each occupation in the OES in 2002 and 2008. Jones’ analyses did not examine overall variance trends.

20 Thomas Lemieux, “What do we really know about changes in wage inequality?” in Katharine G. Abraham, James R. Spletzer, and Michael Harper, eds., Labor in the new economy, NBER Studies in Income and Wealth (Chicago, IL: University of Chicago Press, 2010), pp. 1759; and Lemieux, “Increasing residual wage inequality.”

21 The OES program assumes a uniform distribution of wages within each wage interval in producing percentile wage estimates. See https://www.bls.gov/oes/methods_10.pdf for more information.

22 The OES data in figure 1 are October/November/December data from 1996 to 2001, and November data from 2002 to 2009. The CPS data in each year are October/November/December data.

23 Note that the intervals in the OES survey do not change between 1996 and 1998, and thus with the exception of inflation, the wage distributions should be largely similar in these three years. The CPS distributions are remarkably similar in all three years, whereas the OES distributions are not. We conclude that there is something unusual and unexplainable in the first two intervals of the 1996 and 1997 OES microdata.

24 Almost all studies of wage inequality examine the natural log of wages rather than the level of wages. This is done primarily because the distribution of ln(wage) is normally distributed.

25 The 19 broad occupations used here are based upon Matthew Dev, Susan Houseman, and Anne Polivka, “What do we know about contracting out in the United States?” in Katharine Abraham, James Spletzer, and Mike Harper, eds, Labor in the new economy, NBER Studies in Income and Wealth (Chicago, IL: University of Chicago Press, 2010) and Abraham and Spletzer, “Are the new jobs good jobs”? Also note that the CPS changed its occupational classification system in 2003, and we use the same 19 categories to create a consistent time series of occupations for the CPS. As described in “Are the new jobs good jobs?” we had to make some adjustments to occupational groupings in the CPS, specifically managers, when bridging the change in occupational coding that occurred between 2002 and 2003.

26 Abraham and Spletzer in “Are the new jobs good jobs?” note that managers are defined differently in the Standard Occupational Classification System than in the older occupational coding system: in the SOC (but not in the older OES occupational coding system), managers are defined as those who devote at least 80 percent of their time to management activities. Changes in classification procedures by the state agencies who code the occupations for small establishments led to a sharp drop in the number of managers as the new classification system was implemented during the 1999 to 2001 time period. To compensate, Abraham and Spletzer randomly reassign enough of the highest paid nonmanagers in small establishments to the manager category to keep the fraction of workers in small establishments who are managers constant over time. While Abraham and Spletzer were concerned about trends in occupational employment, the interest in this paper is about trends in variance. We find that reassigning workers from other high wage occupations to management occupations leads to an inflation in wage variance for managers in the OES (likely because we are reclassifying the highest paid nonmanagers to the managerial occupation). We have conducted our analysis using occupations as originally reported and as recoded by Abraham and Spletzer; the substantive results we report in this article don’t change. The results we report in figures 8 and 9 are based on occupations as originally reported in the OES.

27 Katharine G. Abraham and James R. Spletzer, “New evidence on the returns to job skills,” American Economic Review papers and proceedings, May 2009, pp. 52–57.

28 Firpo, Fortin, and Lemieux, “Occupational tasks and changes in the wage structure.”

29 For example, Davis and Haltiwanger, “Wage dispersion between and within U.S. manufacturing plants;” Dunne, Foster, Haltiwanger, and Troske, “Wage and productivity dispersion in United States manufacturing;” and Barth, Bryson, Davis, and Freeman, “The dynamics of workplace wage inequality in the United States, 19772002.”

30 The censuses of employee data provided to the OES by federal and state governments are not broken out into establishments.

article image
About the Author

James R. Spletzer
james.r.spletzer@census.gov

James R. Spletzer is an economist in the Center for Economic Studies, U.S. Census Bureau.

Elizabeth Weber Handwerker
handwerker.Elizabeth@bls.gov

Elizabeth Weber Handwerker is a research economist in the Office of Employment and Unemployment Statistics, Bureau of Labor Statistics.

close or Esc Key