An official website of the United States government
An official website of the United States government
The .gov means it's official.
Federal government websites often end in .gov or .mil. Before sharing sensitive information,
make sure you're on a federal government site.
The site is secure.
The
https:// ensures that you are connecting to the official website and that any
information you provide is encrypted and transmitted securely.
Analysts of government policies in the labor market have long held that licensing laws which restrict the supply of labor cause an increase in wages, but there has been little analysis of the influence of regulation on the conditions of work. This article examines the influence of occupational licensing on the wages and workplace safety of electricians, one of the most regulated occupations directly involved in the construction industry.
Occupational licensing is among the fastest growing institutions in the U.S. economy. In the 1950s, about 4.5 percent of the workforce was licensed by state governments. By 2008 approximately 29 percent of the U.S. workforce was licensed by any level of government, and more than 800 occupations were licensed by at least one state in the 1990s.1 The latter statistic compared with about 12.4 percent of the workforce who said they were union members in the Current Population Survey (CPS) for the same year.2
Occupational regulation in the United States generally takes three forms. The least restrictive form is registration, in which individuals file their names, addresses, and qualifications with a government agency before practicing their occupation. The registration process may include posting a bond or filing a fee. In contrast, certification allows any person to perform the relevant tasks, but the government—or sometimes a private, nonprofit agency—administers an examination or another method to determine qualifications and certifies those who have achieved the level of skill and knowledge required for certification. The toughest form of regulation is licensure, often referred to as "the right to practice." Under licensure laws, working in an occupation for compensation without first meeting government standards is illegal. As examples of certification versus licensure, travel agents and car mechanics are generally certified but not licensed.
The focus of this article is the role of occupational licensing and other forms of government regulation for electricians, a heavily regulated occupation in the construction industry. Unlike previous work that examines the role of occupational licensing on wages, prices, and access to, and quality of, regulated services for consumers,4 The sections that follow examine whether occupational regulation complements current regulatory policies aimed at promoting workplace health and safety by reducing the occurrence and severity of occupational injuries.
Further, occupational licensing gives a standard method of providing a service that promotes the health and safety of the workforce. For example, about 10 percent of the class time of electricians training for licensure accreditation is spent in discussions of health and safety, and units in apprenticeship programs are devoted explicitly to health and safety.5 (see the accompanying box for illustrations of these requirements.) The expectation is that workers who have this background in safety from both classroom and on-the-job training would incur fewer workplace injuries and deaths. One of the objectives of this article is to examine in more detail the training required by occupational licensing, using electricians—a regulated occupation in the industry—as an example.
Training and qualifications for becoming an electrician
Each year of training for electricians includes at least 144 hours of classroom instruction and 2,000 hours of on-the-job training. In the classroom, apprentices learn electrical theory, blueprint reading, mathematics, electrical code requirements, and safety and first-aid practices. They also may receive specialized training in soldering, communications, fire alarm systems, and cranes and elevators.
On the job, apprentices work under the supervision of experienced electricians. At first, they drill holes, set anchors, and attach conduit. Later, they measure, fabricate, and install conduit and install, connect, and test wiring, outlets, and switches. They also learn to set up and draw diagrams for entire electrical systems. Eventually, they practice and master all of an electrician's main tasks.
Some people start their classroom training before seeking an apprenticeship. A number of public and private vocational–technical schools and training academies offer training to become an electrician. Employers often hire students who complete these programs and usually start them at a more advanced level than those without this training. A few people become electricians by first working as helpers—assisting electricians by setting up jobsites, gathering materials, and doing other nonelectrical work—before entering an apprenticeship program. All apprentices need a high school diploma or a General Educational Development (GED) certificate. Electricians also may need additional classes in mathematics because they solve mathematical problems on the job.
Education continues throughout an electrician's career. Electricians may need to take classes to learn about changes to the National Electrical Code®, and they often complete regular safety programs, manufacturer-specific training, and management training courses. Classes on such topics as low-voltage voice and data systems, telephone systems, video systems, and alternative energy systems (e.g., solar energy systems and wind energy systems) increasingly are being given as these systems become more prevalent. Other courses teach electricians how to become contractors.
Licensure. Most states and localities require electricians to be licensed. Although licensing requirements vary from state to state, electricians usually must pass an examination that tests their knowledge of electrical theory, the National Electrical Code, and local and state electric and building codes.
Electrical contractors who do electrical work for the public, as opposed to electricians who work for electrical contractors, often need a special license. In some states, electrical contractors need certification as master electricians. Most states require master electricians to have at least 7 years of experience as an electrician or a bachelor's degree in electrical engineering or a related field.
Source: Occupational Outlook Handbook (U. S. Bureau of Labor Statistics, March 29, 2012), https://www.bls.gov/ooh/construction-and-extraction/electricians.htm.
The focus of this article is electricians for three reasons: they are a key element in the construction workforce, they constitute the most regulated craft in the industry, and they contribute much to value added in the industry. About 80 percent of all electricians work in the construction industry, and about 695,000 were employed in the industry in 2008. Approximately 32 percent of all electricians are members of a union, with most belonging to the International Brotherhood of Electrical Workers. This percentage compares with about 13.8 percent of all construction workers who are represented by a union.6 As with other occupations prevalent in construction (e.g., plumbers and laborers), electricians' high level of unionization may raise wages, and the influence of unions on work rules is expected to be especially important within the occupation. As a consequence, unions also may contribute to reductions in occupational injuries. All states that license electricians require them to take classes on safety. Michigan, for example, requires apprentice electricians to present a plan of training in health and safety in order to become licensed.
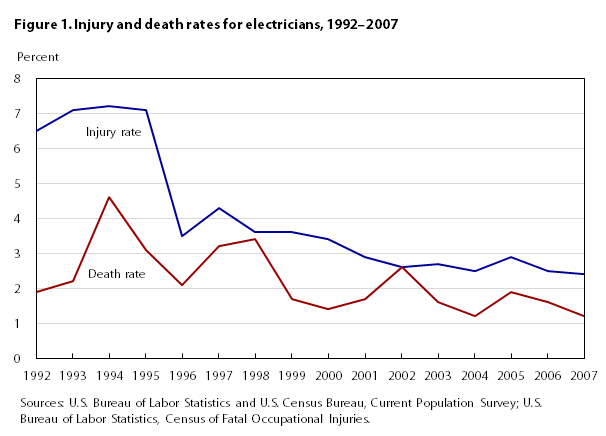
The number of deaths and injuries incurred by electricians is among the highest in the construction industry.7 However, as shown in figure 1, the death and injury rates for electricians declined from 1992 to 2007. A large decline took place in 1996, and following that steep fall there has been a steady decline in both deaths and injuries for electricians. According to the Center for Construction Research and Training's Center to Protect Workers' Rights (CPWR), the secular decline occurred for a number of reasons. First, from a public policy perspective, in 1993 the Occupational Safety and Health Administration (OSHA) set standards that were implemented during the 1993–1996 period. The standards required electricians to reduce their work with live circuits, increased the use of aerial lifts as opposed to stepladders, and introduced underground utility mapping and verification requirements.8
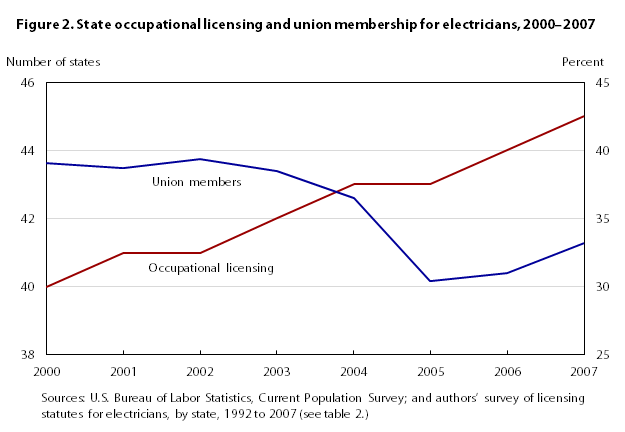
Second, as figure 2 shows, the number of states that require licensing for electricians at the state level has increased over time. During the same timeframe, unionization has declined in the occupation. Similar to national trends, the decline in the number and percentage of union members has occurred at the same time as the growth in the number of states covered by licensing:9 the number of states that license electricians grew from 38 to 45 from 2000 to 2007, while the percentage of electricians who are members of unions declined from 39.0 percent to 34.2 percent over the same period.
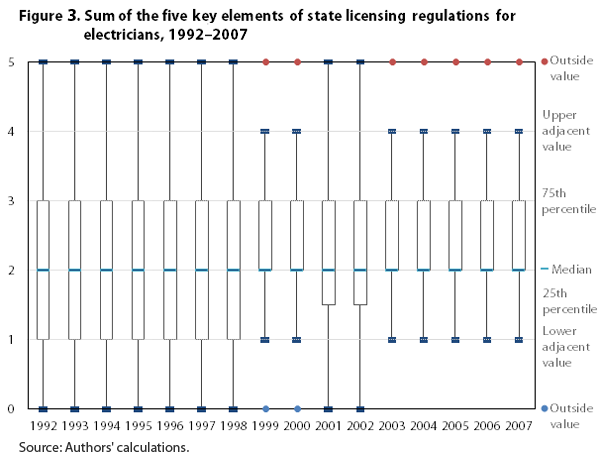
Third, not only has the level of licensing increased, but the process of becoming licensed has become more difficult. Conversations with key officials at the CPWR, as well as with focus groups composed of practitioners from the construction industry, have identified five central items as important in becoming licensed: a general age–education requirement, an apprenticeship, a written exam, a practical performance exam, and a continuing education requirement. These elements are the basis for constructing an index of the rigor of the licensing process, in addition to the type of licensing (i.e., state or local). Using a box-and-whisker graph of the sum of the five key elements of the licensing regulations for electricians, figure 3 traces the evolution of the intensity of the licensing index from 1992 through 2007. The results show an upward movement in the mean values, and a narrower spread in the variance, of the licensing provisions. More precisely, occupational licensing is growing among states and its provisions for entering and maintaining good standing as a licensed professional are becoming more stringent.
The path to becoming a licensed electrician generally involves 4 years of training and includes being an apprentice, a journeyman, and then a master electrician. (see the accompanying box for further details.) The path usually includes full-time work and going to school in the evening for classes several nights a week. Pass rates vary by region and often confer local licensing beyond the state-level regulations for each of the stages that lead to becoming a licensed electrician. About 10 percent of electricians then become contractors and open their own business. For states that license individuals, only licensed electricians can certify the quality of electrical work in construction and are allowed to perform wiring procedures on construction sites. Given this institutional background on the labor market for electricians and the pathways to becoming an electrician, there are related factors that might lead the workers to earn more, work under safer conditions, and reduce their number of job-related injuries.
This section begins by focusing on the theory of wage determination and then goes on to examine the role of occupational regulation in reducing work-related deaths and injuries. A starting point of the examination of wages and work injuries is Adam Smith's comments on compensating differentials for various types of work. Smith noted that workers will demand a compensating wage differential for jobs that are perceived as risky or otherwise unpleasant.10
The analysis of wage determination under licensing in construction builds on work by Jeffrey Perloff on the influence of licensing laws on wage changes in the construction industry.11 The basic model posits that market forces are largely responsible for wage determination in construction and that the industry is highly cyclical. Perloff presents two cases. In the first, there are no costs to shifting across industries, so the labor supply to the construction industry is completely elastic at the opportunity wage. In this case the increase in the demand for construction work would have little effect on wages, because workers would flow between the construction industry and other industries. (manufacturing would be the most likely substitute in the model.) In the other, extreme case, a licensing law renders the supply of construction labor inelastic. Here, labor cannot flow between the sectors, so variations in construction demand would be reflected in the construction wage. Empirically, Perloff shows that, for electricians, more so than for either laborers or plumbers, state regulations make the supply curve highly inelastic.12 Consequently, the ability of a state to limit entry or impose major costs on entry through licensing would enhance the occupation's ability to raise wages.
One additional issue that has been an important focus in construction and that was developed in the institutional labor market literature is the determination of the geography of markets. Researchers William Dickens and Kevin Lang argue that institutions in the labor market, such as unions or occupations, attempt to capture geographical rents.13 In the case of electricians, limiting the geographic area would result in greater control of the labor market and higher wages. Therefore, there is an incentive to limit the area to local licensing rather than expand the market to the state level. To the extent that the market has been expanded, it may have been done to increase employment, but that may have come at the expense of higher wages.
The issue of the role of occupational regulation in the reduction of deaths and injuries is less focused. A model presented by W. Kip Viscusi, Joseph E. Harrington, Jr., and John M. Vernon of the risk of injury or death can, in general, be represented as

where Riskt denotes the risk of injury or death at time t;  is a constant to be estimated;
  designates occupational regulation that includes the training, selection, and standardization effects of occupational licensing at time t – 1;
  is the coefficient of to be estimated;
  represents the cyclical effects in construction that include the boom of the early 2000s at time t;
  is the coefficient of to be estimated;
  denotes industry characteristics that include controls for whether the person was in the construction industry at time t;
  is the coefficient of to be estimated;
  designates human capital characteristics of the individual at time t;
  is the coefficient of to be estimated; and
  is the error term.14
An important issue in the occupational health and safety literature is whether regulations or standards pertaining to work are more effective than litigation, such as that brought by worker compensation laws, in reducing the incidence and severity of injuries and the incidence of deaths. Most analyses of standards such as OSHA legislation do not find that occupational regulations or standards are more effective in this regard.15 In contrast, many of the studies of worker compensation and its influence on the incidence and severity of injuries and on the incidence of deaths show a much larger impact. For example, Michael J. Moore and Viscusi show that worker compensation laws reduce job fatality rates by about one-third and are much more effective than setting standards.16 On the basis of these findings by Viscusi and his colleagues, one would expect that the effects of occupational regulations or standards on reducing injuries would be modest and that the influence of these policies, as in the case of OSHA legislation, will diminish with time.17
On the one hand, to the extent that licensing introduces standardization of procedures in electrical work that takes health and safety concerns into effect, the expectation is that regulation would reduce injuries and deaths. Specific programs such as apprenticeships, required classes on health and safety, and continuing education would all serve to reduce the likelihood of injuries at the workplace. Further, licensing eliminates the lower part of the quality distribution within the occupation through time-intensive classes and the costs of education; consequently, the likelihood of death and injuries would be diminished by keeping more careless individuals from working in the occupation. Further, through continuing education, only those individuals who have a commitment to the occupation and are willing to pay annual fees and go to seminars would stay in the occupation; they would also be more likely to have knowledge of the appropriate tasks to stay safe at the workplace. On the other hand, there may be innovations or technological changes that practitioners could pick up at the workplace or construction site and that reduce injuries or deaths, but they may not be applied because applying them does not fit into the standard method of doing things. Indeed, attempts at implementing unorthodox methods in response to technological change may result in loss of one's license.18
One final issue that helps define the role of occupational regulation in construction is the state or local political jurisdiction in place. In most jurisdictions, licensing for electricians is at the state level. However, some states have local licensing for electricians, and its regulations sometimes make it more difficult for workers to get licensed than ones at the state level. Cook County, which includes the city of Chicago, is often given as an example of more and tougher requirements than the ones at the state level. Given the pervasiveness of local licenses that may, in some cases, be more rigorous than the ones at the state level, it is worthwhile to examine the influence of local licenses regulating electricians. Consequently, the issue of whether the regulation of occupations matters in raising wages or reducing the injuries and deaths of electricians is an empirical issue taken up in the remainder of this article.
Data on regulation. A group of researchers working with funding from the Department of Labor was among the first groups to examine the role of occupational regulation in construction. In a study commissioned by the Department's Office of Research, Benjamin Shimberg, Barbara F. Esser, and Daniel H. Kruger analyzed the process of licensing (i.e., who is on the licensing board of the occupation in question and whether a state or local board should be regulating the occupation).19 They also examined whether the board was composed of political appointees, whether the pay was low, whether the board was dominated by members of the occupation, and whether it had public members. Other analyses also funded by the Department of Labor focused on the quality of work under occupational licensing.20 However, these studies did not examine some of the other important outcomes—that is, wages or health and safety issues—in the industry.
To examine which of these occupational issues dominates the determination of wages and of health and safety for electricians, a regulatory index was developed that captures the major elements of the statutes across states. Table 1 displays the key elements (and their operational definitions) of the licensing provisions in the statutes and administrative provisions for each of the states in the sample of electricians examined. Table 2 presents, by state, the various licensing statutes regulating electricians from 1992 to 2007. Note that changes in the key elements of the licensing provisions are given only for states with state licensing.21 For example, electricians in Illinois and New York were licensed at only the local level between 1992 and 2007, while those in Alaska were licensed at the state level, and the specific licensing provisions did not change.
| Variable | Definition |
|---|---|
License | 1 if license is required by state statute or local statute; otherwise 0 |
State license | 1 if license is required by state statute; otherwise 0 |
Local license | 1 if license is required by statute of local municipality; otherwise 0 |
Five major components | |
General requirements | 1 if a minimum level of education or age is required for licensure; otherwise 0 |
Apprentice codes | 1 if occupation-specific experience as apprentice (or an equivalent number of years of education) is required for licensure; otherwise 0 |
Written exam | 1 if a written exam is required for licensure; otherwise 0 |
Performance exam | 1 if a performance exam is required for licensure; otherwise 0 |
Continuing education | 1 if the state has any requirement for renewal of a license ; otherwise 0 |
| Source: Authors' survey of licensing statutes for electricians, by state, from 1992 to 2007. | |
| State | Year adopted | Type of licensing | General requirement | Apprenticeship | Written exam | Performance exam | Continuous education |
|---|---|---|---|---|---|---|---|
| Alabama | 1992 | S | 0 | 1 | 1 | 1 | 0 |
| Alaska | 1992 | S | 0 | 1 | 0 | 0 | 0 |
| Arizona | 1992 | S | 1 | 1 | 1 | 1 | 1 |
| Arkansas | 1992 | S | 0 | 1(1) | 1 | 0 | 0 |
| California | 1992 | S | 1 | 1 | 1 | 0 | 0 |
| Colorado | 1992 | S | 0 | 1(1) | 1 | 0 | 0 |
| Connecticut | 1992 | S | 1 | 1 | 1 | 0 | 0 |
| Delaware | 1992 | L | |||||
| 2000 | S | 0 | 1 | 1 | 0 | 1 | |
| District of Columbia | 1992 | S | 0 | 0 | 0 | 0 | 0 |
| 1999 | S | 0 | 1 | 1 | 0 | 0 | |
| Florida | 1992 | S | 1 | 1 | 1 | 0 | 0 |
| Georgia | 1992 | S | 1 | 1 | 1 | 0 | 0 |
| Hawaii | 1992 | S | 1 | 1 | 1 | 0 | 0 |
| Idaho | 1992 | S | 0 | 1 | 1 | 0 | 0 |
| 1999 | S | 1 | 1 | 1 | 0 | 0 | |
| Illinois | 1992 | L | |||||
| Indiana | 1992 | N | |||||
| Iowa | 1992 | L | |||||
| 2007 | S | 0 | 1 | 1 | 0 | 0 | |
| Kansas | 1992 | L | |||||
| Kentucky | 1992 | L | |||||
| 2001 | S | 0 | 1(1) | 0 | 0 | 0 | |
| Louisiana | 1992 | N | |||||
| 2004 | S | 0 | 0 | 1 | 0 | 0 | |
| Maine | 1992 | S | 0 | 1 | 1 | 0 | 0 |
| Maryland | 1992 | S | 1 | 1(1) | 1 | 0 | 0 |
| Massachusetts | 1992 | N | |||||
| 2007 | S | 1 | 1 | 1 | 0 | 1 | |
| Michigan | 1992 | S | 1 | 1 | 1 | 0 | 0 |
| Minnesota | 1992 | S | 0 | 1 | 1 | 0 | 0 |
| Mississippi | 1992 | S | 0 | 0 | 1 | 0 | 0 |
| Missouri | 1992 | L | |||||
| Montana | 1992 | S | 0 | 1(1) | 1 | 0 | 0 |
| Nebraska | 1992 | S | 0 | 1 | 0 | 0 | 0 |
| Nevada | 1992 | S | 1 | 1 | 1 | 0 | 0 |
| New Hampshire | 1992 | S | 0 | 1(1) | 1 | 0 | 0 |
| New Jersey | 1992 | S | 0 | 0 | 0 | 0 | 0 |
| 2003 | S | 1 | 1 | 1 | 0 | 0 | |
| New Mexico | 1992 | S | 1 | 1 | 1 | 0 | 0 |
| New York | 1992 | L | |||||
| North Carolina | 1992 | S | 1 | 1(1) | 0 | 0 | 0 |
| North Dakota | 1992 | S | 0 | 1(1) | 1 | 0 | 0 |
| Ohio | 1992 | S | 1 | 1 | 1 | 0 | 0 |
| Oklahoma | 1992 | S | 1 | 0 | 1 | 0 | 0 |
| 2002 | S | 1 | 1(1) | 1 | 0 | 0 | |
| Oregon | 1992 | S | 0 | 1 | 0 | 0 | 0 |
| Pennsylvania | 1992 | L | |||||
| Rhode Island | 1992 | S | 0 | 0 | 1 | 0 | 0 |
| 1998 | S | 1 | 1(1) | 1 | 0 | 0 | |
| South Carolina | 1992 | S | 0 | 0 | 1 | 0 | 0 |
| South Dakota | 1992 | S | 0 | 1 | 1 | 0 | 0 |
| Tennessee | 1992 | N | |||||
| 2000 | S | 0 | 0 | 1 | 0 | 0 | |
| Texas | 1992 | L | |||||
| 2003 | S | 0 | 1 | 1 | 0 | 0 | |
| Utah | 1992 | S | 0 | 1 | 1 | 0 | 0 |
| 2000 | S | 0 | 1(1) | 1 | 0 | 0 | |
| Vermont | 1992 | S | 0 | 1 | 1 | 0 | 0 |
| Virginia | 1992 | S | 0 | 0 | 1 | 0 | 0 |
| 1995 | S | 1 | 1(1) | 1 | 0 | 0 | |
| Washington | 1992 | S | 0 | 1 | 1 | 0 | 1 |
| 1999 | S | 0 | 1 | 1 | 0 | 0 | |
| West Virginia | 1992 | S | 0 | 1 | 1 | 0 | 0 |
| 1994 | S | 1 | 1(1) | 1 | 0 | 0 | |
| Wisconsin | 1992 | S | 0 | 1 | 1 | 0 | 0 |
| Wyoming | 1992 | S | 0 | 1(1) | 1 | 0 | 0 |
| 1994 | S | 1 | 1(1) | 1 | 0 | 1 | |
Notes: Note: S = state, L = local, N = none; definitions of specific components and their values are shown in table 1. Source: Authors' survey of licensing statutes for electricians, by state, from 1992 to 2007. | |||||||
Table 3 shows the growth in the number of items included in state statutes licensing electricians, by year, from 1992 through 2007. The estimates indicate that the occupation experienced growth in regulations governing the entry and training requirements for electricians. The level of the index, or the number of items included in the measure, grew from 2.11 to 2.38, or almost 13 percent, over the period. This change reflects the intensity of the growth of regulatory requirements for workers to enter and remain in the occupation of electrician.
| Year | Number of states | Index mean(1) | Standard deviation |
|---|---|---|---|
1992 | 38 | 2.11 | 0.98 |
1993 | 38 | 2.11 | .98 |
1994 | 38 | 2.18 | 1.04 |
1995 | 38 | 2.24 | 1.02 |
1996 | 38 | 2.24 | 1.02 |
1997 | 38 | 2.24 | 1.02 |
1998 | 38 | 2.29 | 1.01 |
1999 | 38 | 2.34 | .94 |
2000 | 40 | 2.33 | .94 |
2001 | 41 | 2.29 | .96 |
2002 | 41 | 2.32 | .96 |
2003 | 42 | 2.38 | .88 |
2004 | 43 | 2.35 | .90 |
2005 | 43 | 2.35 | .90 |
2006 | 43 | 2.35 | .90 |
2007 | 45 | 2.38 | .91 |
Total | 642 | 2.28 | .95 |
Notes: Source: Authors' survey of licensing statutes for electricians, by state, from 1992 to 2007. (See table 2.) | |||
In order to fully implement the aforementioned empirical estimation strategy, table 4 shows the states that changed licensing policies. For example, Iowa switched to state licensing from local regulations, and Louisiana changed from no licensing to state regulation of the occupation. A number of states, including populous states such as Illinois and New York, allow electricians to be regulated at the local level. Table 5 lists the states that ranked highest and lowest according to the index of regulation devised for this study.
| Status | Local licensing | No licensing | State licensing |
|---|---|---|---|
Stayers | Illinois, Kansas, Missouri, New York, Pennsylvania | Indiana | All other states |
Switchers | Delaware (to state licensing from 2000); Iowa (to state licensing from 2007); Kentucky (to state licensing from 2001); Texas (to state licensing from 2003) | Louisiana (to state licensing from 2004); Massachusetts (to state licensing from 2007); Tennessee (to state licensing from 2000) | ... |
| Source: Authors' survey of licensing statutes for electricians, by state, from 1992 to 2007. (See table 2.) | |||
| Top states | Sum of the five requirements | Bottom states | Sum of the five requirements | ||
|---|---|---|---|---|---|
| Arizona | 5 | Alaska | 1 | ||
| Massachusetts | 4 | Kentucky | 1 | ||
| Wyoming | 4 | Louisiana | 1 | ||
| Alabama and 17 States | 3 | Mississippi | 1 | ||
| Source: Authors' survey of licensing statutes for electricians, by state, from 1992 to 2007. (See table 2.) | |||||
Workplace safety data. Information on workplace safety for this article came from two sources of confidential data: the Survey of Occupational Injuries and Illnesses (SOII) and the Census of Fatal Occupational Injuries (CFOI). The Bureau of Labor Statistics (BLS, the Bureau) supervised retrieval of the data.22 To examine the role of occupational licensing in reducing serious nonfatal injuries, the BLS-administered SOII, a confidential establishment-level survey of nonfatal injuries, is used. The SOII collects data on nonfatal injuries reported by establishments in the private sector. Between 1992 and 2007, the SOII collected data from establishments in 39 states. Injuries are divided into three categories: injuries that cause an absence from work, injuries that cause a restriction of work or job transfer, and injuries that do not affect one's working capacity.23 What follows focuses on the first of these categories: cases involving injuries to workers ages 16 to 64 that resulted in an absence from work, as measured by "days away from work."24
To investigate fatal injuries, the CFOI, another confidential BLS-administered survey, was used. For consistency of the analysis, fatal injuries were restricted to those suffered by private sector workers ages 16 to 64 in all 50 states and the District of Columbia. Table 6 gives the key characteristics of the two datasets, and table 7 shows the major changes in those datasets' industry and occupation codes pertinent to selecting the sample for this article.
| Characteristic | SOII | CFOI |
|---|---|---|
Sampling | 39 states | 50 States and the District of Columbia |
| Nonfatal injuries and illnesses of private industry workers only | Includes private sector workers and workers of federal, state, and local government agencies | |
| Excludes the self-employed, farms with fewer than 11 employees, private households, and federal government agencies | Data on deaths are compiled from death certificates, workers' compensation reports, OSHA reports, medical examiner reports, newspaper articles, and other sources | |
| Includes employees in state and local government agencies for national estimates only | ||
Important changes | Change in the Standard Occupational Classification (SOC) and Standard Industrial Classification (SIC) systems in 2003 | Change in the SOC and SIC systems in 2003 |
| No longer reports on injuries separately from illnesses, starting with 2002 data | ||
| Source: U.S. Bureau of Labor Statistics, Survey of Occupational Injuries and Illnesses and Census of Fatal Occupational Injuries. | ||
| Classification code | 1992–2002 | 2003–2007 |
|---|---|---|
Industry codes | 1500 through 1799 under 1987 SIC | 23 (23600 through 23899) under 2003 NAICS |
Occupation codes for electricians | 555 Supervisors: electricians and power transmission installers | 47-2111 Electricians |
| 575 Electricians | 47-3013 Helpers—electricians | |
| 576 Electricians apprentices | ||
| 577 Electrical power-line installers and repairers | 49-9051 Electrical power-line installers and repairers | |
| Sources: U.S. Department of Labor, Standard Industrial Classification; U.S. Census Bureau, North American Industry Classification System; and U.S. Bureau of Labor Statistics, Standard Occupational Classification. | ||
Because the SOII and CFOI do not have the employment information, one important issue in building an uninterrupted time series for the subsequent analysis is to estimate the denominator (i.e., the employment within states in a given year) for computing both injury rates and death rates at the workplace. Employment for electricians in a state in a given year and injury and death rates by state and year are computed with the use of CPS Merged Outgoing Rotation Group (MORG) data from 1992 to 2007.25 Finally, the sample selection rules for this study (i.e., persons from the age of 16 to 64 working in the private sector) would necessarily produce death and injury rates different from those which are publicly available.
Table 8 summarizes the five leading causes of nonfatal injuries, and table 9 does the same with deaths. Not surprisingly, four of the five leading causes of death were electrocutions of one kind or another and explained about 55 percent of all deaths suffered by electricians; a variety of other causes, such as a fall from a ladder—the only cause that appears in both tables—resulted in nonfatal injuries.
| Cause and code | Weighted workplace injuries | Percentage of all weighted workplace injuries |
|---|---|---|
Total | 140,333 | 100.0 |
Overexertion in lifting (221) | 12,695 | 9.0 |
Fall from ladder (113) | 11,776 | 8.4 |
Bending, climbing, crawling, reaching, twisting (211) | 8,895 | 6.3 |
Struck against stationary object (012) | 7,650 | 5.5 |
Struck by slipping hand-held object (0232) | 7,374 | 5.3 |
Others | 91,943 | 65.5 |
| Source: U.S. Bureau of Labor Statistics, Survey of Occupational Injuries and Illnesses, 1992–2007. | ||
| Cause and code | Percentage of all weighted workplace deaths |
|---|---|
Total | 100.0 |
Contact with wiring, transformers, or other electrical components (3120) | 26.0 |
Contact with overhead power lines (3130) | 18.2 |
Fall from ladder (1130) | 5.8 |
Contact with electric current of machine, tool, appliance, or light fixture (3110) | 5.0 |
Contact with electric current, unspecified (3100) | 4.5 |
Others | 40.4 |
| Source: U.S. Bureau of Labor Statistics, Survey of Occupational Injuries and Illnesses, 1992–2007. | |
Figure 4 compares the days away from work, a measure of the severity of the injury, for electricians, a regulated occupation, with those for laborers, a construction occupation that was unregulated from 1992 to 2007. The figure highlights two findings. First, there are relatively small differences in the number of days away from work for each of the two occupations, which do very different tasks, but are both involved in difficult construction tasks at work. Second, most of the injuries sustained were relatively minor: 47.7 percent of injured electricians returned to work within 5 days, and 77 percent returned to work within a month. Injuries causing absence from work for more than 180 days were only 1.6 percent of the total.
Economic data. As a key part of the subsequent examination of the influence of regulation on the labor market, the analysis uses data from the CPS MORG. Table 10 presents the basic information from the database. The variables shown are standard variables from the MORG, including human capital variables such as gender, age, experience, education, race, part-time employment, union membership, and private or public sector for electricians. Wage models also were estimated with the use of information from the American Community Survey (ACS) from 2000 to 2007, with similar results found. Because the ACS has no information on unionization—an important element bearing on the influence of occupational licensing on wages and safety—only estimates from the CPS are presented.26
| Variable | n | Mean | Standard deviation |
|---|---|---|---|
Hourly earnings | 9,747 | 21.13 | 9.85 |
Gender (male = 1, female = 0) | 11,050 | .98 | .13 |
Age (years) | 11,050 | 37.09 | 10.91 |
Experience (Age – Years of school – 6) | 11,050 | 18.46 | 10.95 |
Experience squared | 11,050 | 4.61 | 4.68 |
Education: | |||
High school graduate | 11,050 | .46 | .50 |
Some college experience | 11,050 | .24 | .43 |
College degree or higher | 11,050 | .23 | .42 |
Married | 11,050 | .63 | .48 |
Race or ethnic origin: | |||
White | 11,050 | .92 | .27 |
Hispanic origin | 11,050 | .83 | .28 |
Part time | 11,050 | .02 | .15 |
Public sector (government) | 11,050 | .02 | .14 |
Union member | 9,748 | .37 | .48 |
| Source: U.S. Bureau of Labor Statistics and U.S. Census Bureau, Current Population Survey. | |||
The analysis begins with an estimate of the role of regulation in determining the wages of workers in construction, with an emphasis on electricians. The models presented here update and refine the work of Perloff.27 Next, estimates are calculated of the influence of occupational licensing on the incidence and severity of injuries to construction workers, and on the incidence of death for construction workers, again with a focus on electricians. Several tests are conducted of the robustness of these estimates, with various specifications and across databases and occupations.
Wage determination. The first model examined is an earnings model with licensing regulations. This basic model is given by
ln( , (2)
, (2)
where Earningsist denotes the hourly earnings of electricians i at state s in year t; is a constant to be estimated; Rst designates the licensing occupational regulations and the components of the regulations in person i's state s in year t;  are the coefficients of Rst to be estimated; Xist is the vector that includes covariate measuring characteristics of each person;
  are the coefficients of Xist to be estimated; δ and η are state and year fixed effects, respectively; and εist is the error term in the panel data.
Table 11 shows the results obtained from the preceding model of the influence of licensing on the wages of electricians. The model also takes into account the influence of unions on wage determination, because unions, too, are an important labor market institution in the construction industry. The results show no statistically significant impact of the measure of the overall index of licensing on earnings, although clearly, licensing matters in most of the specifications in the model. For example, the summated rating scale of licensing at the state-level variable is statistically significant, but the magnitude of the coefficient is small. Somewhat surprisingly, the value for local licensing is significant and positive for almost all of the specifications. The range of the coefficient is from 8 percent to 13 percent. Several of the specific entry requirements are significant. Local licensing regulations, such as those existing in Cook County, Illinois, can serve to raise the wages of electricians. In addition, the coefficients for the general requirements of age and education are significant, as are the coefficients for taking an exam and having an apprenticeship. These results are also consistent with the traditional industrial relations approach postulating that occupations can gain economic advantages by limiting the geographic market.28
| Variable | Model number | |||||||||||
|---|---|---|---|---|---|---|---|---|---|---|---|---|
| 1 | 2 | 3 | 4 | 5 | 6 | 7 | 8 | 9 | 10 | 11 | 12 | |
Union membership | – | 0.270(1) | – | 0.270(1) | – | 0.270(1) | 0.270(1) | 0.270(1) | 0.270(1) | 0.270(1) | 0.270(1) | 0.270(1) |
| ... | (.013) | ... | (.013) | ... | (.013) | (.013) | (.013) | (.013) | (.013) | (.013) | (.013) | |
State license | -.056(2) | .045(3) | -.007 | .013 | – | – | – | – | – | – | – | – |
| (.025) | (.024) | (.045) | (.041) | ... | ... | … | ... | ... | ... | ... | ... | |
Local license | – | – | .069 | .083(3) | .124(1) | .128(1) | .065(2) | .130(1) | .125(1) | .070(2) | .072(2) | .086(3) |
| ... | ... | (.052) | (.048) | (.032) | (.029) | (.029) | (.038) | (.030) | (.029) | (.030) | (.043) | |
Summated measures | – | – | – | – | .028(1) | .033(1) | – | – | – | – | – | – |
| ... | ... | ... | ... | (.009) | (.008) | ... | ... | ... | ... | ... | ... | |
General requirements | – | – | – | – | – | – | .087(1) | – | – | – | – | .077(2) |
| ... | ... | ... | ... | ... | ... | (.021) | ... | ... | ... | ... | (.036) | |
Apprenticeship Code | – | – | – | – | – | – | – | .064(2) | – | – | – | -.018 |
| ... | ... | ... | ... | ... | ... | ... | (.029) | ... | ... | ... | (.028) | |
Written exam | – | – | – | – | – | – | – | – | .070(2) | – | – | .044 |
| ... | ... | ... | ... | ... | ... | ... | ... | (.027) | ... | ... | (.028) | |
Performance exam | – | – | – | – | – | – | – | – | – | .004 | – | -.055 |
| ... | ... | ... | ... | ... | ... | ... | ... | ... | (.009) | ... | (.038) | |
Continuing education | – | – | – | – | – | – | – | – | – | – | .054 | .035 |
| ... | ... | ... | ... | ... | ... | ... | ... | ... | ... | (.037) | (.023) | |
Constant | 1.745(1) | 1.743(1) | 1.696(1) | 1.683(1) | 1.597(1) | 1.588(1) | 1.691(1) | 1.631(1) | 1.619(1) | 1.694(1) | 1.695(1) | 1.715(1) |
| (.121) | (.106) | (.129) | (.116) | (.124) | (.106) | (.098) | (.111) | (.107) | (.099) | (.099) | (.110) |
Basic controls | Yes | Yes | Yes | Yes | Yes | Yes | Yes | Yes | Yes | Yes | Yes | Yes |
State controls | Yes | Yes | Yes | Yes | Yes | Yes | Yes | Yes | Yes | Yes | Yes | Yes |
Year fixed | Yes | Yes | Yes | Yes | Yes | Yes | Yes | Yes | Yes | Yes | Yes | Yes |
State fixed | Yes | Yes | Yes | Yes | Yes | Yes | Yes | Yes | Yes | Yes | Yes | Yes |
R2 | .29 | .35 | .29 | .35 | .29 | .36 | .36 | .36 | .36 | .36 | .36 | .36 |
N | 9,724 | 9,724 | 9,724 | 9,724 | 9,724 | 9,724 | 9,724 | 9,724 | 9,724 | 9,724 | 9,724 | 9,724 |
Notes: (2) Significant at the 0.05 level. (3) Significant at the 0.10 level. Note: Standard error is shown in parentheses and is clustered by state. Basic controls include gender, age, experience, and experience squared. Dummy variables indicate high school graduates, those with some college experience, and those with a college degree or higher; married status; White race and Hispanic origin; part-time workers; and government workers. State controls include employment growth rate, unemployment rate, and rate of union coverage in the construction industry. Dash indicates variable not used in model. Source: Authors' calculations. | ||||||||||||
Table 12 presents the role of potential compensating wage differentials within the context of occupational licensing, injury rates, and workers' compensation insurance controls. The estimates suggest a small and statistically insignificant influence. Most of the other licensing variables maintain similar magnitudes and significance with the inclusion of both a measure of worker compensation insurance premiums and the rate of injury. Consistent with other estimates going back to Adam Smith, the tradeoff of higher wages for higher risk appears to be modest for the model and for the use of the CPS data.
| Variable | Model number | ||||||||
|---|---|---|---|---|---|---|---|---|---|
| 1 | 2 | 3 | 4 | 5 | 6 | 7 | 8 | 9 | |
Workers' compensation premium rate | -0.010 | -0.010 | -0.011 | -0.011 | -0.011 | -0.010 | -0.010 | -0.010 | -0.011 |
| (.007) | (.007) | (.007) | (.007) | (.007) | (.007) | (.007) | (.007) | (.007) | |
Injury rate | .008(1) | .008(1) | .008(1) | .008(1) | .008(1) | .008(1) | .008(1) | .008(1) | .008(1) |
| (.003) | (.003) | (.003) | (.003) | (.003) | (.003) | (.003) | (.003) | (.003) | |
Union membership | .261(2) | .261(2) | .261(2) | .261(2) | .261(2) | .261(2) | .261(2) | .261(2) | .261(2) |
| (.017) | (.017) | (.017) | (.017) | (.017) | (.017) | (.017) | (.017) | (.017) | |
State license | -1.056 | .021 | – | – | – | – | – | – | – |
| (.024) | (.040) | ... | ... | ... | ... | ... | ... | ... | |
Local license | – | .107(1) | .140(2) | .083(2) | .152(2) | .136(2) | .087(2) | .088(2) | .074(1) |
| ... | (.041) | (.021) | (.019) | (.043) | (.027) | (.019) | (.020) | (.032) | |
Summated measures | – | – | .031(2) | – | – | – | – | – | – |
| ... | ... | (.009) | ... | ... | ... | ... | ... | ... | |
General requirements | – | – | – | .111(2) | – | – | – | – | .016 |
| ... | ... | ... | (.030) | ... | ... | ... | ... | (.037) | |
Apprenticeship code | – | – | – | – | .069(2) | – | – | – | .-030(3) |
| ... | ... | ... | ... | (.041) | ... | ... | ... | (.016) | |
Written exam | – | – | – | – | – | .063(1) | – | – | .026 |
| ... | ... | ... | ... | ... | (.030) | ... | ... | (.030) | |
Performance exam | – | – | – | – | – | – | -.012 | – | -.014 |
| ... | ... | ... | ... | ... | ... | (.016) | ... | (.016) | |
Continuing education | – | – | – | – | – | – | – | .024 | .000 |
| ... | ... | ... | ... | ... | ... | ... | (.071) | (.049) | |
Constant | 1.752(2) | 1.679(2) | 1.605(2) | 1.702(2) | 1.634(2) | 1.631(2) | 1.712(2) | 1.698(2) | 1.716 |
| (.099) | (.108) | (.102) | (.096) | (.110) | (.106) | (.096) | (.095) | (.105) | |
Basic controls | Yes | Yes | Yes | Yes | Yes | Yes | Yes | Yes | Yes |
State controls | Yes | Yes | Yes | Yes | Yes | Yes | Yes | Yes | Yes |
Year fixed | Yes | Yes | Yes | Yes | Yes | Yes | Yes | Yes | Yes |
State fixed | Yes | Yes | Yes | Yes | Yes | Yes | Yes | Yes | Yes |
R2 | .33 | .33 | .33 | .33 | .33 | .33 | .33 | .33 | .33 |
N | 5,975 | 5,975 | 5,975 | 5,975 | 5,975 | 5,975 | 5,975 | 5,975 | 5,975 |
Notes: (2) Significant at the 0.01 level. (3) Significant at the 0.10 level. Note: Standard error is shown in parentheses and is clustered by state. Basic controls include gender, age, experience, and experience squared. Dummy variables indicate high school graduates, those with some college experience, and those with a college degree or higher; married status; White race and Hispanic origin; part-time workers; and government workers. State controls include employment growth rate, unemployment rate, and rate of union coverage in the construction industry. Dash indicates variable not used in model. Source: Authors' calculations. | |||||||||
Injury rates. The main part of the analysis in this section focuses on the incidence of injuries at the state level. After that, the model is expanded by including two more stringent measures of safety outcomes: days away from work due to injury or illness and the incidence of death at the state level. The basic model for the incidence of injuries sustained on the job can be stated as
 , (3)
, (3)
where Injury ratesst designates the rates of injuries sustained by electricians in state s in year t; is a constant to be estimated; Rst denotes the licensing occupational regulations and the components of the regulation in state s in year t; β are the coefficients of Rst to be estimated; Xst is the vector that includes covariate measuring characteristics of each state s; γ are the coefficients of Xst to be estimated; δ and η are state and year fixed effects, respectively; and εst is the error term.29
Table 13 shows the influence of licensing on the reporting of injuries. The overall summated rating scale reveals a positive influence, and several elements of the index, such as the general age and education requirements, apprenticeships, and continuing education, are all positively related to the incidence, or reporting, of workplace injuries. However, the existence of a performance exam is negatively related to workplace injuries. One reason for this negative relationship may be that licensing requires more reporting and keeping track of any type of work-related injury. The implementation of a licensing regime requires administrators to fill out a form that lists minor types of injuries.30
| Variable | Model number | ||||||||
|---|---|---|---|---|---|---|---|---|---|
| 1 | 2 | 3 | 4 | 5 | 6 | 7 | 8 | 9 | |
State license | -0.443 | -0.182 | – | – | – | – | – | – | – |
| (.952) | (.943) | ... | ... | ... | ... | ... | ... | ... | |
Local license | – | .420 | 2.625 | .420 | 3.121 | 1.359 | .592 | 1.171 | 1.982 |
| ... | (1.754) | (1.579) | (1.451) | (1.853) | (1.598) | (1.456) | (1.516) | (2.076) | |
Summated measures | – | – | 1.105(1) | – | – | – | – | – | – |
| ... | ... | (.478) | ... | ... | ... | ... | ... | ... | |
General requirements | – | – | – | 3.329(1) | – | – | – | – | 2.045 |
| ... | ... | ... | (1.305) | ... | ... | ... | ... | (1.445) | |
Apprenticeship code | – | – | – | – | 2.749(1) | – | – | – | 1.123(2) |
| ... | ... | ... | ... | (1.077) | ... | ... | ... | (.641) | |
Written exam | – | – | – | – | – | 1.244 | – | – | .124 |
| ... | ... | ... | ... | ... | (1.227) | ... | ... | (1.245) | |
Performance exam | – | – | – | – | – | – | -4.579(3) | – | .241 |
| ... | ... | ... | ... | ... | ... | (.948) | ... | (2.371) | |
Continuing education | – | – | – | – | – | – | – | 1.629(2) | 1.086 |
| ... | ... | ... | ... | ... | ... | ... | (.885) | (.848) | |
Constant | 3.743 | 2.240 | -2.080 | 1.415 | -1.789 | .483 | 6.593 | 2.157 | -.205 |
| (4.373) | (4.671) | (4.793) | (4.177) | (4.560) | (4.854) | (4.427) | (4.104) | (4.523) | |
Basic controls | Yes | Yes | Yes | Yes | Yes | Yes | Yes | Yes | Yes |
State controls | Yes | Yes | Yes | Yes | Yes | Yes | Yes | Yes | Yes |
Year fixed | Yes | Yes | Yes | Yes | Yes | Yes | Yes | Yes | Yes |
State fixed | Yes | Yes | Yes | Yes | Yes | Yes | Yes | Yes | Yes |
R2 | .41 | .41 | .42 | .41 | .41 | .41 | .41 | .41 | .42 |
N | 620 | 620 | 620 | 620 | 620 | 620 | 620 | 620 | 620 |
Notes: (2) Significant at the 0.10 level. (3) Significant at the 0.01 level. Note: Standard error is shown in parentheses and is clustered by state. Basic controls include proportions of population ages 20 to 24, 25 to 34, 35 to 44, 45 to 54, and 55 to 64; proportions of married, White, and other (i.e., non-Black) non-White people; and proportions of high school graduates, those with some college experience, and those with a college degree or higher. State controls include laborers' injury rate, employment growth rate,unemployment rate, and rate of union coverage in the construction industry. Dash indicates variable not used in model. Source: Authors' calculations. | |||||||||
Severity of injuries at the individual level. This section uses information from the SOII on the duration of time away from work because of workplace injuries to examine the severity of injuries at the individual level. The model can be stated as
 , (4)
, (4)
where Severity of injuryist is measured by the number of days away from work because of injury to or illness of individual electrician i in state s in year t; is a constant to be estimated; Rst represents the licensing occupational regulations and the components of the regulation in person i's state s in year t; β are the coefficients of Rst to be estimated; Xist is the vector that includes covariate measuring characteristics of both each injured or ill person and the state where the person was injured; γ are the coefficients of Xist to be estimated; δ and η are state and year fixed effects, respectively; and εist is the error term.
Model (4) is a Weibull survival model; the Weibull distribution is a commonly used estimation method in the unemployment and workers' compensation literature.31 Note that some of the information needed to create the control variables pertaining to these individuals from the SOII is different from the information appearing in the wage equations. The estimates for the severity of injuries sustained by electricians from the hazard analysis are presented in table 14. In contrast to the positive estimates presented in the previous table, Table 14 shows that licensing has no significant impact on the time it takes to return to work following an injury. The coefficient for a performance exam indicates a reduction in the duration of being away from work. The only other licensing provision that increases the severity of an injury is the continuing education variable. The estimates show no general influence of the role of licensing on the days away from work in the fixed-effect models.
| Variable | Model number | ||||||||
|---|---|---|---|---|---|---|---|---|---|
| 1 | 2 | 3 | 4 | 5 | 6 | 7 | 8 | 9 | |
State license | -0.018 | -0.229 | – | – | – | – | – | – | – |
| (.075) | (.184) | ... | ... | ... | ... | ... | ... | ... | |
Local license | – | -.149 | .106 | .070 | .210(2) | -.019 | .072 | .083 | .411(3) |
| ... | (.188) | (.081) | (.055) | (.116) | (.110) | (.054) | (.053) | (.116) | |
Summated measures | – | – | .020 | – | – | – | – | – | – |
| ... | ... | (.030) | ... | ... | ... | ... | ... | ... | |
General requirements | – | – | – | .028 | – | – | – | – | -.366(3) |
| ... | ... | ... | (.062) | ... | ... | ... | ... | (.136) | |
Apprenticeship code | – | – | – | – | .137 | – | – | – | .469(3) |
| ... | ... | ... | ... | (.112) | ... | ... | ... | (.050) | |
Written exam | – | – | – | – | – | -.118 | – | – | -.171 |
| ... | ... | ... | ... | ... | (.125) | ... | ... | (.124) | |
Performance exam | – | – | – | – | – | – | -.139(2) | – | -.135 |
| ... | ... | ... | ... | ... | ... | (.094) | ... | (.091) | |
Continuing education | – | – | – | – | – | – | – | .158(3) | .168(3) |
| ... | ... | ... | ... | ... | ... | ... | (.045) | (.056) | |
Constant | -.748(3) | -.637(2) | -.916(3) | -.857(3) | -.991(3) | -.735(4) | -.716(4) | -.863(3) | -.991(3) |
| (.272) | (.310) | (.316) | (.271) | (.313) | (.307) | (.306) | (.273) | (.318) | |
Basic controls | Yes | Yes | Yes | Yes | Yes | Yes | Yes | Yes | Yes |
State controls | Yes | Yes | Yes | Yes | Yes | Yes | Yes | Yes | Yes |
Year fixed | Yes | Yes | Yes | Yes | Yes | Yes | Yes | Yes | Yes |
State fixed | Yes | Yes | Yes | Yes | Yes | Yes | Yes | Yes | Yes |
Logarithm of likelihood | -266,510 | -266,502 | -266,526 | -266,528 | -266,509 | -266,514 | -266,529 | -266,510 | -266,426 |
N | 20,745 | 20,745 | 20,745 | 20,745 | 20,745 | 20,745 | 20,745 | 20,745 | 20,745 |
Notes: (2) Significant at the 0.10 level. (3) Significant at the 0.01 level. (4) Significant at the 0.05 level. Note: Unstandardized coefficients are shown. Standard error is shown in parentheses and is clustered by state. Basic controls include age, age squared, gender, and dummy variables indicating four different groupings of length of service and four different groupings of race. State controls include laborers' injury rate, employment growth rate, unemployment rate, and rate of union coverage in the construction industry. Dash indicates variable not used in model. Source: Authors' calculations. | |||||||||
Death rates. The final model investigated tests for the role of occupational regulation on the death rates of electricians. The model can be stated as
 , (5)
, (5)
where Death ratesst denotes the death rates of electricians in state s in year t; is a constant to be estimated; Rst designates the licensing occupational regulations and the components of regulation in state s in year t; β are the coefficients of Rst to be estimated; Xst is the vector that includes covariate measuring characteristics of each state s; δ and η are state and year fixed effects, respectively; and εst is the error term.
Table 15 shows that measures of occupational regulation have little influence on the death rates of electricians in construction. The overall measure of regulation is negative and does not rise to the level of statistical significance. Although the coefficient of the performance exam is statistically significant, as hypothesized, the components of the government regulations are not significant in reducing the death rates of electricians. As with the OSHA results discussed earlier, regulations seem to have little effect on safety and health.32
| Variable | Model number | ||||||||
|---|---|---|---|---|---|---|---|---|---|
| 1 | 2 | 3 | 4 | 5 | 6 | 7 | 8 | 9 | |
State license | -0.848 | 0.045 | – | – | – | – | – | – | – |
| (.882) | (.533) | ... | ... | ... | ... | ... | ... | ... | |
Local license | – | 1.478 | 1.333 | 1.408 | .578 | 1.524 | 1.435 | 1.377 | -.267 |
| ... | (1.495) | (1.704) | (1.348) | (1.685) | (1.671) | (1.348) | (1.531) | (2.031) | |
Summated measures | – | – | -.056 | – | – | – | – | – | – |
| ... | ... | (.312) | ... | ... | ... | ... | ... | ... | |
General requirements | – | – | – | .482 | – | – | – | – | 1.519 |
| ... | ... | ... | (1.024) | ... | ... | ... | ... | (1.567) | |
Apprenticeship code | – | – | – | – | -.931 | – | – | – | -2.025(1) |
| ... | ... | ... | ... | (.812) | ... | ... | ... | (.812) | |
Written exam | – | – | – | – | – | .144 | – | – | .687 |
| ... | ... | ... | ... | ... | (.997) | (1.005) | |||
Performance exam | – | – | – | – | – | 5.806(1) | 1.918 | ||
| ... | ... | ... | ... | ... | (3.160) | (2.318) | |||
Continuing education | – | – | – | – | – | -.170 | -.521 | ||
| ... | ... | ... | ... | ... | (.830) | (1.093) | |||
Constant | .354 | -.662 | -.388 | -.716 | .753 | -.796 | -6.414 | -.614 | -.814 |
| (4.431) | (4.442) | (4.145) | (4.002) | (4.198) | (4.446) | (5.372) | (4.057) | (4.012) | |
Basic controls | Yes | Yes | Yes | Yes | Yes | Yes | Yes | Yes | Yes |
State controls | Yes | Yes | Yes | Yes | Yes | Yes | Yes | Yes | Yes |
Year fixed | Yes | Yes | Yes | Yes | Yes | Yes | Yes | Yes | Yes |
State fixed | Yes | Yes | Yes | Yes | Yes | Yes | Yes | Yes | Yes |
R2 | .21 | .21 | .21 | .21 | .21 | .21 | .21 | .21 | .21 |
N | 809 | 809 | 809 | 809 | 809 | 809 | 809 | 809 | 809 |
Notes: Note: Standard error is shown in parentheses and is clustered by state. Basic controls include proportions of population ages 20 to 24, 25 to 34, 35 to 44, 45 to 54, and 55 to 64; proportions of married, White, and other (i.e., non-Black) non-White people; and proportions of high school graduates, those with some college experience, and those with a college degree or higher. State controls includes laborers' injury rate, employment growth rate, unemployment rate, and rate of union coverage in the construction industry. Dash indicates variable not used in model. Source: Authors' calculations. | |||||||||
A final set of estimates examines the issue of endogeneity to the extent that high levels of deaths and injuries may have influenced the passage of state or locally based occupational licensing laws. Table 16 shows the hazard ratios from a Weibull survival model. The estimates on prior deaths and injuries and on prior worker compensation rates were not statistically significant, indicating an absence of this kind of simultaneity bias.33 Although there may be unobservable factors that contributed both to the passage of licensing laws and to wages and safety in the workplace, they were unavailable and hence out of the scope of the analysis.
| Variable | Model number | |||||
|---|---|---|---|---|---|---|
| 1 | 2 | 3 | 1 | 2 | 3 | |
| From no licensing to state licensing | From local licensing to state licensing | |||||
Injury ratet | 1.315 | 1.250 | 0.846 | 0.816 | ||
| (.240) | (.227) | (.100) | (.102) | |||
Injury ratet-1 | 1.047 | .941 | 1.129 | 1.084 | ||
| (.309) | (.241) | (.268) | (.141) | |||
Workers' compensation premium ratet | 1.049 | 1.930 | .874 | 1.930 | ||
| (.316) | (3.704) | (.246) | (3.704) | |||
Workers' compensation premium ratet-1 | 1.015 | .551 | .910 | .551 | ||
| (.274) | (1.077) | (.198) | (1.077) | |||
Union coverage ratet | .851(2) | .778 | .807(2) | .778 | ||
| (.833) | (.213) | (.100) | (.213) | |||
Union coverage ratet-1 | .899(2) | 1.098 | .883(3) | 1.098 | ||
| (.538) | (.246) | (.039) | (.246) | |||
χ2 | 4.22 | 19.72 | (4) | 6.82 | 10.66 | 249.23 |
Prob > χ2 | .23 | .00 | ... | .08 | .01 | .00 |
Log pseudolikelihood | 19.01 | 17.77 | 19.33 | 18.49 | 17.32 | 18.89 |
N | 67 | 60 | 60 | 91 | 82 | 82 |
Notes: (2) Significant at the 0.10 level. (3) Significant at the 0.01 level. (4) Not shown because the estimate was regarded as not reliable under the parameters set by the state. Note: Hazard ratios are shown; standard error is shown in parentheses and is clustered by state. Source: Authors' calculations. | ||||||
THE GENERAL ISSUE OF OCCUPATIONAL REGULATION has particular relevance to the health and safety of electricians, whose occupational deaths are among the most of any blue-collar occupation. In addition, construction occupations are among those which suffer the highest injury rates. The main focus of the research presented in this article has been the development of a model of how licensing influences both the determination of wages and health and safety in the workplace. The analysis yields multivariate estimates linking various levels of state or local occupational regulation to levels of, and changes in, occupational injuries and deaths of electricians.
The main finding of the article is that licensing increased significantly for electricians at the state level from 1992 to 2007. The analysis documents that growth state by state. Another finding is that, in general, occupational regulation has had a significant effect on wage determination at both the state and local level. Further, there is a small and imprecisely estimated wage premium for the incidence of work-related injuries.
Finally, the results obtained for the incidence of injury and death and for the severity of injury rates and death rates show that the impact of occupational regulation on deaths and injuries is statistically insignificant or indeterminate in the multivariate analysis. The estimates presented provide a first approximation of, and new data bearing on, the relationship among occupational licensing, wages, and death and injuries for an important occupation in the construction industry. The hope is that further analysis with additional data and different analytical techniques will identify and clarify the role that occupational regulation has in determining the wages and working conditions of regulated occupations.
ACKNOWLEDGMENTS: We thank Anthony Barkume, Jing Cai, Hwikwon Ham, Sally Kleiner, and Brooks Pierce, as well as the Upjohn Institute for Employment Research, the U.S. Bureau of Labor Statistics, the University of Minnesota, participants in seminars at Cornell University, and attendees of the 22nd annual meeting of the Society for the Advancement of Socio-Economics, held at Temple University in Philadelphia, Pennsylvania, on June 24–26, 2010. This study was funded in part by the Upjohn Institute for Employment Research and the Center for Construction Research and Training.
Morris M. Kleiner and Kyoung Won Park, "Life, limbs, and licensing: occupational regulation, wages, and workplace safety of electricians, 1992–2007," Monthly Labor Review, U.S. Bureau of Labor Statistics, January 2014, https://doi.org/10.21916/mlr.2014.1
1 See Pamela L. Brinegar and Kara L. Schmitt, "State occupational and professional licensure," in The book of the states, 1992–1993 (Lexington, KY: Council of State Governments, 1992), pp. 567–580; Morris M. Kleiner and Alan B. Krueger, "Analyzing the extent and influence of occupational licensing on the labor market," Journal of Labor Economics, April 2013, pp. S173–S202, also available as paper read at the Princeton Data Improvement Initiative, Princeton, NJ, 2008.
2 Barry T. Hirsch and David A. Macpherson, Union membership and coverage database from the CPS, 2011, http://www.unionstats.com.
3 See Lawrence Shepard, "Licensing restrictions and the cost of dental care,"Journal of Law and Economics, vol. 21, no. 1, 1978. pp. 187–201; Ronald S. Bond, John E. Kwoka, Jr., John J. Phelan, and Ira Taylor Whitten, Staff report on effects of restrictions on advertising and commercial practice in the professions: the case of optometry (Washington, DC: U.S. Bureau of Economics, September 1980); Carolyn Cox and Susan Foster, The costs and benefits of occupational regulation (Washington, DC: U.S. Bureau of Economics, October 1990); and Morris M. Kleiner and Richard M. Todd, "Mortgage broker regulations that matter: analyzing earnings, employment, and outcomes for consumers," in David Autor (ed.), Studies of labor market intermediation (Chicago: University of Chicago Press, 2009).
4 For data on fatal injuries, see the relevant charts from the Census of Fatal Occupational Injuries (U.S. Bureau of Labor Statistics, 2009), https://www.bls.gov/iif/oshwc/cfoi/cfch0008.pdf.
5 Xiuwen Dong, Yurong Men, & Elizabeth Haile, Work-related fatal and nonfatal injuries among U.S. construction workers, 1992–2003 (Silver Spring, MD: Center to Protect Workers' Rights, 2005).
6 See Hirsch and Macpherson, Union membership; and Census of Fatal Occupational Injuries.
7 For data on fatal injuries, see the relevant charts from the Census of Fatal Occupational Injuries.
8 Xiuwen Dong, Xuanwen Wang, and Brett Herleikson, Work-related fatal and nonfatal injuries among U.S. construction workers, 1992–2008 (Washington, DC: Center to Protect Workers' Rights, 2010).
9 Morris M. Kleiner and Alan B. Krueger, "The prevalence and effects of occupational licensing." British Journal of Industrial Relations, vol. 48, no. 4, 2010, pp. 676–687.
10 Adam Smith, The wealth of nations, Modern Library Edition (New York: Random House, 1937, originally published 1776).
11 Jeffrey M. Perloff, "The impact of licensing laws on wage changes in the construction industry," Journal of Law and Economics, vol. 23, no. 2, 1980, pp. 409–428.
12 Ibid.
13 William Dickens and Kevin Lang, "Labor market segmentation theory: reconsidering the evidence," NBER Working Paper No. 4087 (Cambridge, MA: National Bureau of Economic Research, June 1992).
14 W. Kip Viscusi, Joseph E. Harrington, Jr., and John M. Vernon, Economics of regulation and antitrust, 4th ed. (Cambridge, MA: MIT Press, 2005).
15 See Smith, The wealth of nations; and Viscusi, Harrington, and Vernon, Economics of regulation and antitrust.
16 Michael J. Moore and W. Kip Viscusi, Compensation mechanisms for job risks: wages, workers' compensation, and product liability (Princeton, NJ: Princeton University Press, 1990).
17 Wayne Gray and John M. Mendeloff, "The declining effects of OSHA inspections on manufacturing injuries, 1979 to 1998," Industrial and Labor Relations Review, vol. 58, no. 4, July 2005, pp. 571–587.
18 An example is an innovation such as plastic wiring, which may benefit from a different safety protocol than copper wiring does, but the licensing authority may require the older procedures. The delays involved in formulating and implementing an official protocol may lead to workplace injuries for electricians.
19 Benjamin Shimberg, Barbara F. Esser, and Daniel H. Kruger, Occupational licensing: practices and policies (Washington, DC: Public Affairs Press, 1973).
20 See, for example, Sidney L. Carroll and Robert J. Gaston, "Occupational restrictions and the quality of service received: some evidence," Southern Economic Journal, vol. 47, no. 4, 1981, pp. 959–976.
21 It is not feasible to track all the changes in the licensing provisions in the ordinances of city, county, and administrative provisions for states with only local licensing statutes. Consequently, the table gives complete information on whether electricians are licensed at the state or local level, but only partial information on specific provisions of the key elements of the occupational regulations at levels below the state level.
22 For detailed information, see Injuries, illnesses, and fatalities (U.S. Bureau of Labor Statistics), https://www.bls.gov/iif).
23 Ibid.
24 Starting with 2002 data, the SOII no longer reports injuries separately from illnesses. The change in the measure should have no effect on the analysis presented here, because illnesses have accounted for less than 2 percent of nonfatal injuries and illnesses discussed in BLS reports. (See Dong, Men, and Haile, Work-related fatal and nonfatal injuries.)
25 The data were downloaded from http://www.nber.org/morg/annual. The injury rate and death rate are computed as follows: Injury rate = (Sum of the weight for the national estimate from the SOII/Estimated employment of electricians from the CPS MORG) × 100; Death rate = (Actual number of deaths from the CFOI/Estimated employment of electricians from the CPS MORG) × 10,000.
26 Wage determination models were estimated from the ACS without controls for unionization. Results were similar to those presented in tables 11 and 12.
27 Perloff, "The impact of licensing laws."
28 Selig Perlman, A Theory of the Labor Movement (New York: Macmillan, 1928).
29 The state-level control variables were aggregated with the use of the individual variables from the CPS MORG data. The same state-level control variables are also included in empirical analyses of the state death rates.
30 Another rationale for these findings is that the use of state fixed effects may serve to inflate the values of the coefficients. None of the licensing coefficients are significant in models without state fixed effects.
31 See, for example, Richard Butler and John Worrall, "Workers' compensation: benefit and injury claims rates in the seventies," Review of Economics and Statistics, vol. 65, no. 4, 1983, pp. 580–589.
32 David Weil, "Assessing OSHA performance: new evidence from the construction industry," Journal of Policy Analysis and Management, vol. 20, no. 4, 2001, pp. 651–674.
33 The same models were used with the death rate, and with both injury rates and death rates, of electricians in construction to test for the presence or absence of simultaneity bias. The results were qualitatively similar to those shown in table 16.