An official website of the United States government
An official website of the United States government
The .gov means it's official.
Federal government websites often end in .gov or .mil. Before sharing sensitive information,
make sure you're on a federal government site.
The site is secure.
The
https:// ensures that you are connecting to the official website and that any
information you provide is encrypted and transmitted securely.
Job Openings and Labor Turnover Survey (JOLTS) data showed continued improvement of the labor market in 2013. Job openings, hires, and separations all increased in 2013, although none returned to their prerecession levels. Data (not seasonally adjusted) show that the average monthly number of job openings—a measure of labor demand—increased from 3.7 million in 2012 to 3.9 million in 2013, which was still below the monthly average of 4.5 million in 2007. Hires and separations—measures of worker flows—grew more slowly. From 2012 to 2013, the average monthly number of hires increased from 4.4 million to 4.5 million. The average monthly number of total separations rose from 4.2 million in 2012 to 4.3 million in 2013.
Three components make up the JOLTS total separations measure: quits, layoffs and discharges, and other separations (such as retirements, transfers, deaths, and separations caused by disability). From 2012 to 2013, the average monthly number of quits increased from 2.1 million to 2.3 million. During that same period, the average monthly number of layoffs and discharges edged down to 1.7 million in 2013. Average monthly other separations increased from 342,000 to 355,000.
December 2013 marked 54 months since the end of the most recent recession; during that time, layoffs and discharges was the only JOLTS measure that had returned to or exceeded its prerecession levels or rates.
The JOLTS program measures job openings, hires, total separations, quits, layoffs and discharges, and other separations on a monthly basis by industry1 and geographic region.2 JOLTS measures labor demand and worker flows by collecting data monthly from a sample of approximately 16,000 nonfarm business and government establishments. Published JOLTS data are available from December 2000 forward. In this report, JOLTS annual totals and monthly averages of annual totals are not seasonally adjusted. Data for a specific month are seasonally adjusted. This article analyzes trends in JOLTS data in 2013 as well as how these data compare to those during the most recent recession.
Job openings reflected an expansion in labor demand during 2013. Over the year, the average monthly number of job openings—measured on the last business day of the reference month—increased 6.5 percent, from 3.7 million in 2012 to 3.9 million in 2013. However, growth of job openings slowed in 2013 compared with previous years; the average monthly number of job openings increased 13.8 percent in 2012 and 13.1 percent in 2011.
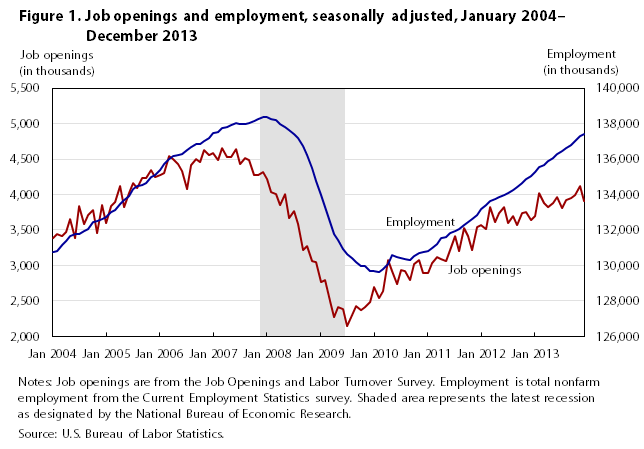
Job openings are a procyclical measure of labor demand. That is, they tend to increase during economic expansions and decline during economic contractions. Job openings and nonfarm payroll employment from the Current Employment Statistics (CES)3 survey tend to move in a similar pattern, with changes in job openings leading changes in employment by a few months (see figure 1). The number of job openings peaked at 4.7 million in March 2007 and then declined to 4.3 million by the official start of the recession in December 2007. Employment peaked a month later at 138.4 million in January 2008. The number of job openings declined to a series low of 2.1 million in July 2009, one month after the official end of the recession. Employment continued to decline after the end of the recession, reaching a low point in February 2010. Both series have shown steady growth since 2010. Annual data since 2001 show that JOLTS job openings and CES employment tend to have similar growth trends over the business cycle, with job openings leading employment slightly during both upturns and downturns of the business cycle (see table 1).
| Year | Average monthly number of job openings (in thousands) | Percent change from previous year | Average monthly CES employment (in thousands) | Percent change from previous year |
|---|---|---|---|---|
| 2001 | 4,267 | (1) | 132,074 | 0.0 |
| 2002 | 3,431 | -19.6 | 130,628 | -1.1 |
| 2003 | 3,272 | -4.6 | 130,318 | -.2 |
| 2004 | 3,583 | 9.5 | 131,749 | 1.1 |
| 2005 | 4,045 | 12.9 | 134,005 | 1.7 |
| 2006 | 4,413 | 9.1 | 136,398 | 1.8 |
| 2007 | 4,477 | 1.4 | 137,936 | 1.1 |
| 2008 | 3,654 | -18.4 | 137,170 | -.6 |
| 2009 | 2,434 | -33.4 | 131,233 | -4.3 |
| 2010 | 2,851 | 17.1 | 130,275 | -.7 |
| 2011 | 3,225 | 13.1 | 131,842 | 1.2 |
| 2012 | 3,671 | 13.8 | 134,104 | 1.7 |
| 2013 | 3,911 | 6.5 | 136,368 | 1.7 |
Notes: (1) JOLTS data are not available prior to December 2000, so there are no annual data for the previous year. Source: Job Openings and Labor Turnover Survey and Current Employment Statistics survey, U.S. Bureau of Labor Statistics. | ||||
Even though the number of job openings had not returned to the level posted at the beginning of the most recent recession, job openings had increased 82.4 percent since the series trough in July 2009 through December 2013.
Job openings by region and industry. Job openings among regions differed slightly in their overall trends in 2013, but most regions experienced similar growth since the end of the recession. The average monthly job openings rate increased in most regions and was unchanged in the Northeast. The West experienced the largest increase in its average monthly rate, rising from 2.5 in 2012 to 2.8 in 2013.
By December 2013, the openings rate in the Midwest, South, and West had increased 73.3, 70.6, and 64.7 percent, respectively, since their recessionary low points. In comparison, the rate for the Northeast had grown 44.4 percent since its recessionary low point in July 2009.
In 2013, the average monthly job openings rate increased for a majority of industries. The retail trade industry experienced the largest increase in the average monthly job openings rate, rising from 2.4 percent in 2012 to 3.0 percent in 2013. Other industries with strong growth included finance and insurance, construction, and transportation, warehousing, and utilities. The federal government experienced the largest decrease in the average monthly job openings rate, falling from 2.4 percent in 2012 to 1.9 percent in 2013. Other industries that experienced a decline were real estate and rental and leasing, health care and social assistance, durable goods manufacturing, nondurable goods manufacturing, professional and business services, and information.
By December 2013, the job openings rates in most industries remained below their rates from December 2007, the beginning of the recession. Retail trade, durable goods manufacturing, and construction were the only industries that exceeded their rates from the beginning of the recession.
Job openings and unemployment. The ratio of unemployed people per job opening is calculated by dividing the level of unemployment from the Current Population Survey (CPS)4 by the number of job openings. The ratio changes over time, tending to rise during recessions and fall during expansionary times. The ratio has trended downward since its high point of 6.8 in July 2009, one month after the end of the recession. Over the year, the ratio declined from 3.3 in January 2013 to 2.6 in December 2013. However, this is still higher than the ratio at the beginning of the recession in December 2007 when it was 1.8 (see figure 2).
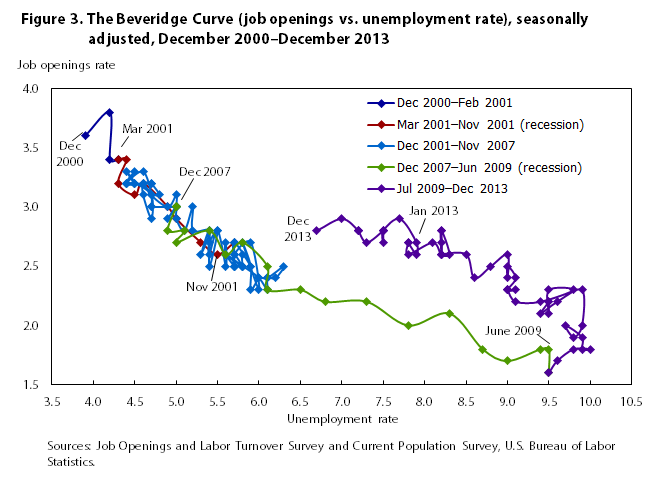
The Beveridge curve illustrates the inverse relationship between unfilled labor demand (as measured by the job openings rate) and unused labor supply (as measured by the unemployment rate) over time. The curve plots the intersection of the job openings rate and the unemployment rate, producing a downward-sloping curve. The curve reflects the state of the economy in two ways: through movements along the curve or through shifts in the curve toward or away from the origin. Movements along the curve are attributed to cyclical changes in the economy. High job openings and low unemployment result in a position high and to the left on the curve and generally indicate a period of economic expansion. Low job openings and high unemployment result in a position low and to the right on the curve and generally indicate a period of economic contraction. Movements of the curve itself may indicate structural changes in the economy. A greater difference between the job openings rate and the unemployment rate—lower job-matching efficiency—cause the curve to shift away from the origin.
In 2013, points on the Beveridge curve moved slightly upward and to the left as the job openings rate increased from 2.7 in January to 2.8 in December and the unemployment rate fell from 7.9 in January to 6.7 in December; this kind of movement typically is an indication of an expansionary period (see figure 3).
From the start of the recent recession in December 2007 through the middle of 2009, the economy’s position along the Beveridge curve moved lower and farther to the right as the job openings rate declined and the unemployment rate rose. From mid-2009 through 2010, job openings increased while the unemployment rate remained high. This caused the curve to move vertically, shifting outward from the origin. Since 2011, points moved upward and to the left but largely remained along this new position. The shift of the curve since the end of the recession has led to debate among economists about whether the changes in the postrecession labor market are due to cyclical factors, structural factors, or a combination of both.5
A report from the Congressional Budget Office attributed the 2-percent increase in unemployment since the end of 2007 to both cyclical and structural factors.6 The report found that cyclical economic weakness and structural factors—including the stigma of long-term unemployment, lower job-matching efficiency, and increased unemployment insurance benefits—contributed almost equally to the rise in the unemployment rate.
Analyses by economists show that short-term unemployment has largely returned to prerecession levels, while long-term unemployment remains elevated.7 Ghayad and Dickens of the Federal Reserve Bank of Boston disaggregated the unemployment-openings relationship by industry, age, education, duration of unemployment, and blue- and white-collar occupations. They found that duration of unemployment was the only metric that showed different patterns in the movement of the Beveridge curve. The curve had shifted outward for the long-term unemployed (longer than 26 weeks), but the curve had not shifted for the short-term unemployed.8
Similarly, research from Krueger, Cramer, and Cho shows that long-term unemployment increased as a result of fewer job openings during the most recent recession. They found that the long-term unemployed have a historically slower rate of reemployment, which accounts for the shift in the Beveridge curve. These researchers suggest that the curve will return to its original position as long-term unemployment falls, primarily as those workers exit the labor force.9
The total number of hires increased 3.5 percent from 2012 to 2013, rising from 52.4 million to 54.2 million. Following the recession, the number of hires increased steadily each year from 2010 to 2013 (see table 2).
| Year | Number of hires (in thousands) | Percent change from previous year | Annual hires rate (percent) |
|---|---|---|---|
| 2001 | 62,633 | (1) | 47.4 |
| 2002 | 58,479 | -6.6 | 44.8 |
| 2003 | 56,949 | -2.6 | 43.7 |
| 2004 | 60,263 | 5.8 | 45.7 |
| 2005 | 62,951 | 4.5 | 47.0 |
| 2006 | 63,327 | .6 | 46.4 |
| 2007 | 62,104 | -1.9 | 45.0 |
| 2008 | 54,745 | -11.8 | 39.9 |
| 2009 | 45,931 | -16.1 | 35.0 |
| 2010 | 48,743 | 6.1 | 37.4 |
| 2011 | 50,295 | 3.2 | 38.1 |
| 2012 | 52,360 | 4.1 | 39.0 |
| 2013 | 54,191 | 3.5 | 39.7 |
Notes: (1) JOLTS data are not available prior to December 2000, so there are no annual data for the previous year. Source: Job Openings and Labor Turnover Survey, U.S. Bureau of Labor Statistics. | |||
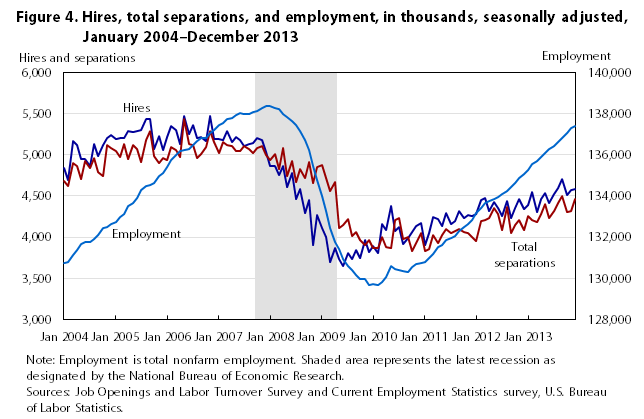
There were 4.6 million hires in December 2013, which was still below the level of 5.0 million at the beginning of the recession in December 2007. By December 2013, hires had risen 25.5 percent since the series trough of 3.6 million in June 2009, the last month of the recession (see figure 4). By comparison, job openings rose more quickly, increasing 63.9 percent over that same time period.
Hires by region and industry. The annual hires rate increased slightly in all four regions in 2013, but each region’s rate remained below its prerecession rate.
In 2013, the hires rate increased in many industries but fell in others (see figure 5). Retail trade experienced the largest increase in the hires rate, rising from 47.1 percent in 2012 to 51.6 percent in 2013. The number of hires in the retail trade industry grew 791,000 from 2012 to 2013. Construction experienced the largest decrease in the hires rate, falling from 70.3 in 2012 to 65.5 in 2013. The number of hires in construction fell 151,000 from 2012 to 2013. In December 2013, all industries remained below their prerecession rates.
The JOLTS measure of total separations, also referred to as turnover, is composed of quits, layoffs and discharges, and other separations. Overall, the number of total separations increased 3.5 percent from 2012 to 2013, rising from 50.1 million to 51.8 million. However, total separations is a dynamic measure since each component has unique trends and cyclical movements (see table 3).
| Year | Number of total separations (in thousands) | Percent change from previous year | Annual total separations rate (percent) |
|---|---|---|---|
| 2001 | 64,472 | (1) | 48.8 |
| 2002 | 59,003 | -8.5 | 45.2 |
| 2003 | 56,970 | -3.4 | 43.7 |
| 2004 | 58,238 | 2.2 | 44.2 |
| 2005 | 60,494 | 3.9 | 45.1 |
| 2006 | 61,117 | 1.0 | 44.8 |
| 2007 | 60,838 | -.5 | 44.1 |
| 2008 | 58,227 | -4.3 | 42.4 |
| 2009 | 51,127 | -12.2 | 39.0 |
| 2010 | 47,750 | -6.6 | 36.7 |
| 2011 | 48,220 | 1.0 | 36.6 |
| 2012 | 50,070 | 3.8 | 37.3 |
| 2013 | 51,837 | 3.5 | 38.0 |
Notes: (1) JOLTS data are not available prior to December 2000, so there are no annual data for the previous year. Source: Job Openings and Labor Turnover Survey, U.S. Bureau of Labor Statistics. | |||
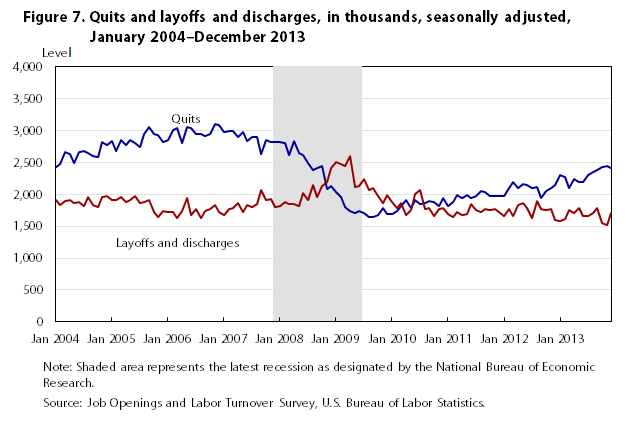
Quits are voluntary separations initiated by the employee, and they serve as a measure of a worker’s willingness or ability to leave a job. Quits are procyclical, meaning they typically rise when the economy expands and fall when the economy contracts, probably because these workers feel more confident about being able to find another job. In contrast, layoffs and discharges are countercyclical, rising during economic contractions and falling during economic expansions. Layoffs and discharges are generally involuntary separations initiated by the employer. Other separations include separations due to retirement, death, and disability, as well as transfers to another location of the same firm. In 2013, quits accounted for 53.3 percent of total separations, layoffs and discharges made up 38.5 percent, and other separations were 8.2 percent (see figures 6 and 7).
In 2013, the number of quits exceeded the number of layoffs and discharges in all but four industries (see table 4). However, it is typical for layoffs and discharges to outnumber quits in construction and arts, entertainment, and recreation because of the project-based and seasonal nature of the work. In contrast, layoffs and discharges outnumbered quits for all but four industries in 2009, a year that included the recession and its immediate aftermath.
| Industry | Quits (in thousands) | Layoffs and discharges (in thousands) | Percentage by which layoffs outnumber quits |
|---|---|---|---|
| Total nonfarm | 27,619 | 19,964 | -27.7 |
| Construction | 1,180 | 2,328 | 97.3 |
| Educational services | 399 | 418 | 4.8 |
| Arts, entertainment, and recreation | 567 | 868 | 53.1 |
| Federal government | 136 | 157 | 15.4 |
| Source: Job Openings and Labor Turnover Survey, U.S. Bureau of Labor Statistics. | |||
Quits. The total number of quits rose 10.1 percent from 2012 to 2013, increasing from 25.1 million to 27.6 million. The growth in 2013 followed an increase of 6.6 percent from 2011 to 2012. Through December 2013, the number of quits had risen 47.2 percent from the series trough of 1.6 million in August 2009 (see table 5).
| Year | Number of quits (in thousands) | Percent change from previous year | Total annual quits rate (percent) | Average monthly CES employment (in thousands) | Percent change from previous year |
|---|---|---|---|---|---|
| 2001 | 35,848 | (1) | 27.1 | 132,074 | 0.0 |
| 2002 | 31,758 | -11.4 | 24.3 | 130,628 | -1.1 |
| 2003 | 29,192 | -8.1 | 22.4 | 130,318 | -.2 |
| 2004 | 31,375 | 7.5 | 23.8 | 131,749 | 1.1 |
| 2005 | 34,240 | 9.1 | 25.6 | 134,005 | 1.7 |
| 2006 | 35,596 | 4.0 | 26.1 | 136,398 | 1.8 |
| 2007 | 34,566 | -2.9 | 25.1 | 137,936 | 1.1 |
| 2008 | 30,355 | -12.2 | 22.1 | 137,170 | -.6 |
| 2009 | 21,030 | -30.7 | 16.0 | 131,233 | -4.3 |
| 2010 | 22,057 | 4.9 | 16.9 | 130,275 | -.7 |
| 2011 | 23,533 | 6.7 | 17.8 | 131,842 | 1.2 |
| 2012 | 25,081 | 6.6 | 18.7 | 134,104 | 1.7 |
| 2013 | 27,619 | 10.1 | 20.3 | 136,368 | 1.7 |
Notes: (1) JOLTS data are not available prior to December 2000, so there are no annual data for the previous year. Source: Job Openings and Labor Turnover Survey and Current Employment Statistics survey, U.S. Bureau of Labor Statistics. | |||||
In 2013, the annual quits rate increased in all four regions and in a majority of industries. Professional and business services experienced the largest increase in the annual quits rate, rising from 24.5 percent to 28.5 percent. The total number of quits in the professional and business services industry increased 907,000 from 2012 to 2013. The mining and logging industry experienced the largest decrease in the annual quits rate, falling from 22.9 percent to 19.4 percent. The number of quits in mining and logging decreased 26,000 from 2012 to 2013. The quits rate fell in three other industries, but none experienced a decline greater than 0.3 percentage point (see figure 8).
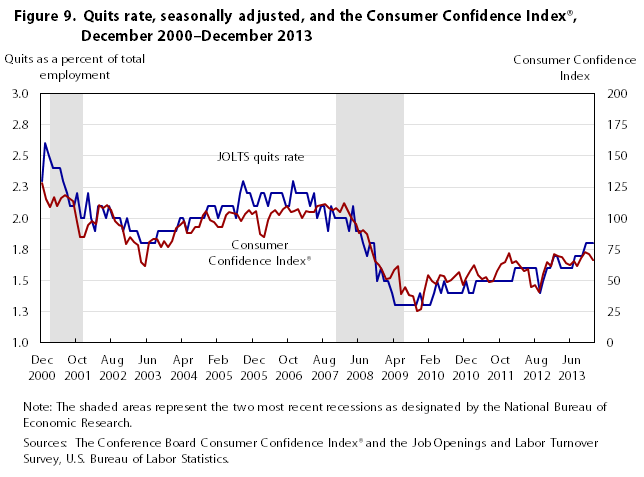
Quits generally serve as a measure of workers’ willingness or ability to leave a job. Quits rise during an economic expansion because workers are more confident in their ability to find another job or have more flexibility to leave the workforce. For this reason, quits usually track similarly to the Conference Board’s Consumer Confidence Index®, which measures consumers’ perceptions of business and employment conditions (see figure 9).
Layoffs and discharges. The total number of layoffs and discharges fell from 20.9 million in 2012 to 20.0 million in 2013, the lowest annual level in the history of the JOLTS series, which dates back to 2000. Total layoffs and discharges decreased 4.4 percent from 2012 to 2013, after little change from 2011 to 2012. Through December 2013, the number of layoffs and discharges declined 34.3 percent from its recessionary peak of 2.6 million in April 2009 (see table 6).
| Year | Number of layoffs and discharges (in thousands) | Percent change from previous year | Annual layoffs and discharges rate (percent) |
|---|---|---|---|
| 2001 | 24,138 | (1) | 18.3 |
| 2002 | 22,706 | -5.9 | 17.4 |
| 2003 | 23,490 | 3.5 | 18.0 |
| 2004 | 22,668 | -3.5 | 17.2 |
| 2005 | 22,243 | -1.9 | 16.6 |
| 2006 | 20,896 | -6.1 | 15.3 |
| 2007 | 21,958 | 5.1 | 15.9 |
| 2008 | 24,028 | 9.4 | 17.5 |
| 2009 | 26,444 | 10.1 | 20.2 |
| 2010 | 21,829 | -17.5 | 16.8 |
| 2011 | 20,805 | -4.7 | 15.8 |
| 2012 | 20,892 | .4 | 15.6 |
| 2013 | 19,964 | -4.4 | 14.6 |
Notes: (1) JOLTS data are not available prior to December 2000, so there are no annual data for the previous year. Source: Job Openings and Labor Turnover Survey, U.S. Bureau of Labor Statistics. | |||
The annual rate of layoffs and discharges fell in three regions but rose slightly in the West. At the industry level, the annual rate of layoffs and discharges fell in many industries but rose in others. The construction industry experienced the greatest decrease in the layoffs and discharges rate, declining from 49.0 percent in 2012 to 40.0 percent in 2013. The total number of layoffs and discharges in construction fell 441,000 from 2012 to 2013. Other industries with a large decrease in rate included arts, entertainment, and recreation; professional and business services; and other services. In contrast, information experienced the largest increase in the layoffs and discharges rate, rising from 10.3 in 2012 to 11.7 in 2013. The number of layoffs and discharges in information increased 29,000 from 2012 to 2013. Other industries with a large rate increase were federal government and finance and insurance.
Other separations. The total number of other separations grew from 4.1 million in 2012 to 4.3 million in 2013, an increase of 3.8 percent. By comparison, other separations rose 5.6 percent from 2011 to 2012. Data from additional sources suggest that an increase in retirements may be primarily responsible for the growth in other separations. Data from the Social Security Administration showed an increase in the number of new retirees receiving Social Security benefits and a decrease in new disabled workers in 2013. Additionally, research by Fujita of the Federal Reserve Bank of Philadelphia found that 80 percent of the decline in the labor force participation rate from the first quarter of 2012 through the end of 2013 was due to retirements.10 These data may indicate that workers are feeling financially secure enough to retire (see table 7).
| Year | Number of other separations (in thousands) | Percent change from previous year | Annual other separations rate (percent) |
|---|---|---|---|
| 2001 | 4,483 | (1) | 3.4 |
| 2002 | 4,539 | 1.2 | 3.5 |
| 2003 | 4,288 | -5.5 | 3.3 |
| 2004 | 4,192 | -2.2 | 3.2 |
| 2005 | 4,012 | -4.3 | 3.0 |
| 2006 | 4,626 | 15.3 | 3.4 |
| 2007 | 4,312 | -6.8 | 3.1 |
| 2008 | 3,845 | -10.8 | 2.8 |
| 2009 | 3,654 | -5.0 | 2.8 |
| 2010 | 3,864 | 5.7 | 3.0 |
| 2011 | 3,882 | .5 | 2.9 |
| 2012 | 4,100 | 5.6 | 3.1 |
| 2013 | 4,254 | 3.8 | 3.1 |
Notes: (1) JOLTS data are not available prior to December 2000, so there are no annual data for the previous year. Source: Job Openings and Labor Turnover Survey, U.S. Bureau of Labor Statistics. | |||
JOLTS DATA SHOW that the labor market continued to improve in 2013. As in recent years, the number of job openings rose, showing an increased demand for labor. Gains in the levels of worker flows—hires and separations—were not as large. The number of quits rose each year following the recession, showing workers’ increased confidence in the economy and perceived ability to leave their jobs. Layoffs and discharges reached the lowest annual level in the history of the JOLTS series in 2013. Job openings, hires, total separations, quits, and other separations remained below their prerecession levels, but all JOLTS elements showed improvement in 2013.
Megan Sweitzer, "Job openings continue to rise in 2013," Monthly Labor Review, U.S. Bureau of Labor Statistics, May 2014, https://doi.org/10.21916/mlr.2014.20
1 The term “industry” can refer to a supersector, sector, or subsector, depending on the context. In analyzing “industries,” the JOLTS program follows the North American Industrial Classification System.
2 The most detailed geographical breakout the JOLTS sample can provide is by region: the Northeast, the South, the Midwest, and the West.
3 Data on employment are available from the Current Employment Statistics program at https://www.bls.gov/ces/.
4 Data on unemployment are available from the Current Population Survey program at https://www.bls.gov/cps/.
5 See, for example, Peter Diamond, “Cyclical unemployment, structural unemployment,” National Bureau of Economic Research working paper 18761, February 2013, http://www.nber.org/papers/w18761.pdf.
6 Congressional Budget Office, “The slow recovery of the labor market,” February 2014, http://www.cbo.gov/sites/default/files/cbofiles/attachments/45011-LaborMarketReview.pdf.
7 See, for example, M. Henry Linder, Richard Peach, and Robert Rich, “The long and short of it: the impact of unemployment duration on compensation growth,” Liberty Street Economics, February 12, 2014, http://libertystreeteconomics.newyorkfed.org/2014/02/the-long-and-short-of-it-the-impact-of-unemployment-duration-on-compensation-growth-.html and Economic Report of the President, transmitted to the Congress March 2014, http://www.whitehouse.gov/sites/default/files/docs/full_2014_economic_report_of_the_president.pdf.
8 Rand Ghayad and William Dickens, “What can we learn by disaggregating the unemployment–vacancy relationship,” Public Policy Briefs, no. 12-3, October 2012, http://www.bostonfed.org/economic/ppb/2012/ppb123.pdf.
9 Alan B. Krueger, Judd Cramer, and David Cho, “Are the long-term unemployed on the margins of the labor market?” Economic Studies at Brookings, March 10, 2014.
10 Shigeru Fujita, “On the causes of declines in the labor force participation rate,” Research Rap, February 6, 2014.