An official website of the United States government
An official website of the United States government
The .gov means it's official.
Federal government websites often end in .gov or .mil. Before sharing sensitive information,
make sure you're on a federal government site.
The site is secure.
The
https:// ensures that you are connecting to the official website and that any
information you provide is encrypted and transmitted securely.
Data from the Current Population Survey (CPS) have documented the dramatic change in the demographic composition of the U.S. labor force over the last 50 years. With higher birth rates and higher labor force participation rates, Hispanics have become an increasingly large share of the workforce, accounting for nearly 9.0 percent of the labor force in 1990, 12.0 percent in 2000, and 15.0 percent in 2010 and are projected to account for 19.0 percent in 20201 and 30.0 percent by 2050.2 The racial composition of the labor force has changed as well. Whites accounted for 78.0 percent of the labor force in 1990, 72.0 percent in 2000, and 67.5 percent in 2010 and are projected to account for only 62.0 percent in 2020.3 Although immigration rates have slowed since 2005, foreign-born adults still comprised 42.0 percent of total labor force growth between then and 2010 and account for 16.4 percent of the total civilian labor force in the United States in 2012 (up from 5.0 percent in 1970 and 9.0 percent in 1990).4
Concurrent with the growing diversity of the labor force is an increase in research to investigate whether and how employment trends and job characteristics differ across race and ethnic groups and between foreign-born and U.S.-born populations. Studies that have focused on employed adults have found evidence of a wide variation in the type of employment, occupations, and job characteristics by race and ethnicity5 and nativity.6 Even within education and skill level, wage disparities exist.7 Until recently, much of this research focused on men and on earnings.8 Studies of job quality among working parents from a single race, ethnicity,9 or country of origin10 exist. However, except for two recent reports (which did not undergo peer review) that examine individual job characteristics11 (one by Glynn on unadjusted [bivariate] rates of access to paid leave and schedule flexibility and the other by Clemans-Cope et al. on rates of health insurance by firm size and work arrangement and by race and ethnicity, using the 2005 CPS Contingent Work Supplement), few studies of parental job quality focus on race and ethnicity or immigration. To our knowledge, no large sample studies have been conducted that nationally represent employed parents either by race and ethnicity or by immigration status or that nationally represent foreign-born employed parents by subgroup.
This gap in the literature is important because racial and ethnic minorities and foreign-born persons represent an increasing proportion of not only the adult labor force but also U.S. children.12 In 2011, 43 percent of U.S. children were from a minority group and nearly a quarter lived in families in which at least one parent was born outside the United States.13 Therefore, the working conditions of minority and foreign-born parents will have an increasing influence on the living conditions, and thus the well-being and development, of U.S. children. In a context of substantial disparities in children’s opportunities and achievement,14 understanding the characteristics and quality of jobs held by employed parents and their distribution is critical.
This article seeks to address this gap. Using a pooled 5-year sample of the Annual Social and Economic Supplement (ASEC) to the CPS from 2007 through 2011, we assess whether minority and foreign-born working parents are less likely to have access to economic resources through their jobs than White and U.S.-born working parents. This article contributes to the literature by examining an understudied but important group of American workers—parents—and by assessing whether certain racial and ethnic subgroups and/or foreign-born workers have less access to jobs that facilitate working parents’ ability to economically support their children.
Nativity and racial and ethnic disparities in job characteristics
Numerous studies over the last four decades have found racial and ethnic disparities in wages after controlling for a range of human capital variables.15 Hispanics and particularly Hispanic women are most likely to have low-wage jobs,16 and Black workers have less wage security than do White worHkers.17 Black and Hispanic workers are significantly less likely to have access to employer-sponsored health insurance, pensions or retirement accounts,18 or employer-provided life insurance.19 Using CPS data, Schmitt finds that 42 percent of Black and 46 percent of Hispanic workers have access to employer-provided health insurance, compared with 57 percent of White workers. Similarly, while 25 percent of Black workers and 40 percent of Hispanic workers have access to employer-sponsored pension benefits, 53 percent of White workers have access.20
Research also has documented disparities in job characteristics between foreign-born and U.S.-born workers. Foreign-born adults’ lower average levels of education and sometimes limited English proficiency explain much of their vulnerability to low-wage jobs.21 Although about one-fourth of foreign-born adults work in highly skilled jobs with good wages and benefits, more than half of foreign-born workers (56 percent) are employed in low-skilled jobs, compared with 46 percent of their U.S.-born counterparts.22 Foreign-born workers also are less likely to have access to employer-provided health insurance;23 daytime, standard work schedules;24 and safe and healthy job conditions.25
Empirical studies also have found that the effect of being born outside the United States on job mobility varies by cohort and duration in the United States, evidence consistent with assimilation theory, which posits that each successive generation of new entrants to the United States will become more fully integrated into American society.26 Moreover, evidence suggests that the effect of assimilation into the labor market and into better jobs could differ by race and ethnicity. This “segmented assimilation model” highlights the heterogeneity among the foreign-born and argues that the outcomes of foreign-born individuals and the speed with which they integrate will be influenced by social factors as well as human capital variables.27 This model posits that social context could result in downward as well as upward assimilation; for example, foreign-born racial and ethnic minority groups could face discrimination and barriers to social mobility resulting in assimilation into disadvantaged segments of the U.S. population over time and generations. Research on foreign-born individuals has demonstrated the variation in patterns, paths, and speeds of assimilation by race and ethnicity28 and country of origin.29 Lack of sample size and longitudinal data sources has limited the extent to which the interaction between race and ethnicity and immigration status has been examined.
Focus on working parents
In this article, we focus on disparities in job quality among working adults who are also parents. Economic theory and evidence suggest that disparities in this population not only influence the distribution of health and well-being of employees, a matter of serious concern,30 but may also affect the well-being of the employees’ children. Economic models of children’s attainments posit that while society, parents, and children themselves help determine child health and well-being through decisions about the allocation of resources, parental investments in children—which are influenced by parents’ job quality—are of primary importance.31 The level of parental investment in children is determined in part by parents’ decisions regarding the amount, nature, and quality of family resources allocated to children versus to consumption or savings; the allocation of time between work and leisure; fertility and family size; location of residence, household structure; parenting style; and the type of home environment they provide, among others.
What aspects of a parent’s job would influence his or her ability to make important investments in their children? The main job characteristic affecting parents’ ability to make economic investments is the salary or wage rate, specifically, whether the income earned is sufficient to cover the costs involved in raising and providing for children. A number of such measures of a minimum-wage level for families have been developed. One such threshold is computed using an estimated “basic family budget”32 or the income necessary to purchase a minimal bundle of goods and services needed for a family’s daily living—including housing, transportation, groceries, childcare, and healthcare. Other commonly used absolute thresholds include the percentage or multiple of the family size-adjusted federal poverty level, federal or state minimum wage,33 or the inflation-adjusted median hourly pay for the typical male in 1979, a historical high point. These measures, however, do not specifically account for the needs of working parents to invest in their children and, therefore, can overestimate the fraction of jobs paying adequate wages to cover a basic family budget.34 Another approach is the relative wage or “social inclusion” approach that defines the threshold as a percentage of the distribution of wages in the population, such as an annual income of at least 60 percent of the median national household income.35
Whether a job provides access to an employer-sponsored retirement plan is likely to affect parents’ labor market behavior in ways that affect the income available for investment in their children. Without access to a pension or retirement plan, parents may compensate by increasing investments in retirement savings, leaving less discretionary income available for investing in children, or by increasing total work hours, reducing potential time available for children. In the longer term, parents with access to a pension could be more economically self-sufficient as older adults and rely less on their children for support and, in the best case, would be able to provide economic resources to their young adult and adult children.
Access to affordable, employer-sponsored health insurance coverage, to the extent that it enables parents to receive healthcare services, increases the chances that they will remain healthy enough to work and earn income, reducing the amount of family economic resources spent on their own health-related expenses and potentially raising the income available to invest in children’s healthy development. Because of economies of scale, healthcare offered through employers is less costly than purchasing private health insurance, thereby increasing discretionary income available for investments in children.
Several other job characteristics affect the time parents have to invest in their children. Total work hours, the shift and timing of those hours, and the stability of those hours continuously and regularly affect the quantity and quality of time available for children. A growing evidence base suggests an association between a number of aspects of parental work and child and family well-being that include access to paid sick leave,36 paid parental leave,37 schedule flexibility,38 employment stability,39 and sufficient income.40
In this study, we focus on three of the many important aspects of jobs that facilitate parental investment in children’s well-being that are available in our data source: (1) paying a wage that is at or above the threshold for covering a family’s basic necessities, (2) providing access to health insurance coverage, and (3) providing access to a pension plan. Given the substantial disparities in children’s opportunities and attainments,41 the important role of parental investments in determining children’s outcomes, and the likely influence that parental job characteristics have on the ability of parents to invest in their children, one must understand the characteristics of jobs held by employed parents and their distribution by race and ethnicity and nativity.
Data
In this study, we use the March 2007–2011 ASEC to the CPS, a monthly survey of approximately 99,000 households that measures demographic and labor force characteristics. The CPS sample represents the noninstitutionalized U.S. population ages 16 and older and is administered in English, Spanish, or other languages, as needed. The CPS interviews a sample of households once a month for 4 consecutive months. Those households are then not interviewed for an 8-month period, after which the households return to the survey and are interviewed once a month for 4 consecutive months. Thus, households are interviewed in the same 4 calendar months in 2 consecutive years, and in a given month in a single year, half of all respondents are interviewed in a consecutive year. Because data on all members of the sampled household are collected in the CPS, households containing multiple adults contribute multiple observations to each month’s sample. The nonresponse rate for each of the 5 years in this study ranges from 7 percent to 8 percent.42
Sample
This research focuses on the job characteristics of employed parents. To examine parents’ jobs by race, ethnicity, and nativity, we constructed a sample of adults ages 18 and older who reported having at least one child (biological or otherwise) between the ages of 0 and 17 living in their household at the time of the interview and who reported being employed at any paid job in the previous calendar year (relative to the interview year). Data on job characteristics pertain to the respondent’s primary job defined as the job at which they worked the most hours if the respondent worked more than one job in the previous calendar year. We included in the sample only those observations without missing values for any of the variables of interest. We excluded Native Americans, Alaskan Natives, and individuals whose race was reported as “biracial,” “multiracial,” or “single race, not elsewhere classified.43 To maximize statistical power in generating estimates of parental working conditions across race and ethnic subgroups, we pooled the cross-sectional samples for 5 years, 2007 through 2011. The resulting analytical sample of 201,000 parents is representative of all parents living in the United States who worked during the period 2006–2010, the year prior to each survey interview. Table 1 presents data describing our sample.
| Characteristic | Total (N = 201,000) | U.S. born (79.2 percent) | Foreign born (20.8 percent) | Hispanic (17.2 percent) | Non-Hispanic White (66.3 percent) | Non-Hispanic Black (10.8 percent) | Non-Hispanic Asian (5.6 percent) |
|---|---|---|---|---|---|---|---|
Female (percent) | 51.0 | 50.3 | 43.7 | 46.7 | 48.1 | 62.4 | 47.7 |
Employed spouse | |||||||
Married, working spouse | 61.6 | 65.4 | 57.0 | 51.4 | 68.6 | 45.5 | 67.8 |
Married, nonworking spouse | 18.9 | 15.5 | 27.9 | 26.3 | 16.4 | 11.6 | 21.6 |
Single | 19.5 | 19.1 | 15.2 | 22.4 | 15.0 | 43.0 | 10.6 |
Number of children | |||||||
1 | 31.9 | 32.7 | 28.6 | 27.2 | 32.4 | 35.3 | 33.8 |
2 | 43.1 | 43.6 | 41.3 | 39.5 | 44.5 | 37.7 | 45.1 |
3 | 18.0 | 17.3 | 20.9 | 22.9 | 17.0 | 17.9 | 14.9 |
4+ | 7.0 | 6.5 | 9.3 | 10.3 | 6.1 | 9.1 | 6.3 |
Education | |||||||
Less than high school | 9.7 | 4.7 | 28.2 | 33.6 | 3.8 | 7.8 | 6.8 |
High school | 27.0 | 27.3 | 25.0 | 30.5 | 25.9 | 32.3 | 19.7 |
Some college | 17.5 | 18.9 | 11.0 | 14.6 | 17.7 | 23.8 | 10.7 |
Associate’s degree | 10.7 | 12.4 | 6.3 | 7.1 | 12.4 | 11.6 | 7.8 |
Bachelor’s degree | 22.5 | 24.1 | 17.2 | 10.0 | 26.0 | 16.7 | 30.7 |
Advanced degree | 12.6 | 12.7 | 12.3 | 4.1 | 14.4 | 7.7 | 24.3 |
Central city | |||||||
Rural | 19.6 | 22.7 | 6.7 | 8.8 | 24.2 | 10.4 | 7.6 |
Central city | 21.0 | 17.1 | 37.6 | 37.7 | 13.5 | 40.4 | 37.4 |
Suburban | 40.9 | 40.0 | 44.6 | 41.4 | 40.9 | 36.9 | 45.7 |
City status unknown | 18.5 | 20.2 | 11.1 | 12.0 | 21.4 | 12.3 | 9.3 |
Region | |||||||
Northeast | 18.1 | 20.5 | 20.0 | 13.0 | 23.1 | 14.3 | 18.0 |
Central | 23.1 | 27.5 | 13.3 | 11.1 | 29.7 | 18.0 | 12.7 |
South | 35.8 | 30.2 | 29.1 | 32.7 | 26.7 | 58.4 | 19.6 |
West | 23.1 | 21.8 | 37.6 | 43.3 | 20.5 | 9.3 | 49.8 |
Note: N = total sample size in analysis. Source: Pooled 2007–2011 March Current Population Survey (unweighted). | |||||||
We accounted for the CPS multistage sampling design by applying the March ASEC person weights to obtain design-based regression coefficient estimates and replicate weights to adjust standard errors. We performed all analyses using Stata 12.0.
Measures
Job characteristics that enable parental investment in children. Similar to other national employment surveys, the CPS does not contain questions about employer-provided benefits, such as paid leave, or about detailed information on work schedules, work shifts, flexibility, or training. As such, we analyze the three aspects of jobs needed for investment in children that respondents are asked about in the March ASEC: (1) paying a wage that is equal to or above an estimated family budget for an adult in a family with both a school-age child (between the ages of 6 and 12) and a teenage child (between the ages of 13 and 18), (2) providing access to employer-sponsored health insurance, and (3) providing access to a pension plan either because the job is covered by a union or because the employer has a pension plan.
Wages. Our wage threshold is an hourly wage rate of $16.79, the estimated wage rate that a parent needs to support a family with one teenage child and one child between the ages of 6 and 12 when both parents are employed, in 2010. We refer to this wage threshold as the “family economic security wage.” This rate is based on an estimated family budget using the Basic Economic Security Tables™ (BEST) Index,44 which considers the basic needs and assets workers need to ensure their family’s economic security. Again, because of our focus on working parents, we deliberately selected a cutoff higher than the minimum wage that was consistent with a family budget and with thresholds used in other research studies.45
Access to employer-sponsored health insurance. In our analysis, a worker is considered to have health insurance if he or she reports being the policyholder in an employer-sponsored plan. Important to note is that this measure captures takeup of employer-sponsored health insurance, not whether it is accessible. This information is not gathered in the CPS and, as such, this measure is an underestimate of whether the respondent’s employer provides access to health insurance.46
Access to employer-sponsored pension plan. In this study, we specifically use the definition used in Schmitt47, whether the employee has access to an employer- or union-sponsored pension plan in which the employer pays some or the entire premium. A worker is classified as having a pension plan if the respondent reports that the employer offers such a plan and that in his or her present job, he or she is eligible for participation.
We refer to jobs as “limited family wage and benefits jobs” if they have none or few of the characteristics that facilitate parental investment in children. For our multivariate regression analysis, we rank jobs according to the degree of access to child-investment-enhancing characteristics, ranging from most to least access. Our four rank-ordered categories are (1) “adequate family wage and benefit” if a job has all three of the characteristics facilitating investment of parental resources, (2) “slightly limited family wage and benefit” if a job has two of the three of these characteristics, (3); “somewhat limited family wage and benefit” if a job has one of the three characteristics, and (4) “very limited family wage and benefit” if a job has none of these characteristics.
Key stratifying variables
We construct four categories of race and ethnicity: Hispanic (of any race),48 non-Hispanic Black, non-Hispanic Asian, and non-Hispanic White (the reference group). Our measure of nativity status is a binary variable of which individuals reporting that they were “foreign born” or reporting “both parents foreign” were classified as being “foreign born” and of which individuals reporting “both parents native born”; “father foreign, mother native”; or “mother foreign, father native” were classified as “U.S. born.”
Control variables
Our control variables include occupation, industry, sector (public, private, self-employed), and employment arrangements (e.g., part-time work, part-year work, firm size, change in employer). We also include controls for other factors that affect the types of characteristics and conditions of one’s job—highest level of schooling, age and age-squared—to model the potential declining positive impact of work experience on access to better job characteristics as workers age, local economic environment (urban city and region), and presence and employment status of a spouse.
Analytic strategy
We first test for the association between race and ethnicity and nativity and a range of job characteristics among working parents. We then conduct bivariate analyses to assess whether minority and foreign-born working parents are differentially likely to be in jobs that facilitate parents’ investment in their children. Next, we estimate a series of ordered logistic regression models, beginning with only race and ethnicity and nativity as the independent variables. Then, in what we will refer to as our “full model,” we add a full set of controls. We focus on the extent to which the coefficients on our race and ethnicity and nativity indicators are reduced in magnitude as controls are added. Any statistically significant positive association between race and ethnicity or nativity job quality we find after adding a full set of explanatory factors constitutes the unexplained variance due to either unobservable factors or discrimination.
Given the lack of consensus on the threshold for a family economic security wage, we conduct a series of analyses using multiple definitions, including a lower bound (the federal minimum hourly wage during the reference period for the particular survey round [$7.25 in 2009, 2010; $6.55 in 2006, 2007, and 2008]) and upper bound (the BEST Index hourly wage for a single parent with a teenage child and a child between the ages of 6 and 12 [$28.00 in 2010 dollars]).49 The estimates for race and ethnicity, nativity, and interactions in the upper- and lower-bound models were not substantively different from our threshold; coefficients were generally smaller in magnitude when the lower-bound threshold was used and virtually identical except for the main effect of foreign born, which was slightly smaller.
To test the segmented assimilation hypotheses that the effect of being a foreign-born working parent varies by race, we first run a model that includes a set of interaction terms between race and ethnicity and nativity, referred to as our “interaction model,” and then run a Wald chi-square test for the significance of the interaction terms, using the model with and the model without the interactions, the interaction model and full model, respectively. We then examine the foreign-born working parents only and run a model with a set of indicators of duration in the United States (0–4 years, 5–10 years, 11–14 years, and 15 or more years), followed by a model with a set of terms interacting duration and race and ethnicity.
For ease of interpretation, we report odds ratios (ORs), the odds of an outcome occurring in one group compared with the odds of the same outcome occurring in another group, instead of reporting the estimated coefficients which are estimated in log odds. The reported OR for the variable “race and ethnicity category Hispanic” is the odds of being in a job with more limited access to health insurance, pension, and a family economic security wage for Hispanic working parents compared with the odds for White working parents, our base case, when the other variables in the model are held constant. We also graph the predicted probabilities of being in a very limited family wage and benefits job (with none of the job characteristics facilitating parental investment in children).
Job characteristics of parents by nativity
Table 2 shows the results of our analysis of individual job characteristics by nativity. On average, foreign-born working parents’ hourly wage, based on annual income and hours, is lower ($13.91) than that of U.S.-born parents ($18.00). The data show no significant difference between the proportions of U.S.- and foreign-born parents who work full time and those who work part time. A greater proportion of U.S.-born working parents is clustered into high-skilled occupations (professional, technical, and administrative support), compared with foreign-born working parents.
| Job characteristic | Total | U.S. born | Foreign born | p-value |
|---|---|---|---|---|
Average hourly wage | $17.10 | $18.00 | $13.91 | <.001 |
Average usual hours worked per week | 40.1 | 40.2 | 39.7 | <.001 |
Occupation (percent) | <.001 | |||
Professional and specialty | 23.6 | 24.9 | 18.7 | — |
Management, business, and financial | 16.4 | 17.8 | 11.3 | — |
Technicians, sales, technical and administrative support | 22.3 | 23.9 | 16.4 | — |
Services | 15.5 | 13.7 | 22.2 | — |
Blue collar(1) | 21.4 | 19.3 | 29.5 | — |
Agriculture: farming, forestry, and fishing | .7 | .4 | 1.8 | — |
Industry (percent) | <.001 | |||
Trade | 12.5 | 12.6 | 11.9 | — |
Manufacturing | 11.6 | 11.1 | 13.5 | — |
Services | 11.0 | 9.6 | 16.2 | — |
Professional and related services | 35.1 | 36.3 | 30.4 | — |
Finance, insurance, real estate | 7.4 | 7.9 | 5.5 | — |
Public administration | 5.0 | 5.7 | 2.3 | — |
Transportation and communications | 7.6 | 7.7 | 7.2 | — |
Agricultural, forestry and fishing, mining, construction | 9.8 | 9.0 | 13.0 | — |
Class of worker (percent) | <.001 | |||
Self-employed, not incorporated | 6.4 | 6.3 | 6.8 | — |
Self-employed, incorporated | 4.1 | 4.2 | 3.8 | — |
Wage or salary, private | 74.5 | 72.8 | 81.0 | — |
Federal government employee | 2.4 | 2.6 | 1.6 | — |
State government employee | 4.3 | 4.7 | 2.5 | — |
Local government employee | 8.4 | 9.5 | 4.3 | — |
Worked full or part time in previous calendar year (percent) | 0.33 | |||
Full time | 85.1 | 84.9 | 86.2 | — |
Part time | 14.9 | 15.2 | 13.8 | — |
Number of employees (percent) | <.001 | |||
<10 | 19.9 | 18.6 | 25.1 | — |
10 to 24 | 10.5 | 9.9 | 12.5 | — |
25 to 99 | 11.7 | 11.4 | 12.7 | — |
100 to 499 | 13.5 | 13.8 | 12.3 | — |
500 to 999 | 5.6 | 5.8 | 4.9 | — |
1,000+ | 38.8 | 40.5 | 32.4 | — |
Notes: (1) Occupations include construction, extraction; installation, maintenance, and repair; production; transportation; and material moving. Source: Pooled 2007–2011 March Current Population Survey (weighted). | ||||
The segregation between U.S.- and foreign-born working parents’ occupation translates into industry-based divisions. The greatest numbers of parents work in the professional and related services industry compared with other industries. However, a greater percentage of U.S.-born parents works in professional and related services compared with foreign-born working parents (36 percent compared with 30 percent), whereas foreign-born working parents show relatively high proportions in the service industry (16 percent compared with 10 percent for the U.S. born).
Examining class of worker for U.S.- and foreign-born working parents, the greatest proportion of both groups is private wage-based or salaried employees (73 percent and 81 percent). U.S.-born parents also work as federal, state, or local (3 percent, 5 percent, and 9 percent, respectively) government employees in higher proportions than foreign-born parents (2 percent, 2 percent, and 4 percent, respectively). With regard to firm size, a greater proportion of foreign-born parents than U.S.-born parents work for small firms with less than 10 employees. The proportion of U.S.-born parents working for firms with more than 1,000 employees is higher (41 percent) than the proportion of foreign-born parents (32 percent). At the other end of the spectrum, 25 percent of foreign-born parents work for firms with less than 10 employees, compared with only 19 percent of U.S.-born parents.
Job characteristics of parents by race and ethnicity
Table 3 shows the results of our analysis of individual job characteristics by race and ethnicity. Our analysis suggests that the race and ethnicity (Hispanic, non-Hispanic White, non-Hispanic Black, non-Hispanic Asian) of working parents are associated with statistically significant differences in occupation, industry, class of worker, full-time or part-time employment, firm size, and wages. White and Asian working parents have higher average hourly wages, $19.22 and $19.23, based on annual income and hours than any other race and ethnicity. In contrast, Hispanic working parents earn the lowest average hourly wages at $12.50. The proportion of working parents paid by the hour is lowest among Whites and Asians (46 percent and 40 percent) and highest among Blacks and Hispanics (64 percent and 67 percent). Whites have the highest proportion of part-time working parents at 16 percent, whereas Asians have the lowest proportion at only 12 percent. More Hispanic and Black working parents work in services occupations compared with any other race and ethnicity: 24 percent of Hispanics and Blacks work in services, compared with only 12 percent of White working parents. Hispanic working parents are most concentrated in blue collar occupations (34 percent), whereas non-Hispanic White and Asian working parents are most concentrated in professional and specialty occupations.
| Job characteristic | Total | Hispanic | Non-Hispanic White | Non-Hispanic Black | Non-Hispanic Asian | p-value |
|---|---|---|---|---|---|---|
Average hourly wage | $17.1 | $12.5 | $19.2 | $14.4 | $19.2 | <.001 |
Average usual hours worked per week | 40.4 | 38.4 | 40.7 | 39.7 | 40.6 | <.05 |
Occupation (percent) | <.001 | |||||
Professional and specialty | 23.6 | 10.7 | 26.6 | 19.9 | 35.6 | — |
Management, business, and financial | 16.1 | 8.5 | 19.3 | 10.9 | 17.1 | — |
Technicians, sales technical and admin support | 22.6 | 20.3 | 22.6 | 25.3 | 19.0 | — |
Services | 16.2 | 23.9 | 12.0 | 24.3 | 14.5 | — |
Blue collar(1) | 20.8 | 34.3 | 19.1 | 19.4 | 13.6 | — |
Agriculture: farming, forestry and fishing | .7 | 2.3 | .4 | .2 | .3 | — |
Industry (percent) | <.001 | |||||
Trade | 12.5 | 13.1 | 12.6 | 11.1 | 12.2 | — |
Manufacturing | 11.6 | 12.4 | 11.6 | 8.6 | 14.0 | — |
Services | 11.0 | 15.4 | 9.5 | 11.2 | 14.7 | — |
Professional and related services | 35.1 | 27.5 | 36.0 | 40.9 | 36.7 | — |
Finance, insurance, real estate | 7.4 | 5.2 | 8.1 | 6.6 | 7.9 | — |
Public administration | 5.0 | 3.4 | 5.2 | 7.5 | 3.4 | — |
Transportation and communications | 7.6 | 6.9 | 7.4 | 10.3 | 7.7 | — |
Agricultural, forestry and fishing, mining, construction | 9.8 | 16.1 | 9.8 | 3.8 | 3.3 | — |
Class of worker (percent) | <.001 | |||||
Self-employed, not incorporated | 6.4 | 6.0 | 7.0 | 3.4 | 6.1 | — |
Self-employed, incorporated | 4.1 | 2.0 | 5.0 | 1.6 | 4.8 | — |
Wage/salary, private | 74.5 | 82.0 | 72.1 | 75.3 | 77.5 | — |
Federal government employee | 2.4 | 1.4 | 2.3 | 4.3 | 3.0 | — |
State government employee | 4.3 | 2.5 | 4.5 | 6.1 | 4.1 | — |
Local government employee | 8.4 | 6.2 | 9.2 | 9.3 | 4.4 | — |
Worked full or part time in past calendar year (percent) | <.001 | |||||
Full time | 85.1 | 85.6 | 84.4 | 87.1 | 87.9 | — |
Part time | 14.9 | 14.4 | 15.6 | 12.9 | 12.2 | — |
Number of employees (percent) | <.001 | |||||
<10 | 19.9 | 23.1 | 20.3 | 11.9 | 21.0 | — |
10 to 24 | 10.5 | 13.9 | 10.0 | 8.6 | 8.4 | — |
25 to 99 | 11.7 | 14.0 | 11.6 | 9.5 | 9.1 | — |
100 to 499 | 13.5 | 13.0 | 13.7 | 14.0 | 12.2 | — |
500 to 999 | 5.6 | 4.8 | 5.8 | 6.1 | 5.1 | — |
1,000+ | 38.8 | 31.1 | 38.6 | 49.9 | 44.2 | <.001 |
Notes: (1) Occupation includes construction, extraction; installation, maintenance, and repair; production; transportation; and material moving. Source: Pooled 2007–2011 March Current Population Survey (weighted). | ||||||
Working parents of all race and ethnicities are most highly concentrated in the professional and related services industry, although to different degrees. Relative to other racial and ethnic categories, Black working parents have the highest proportion in this industry (41 percent), whereas Hispanics have the lowest proportion (28 percent). Hispanics are also much more concentrated in the agricultural, forestry and fishing, mining, and construction industries (16 percent) than any other race and ethnicity. (Whites have the second highest proportion at 10 percent).
The majority of working parents in all racial and ethnic groups are private wage-based or salaried employees. In addition, a relatively small proportion of Hispanic parents are federal, state, and local government employees (1 percent, 3 percent, and 6 percent, respectively). With regard to firm size, working parents of all racial and ethnic categories are concentrated in the largest firms, those with more than 1,000 employees, ranging from 31 percent of Hispanics to 50 percent of Blacks. A similar proportion of Hispanic, White, and Asian working parents is employed in a small firm with less than 10 employees: 23 percent, 20 percent, and 21 percent, respectively. In contrast, only 12 percent of Black working parents work in firms with less than 10 employees. A much lower proportion of Black working parents is self-employed (5 percent), compared with Whites (12 percent).
Access to jobs that facilitate parents’ investment in children
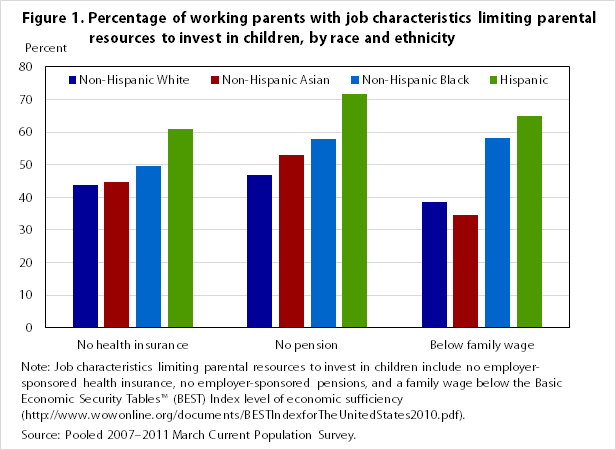
Figure 1 shows the results of our analysis of access to each of the individual components of jobs that facilitate investment in children by race and ethnicity. All non-White racial and ethnic categories have a higher proportion of working parents without pension plans at work or employment-based health insurance than do Whites. This disparity is particularly noticeable for Hispanic working parents: 61 percent of Hispanics have no employer-based health insurance and 72 percent have no pension plan at work, compared with only 44 percent and 47 percent of White working parents, respectively. Moreover, Hispanic and Black working parents are significantly more likely than White and Asian working parents to be in a job paying below the basic economic security wage (65 percent and 58 percent vs. 38 percent and 35 percent, respectively). A much higher proportion of Hispanic (43 percent) and Black (30 percent) working parents is in a job with all three unfavorable characteristics than White (19 percent) and Asian (20 percent) working parents. (See figure 2.)
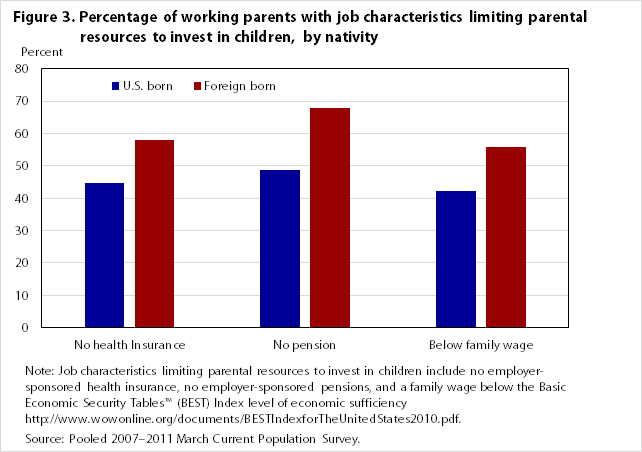
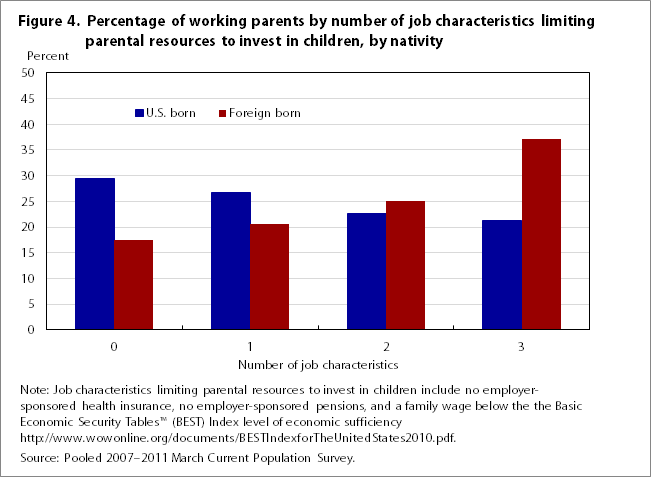
The proportion of foreign-born parents with no pension plan at work (68 percent) and with no employment-based health insurance (58 percent) was higher than that of U.S. born (49 percent and 45 percent, respectively). (See figure 3.) Foreign-born working parents also were more likely to work in jobs paying below the family economic security wage level (56 percent vs. 42 percent). We found that nearly twice as many foreign-born working parents as U.S.-born working parents are exposed to jobs paying below the family economic security level, lacking employer-sponsored health insurance, and having no pension (37 percent vs. 21 percent). (See figure 4.)
Multivariate models
Table 4 presents the results of ordered logistic regression models estimating the effect of race and ethnicity and nativity on the odds of working parents having a more limited family wage and benefits job (one with fewer characteristics that facilitate investment of parental resources). Model 1 examines the effects of race and ethnicity and nativity alone. Relative to the odds of White parents, the odds of Black parents being in a job without employer-sponsored health insurance, a pension plan, and a family economic security wage (versus a job with at least one of these characteristics) are 55 percent higher and of Hispanic parents 115 percent higher (p < .001). Asian parents were 29 percent less likely than were White parents to be in a job with fewer characteristics that facilitate parental investment (p < .001). Relative to U.S.-born working parents, foreign-born parents have 61 percent higher odds of being in a job with fewer of the characteristics supporting parental investment in children (p < .001).
| Variable | Model 1 | Model 2 | Model 3 |
|---|---|---|---|
Race/ethnicity and nativity | |||
Non-Hispanic Black | 1.55(1) (.030) | 1.33(1) (.028) | 1.36(1) (.032) |
Hispanic | 2.15(1) (.037) | 1.42(1) (.026) | 1.27(1) (.029) |
Non-Hispanic Asian | .71(1) (.021) | 1.05 (.030) | 1.01 (.057) |
Foreign born | 1.61(1) (.030) | 1.66(1) (.032) | 1.46(1) (.045) |
Black x foreign born | — | — | .92 (.056) |
Hispanic x foreign born | — | — | 1.38(1) (.061) |
Asian x foreign born | — | — | 1.18(2) (.080) |
Other demographic and family characteristics | |||
Female | — | 1.93(1) (.024) | 1.928(1) (.024) |
Age | — | .85(1) (.005) | .84(1) (.005) |
Age squared | — | 1.00(1) (.000) | 1.00(1) (.000) |
Single | — | 1.11(1) (.019) | 1.11(1) (.019) |
Unemployed spouse | — | .96(2) (.016) | .96(3) (.016) |
Education | |||
Less than high school | — | 2.04(1) (.052) | 1.98(1) (.051) |
Some college | — | .73(1) (.012) | .74(1) (.012) |
Associate’s degree | — | .58(1) (.011) | .59(1) (.011) |
Bachelor’s degree | — | .42(1) (.007) | .42(1) (.007) |
Advanced degree | — | .29(1) (.006) | .29(1) (.006) |
Area or region of residence | |||
Not in metropolitan area | — | 1.19(1) (.024) | 1.19(1) (.024) |
Outside central city | — | .88(1) (.013) | .88(1) (.013) |
Central city status unknown | — | .99 (.020) | .99 (.020) |
Midwest | — | 1.08(1) (.021) | 1.07(1) (.021) |
South | — | 1.26(1) (.022) | 1.25(1) (.022) |
West | — | .95(3) (.018) | .95(3) (.018) |
Job characteristics | |||
Part time (<35 hours/week) | — | 3.03(1) (.052) | 3.03(1) (.053) |
Self-employed | — | 4.83(1) (.106) | 4.84(1) (.107) |
Part year (<26 weeks last year) | — | 2.831) (.073) | 2.84(1) (.073) |
<25 employees at workplace | — | 3.33(1) (.043) | 3.32(1) (.043) |
>1 employer in last year | — | 1.59(1) (.030) | 1.59(1) (.030) |
Occupation | |||
Executive, administrative, managerial | — | .94(3) (.019) | .94(3) (.019) |
Technical, sales, administrative support | — | 1.51(1) (.027) | 1.51(1) (.027) |
Service | — | 2.31(1) (.047) | 2.30(1) (.047) |
Blue collar(4) | — | 1.58(1) (.034) | 1.57(1) (.034) |
Farming, fishing | — | 4.83(1) (.403) | 4.73(1) (.390) |
Industry | |||
Trade | — | 1.59(1) (.041) | 1.60(1) (.041) |
Services | — | 2.32(1) (.065) | 2.32(1) (.065) |
Professional services | — | 1.36(1) (.029) | 1.36(1) (.029) |
Finance, insurance, and real estate | — | 1.13(1) (.030) | 1.13(1) (.030) |
Public administration | — | .49(1) (.015) | .49(1) (.015) |
Transportation, communication | — | .99 (.027) | .99 (.027) |
Agriculture, forestry, fishing, mining, construction | — | 1.25(1) (.032) | 1.25(1) (.032) |
Observations | 201,000 | 201,000 | 201,000 |
Notes: (1) p < .001. (2) p < .05. (3) p < .01. (4) Occupations include construction and extraction; installation, maintenance, and repair; production; transportation; and material moving. Note: Estimates presented are odds ratios. Model also includes 4-year dummies, three constants. A “more limited family wage and benefits job” is one with fewer of the characteristics supporting parental investment in children: employer-sponsored health insurance, pension plan, and a family economic security wage. Source: Pooled 2007–2011 March Current Population Survey. | |||
Model 2, the full model, examines racial and ethnic and nativity differences in working parents having a job with fewer characteristics that support parental investment after adjusting for sociodemographic characteristics, the local economic environment, supply and demand factors, and indicators of nonstandard work arrangements. In the full model, similar to model 1, the odds of working in a more limited wage and benefits job are significantly higher for foreign-born working parents relative to U.S.-born working parents. The magnitude of the OR is greater than the OR for parents in any of the individual racial and ethnic categories. In contrast, the estimated effect of race and ethnicity is substantially reduced, compared with model 1. For Black parents, the odds of being in a more limited wage and benefits job fall from 55 percent to 33 percent, and for Hispanic parents, the odds fall from 115 percent to 42 percent (p < .001). Once the full set of controls is included, Black working parents and Hispanic working parents are more equally disadvantaged (relative to Whites). The advantage seen in the bivariate model for Asians is attenuated. The odds of Asian parents being in a more limited family wage and benefits job versus an adequate family wage and benefits job are no longer significantly different from those of Whites, suggesting that the apparent effect of Asian race and ethnicity in model 1 is due to relatively favorable sociodemographic, local economic environment, and other job and employment characteristics.
In model 2, the full model, the estimated coefficients for the control variables are as expected. Two other findings are notable. First, gender is a key predictor of access to jobs with a wage and benefits that enable parental investments in children. Mothers are nearly twice as likely as fathers to be in a more limited family wage and benefits job (OR = 1.93, p < .001), even when education, family status, the local economic environment, occupation, industry, and nonstandard employment differences are held constant. Second, all the indicators of nonstandard employment are significant and large. The smallest effect is for having multiple employers in the past year, which increases the odds by 59 percent, and the largest is self-employment, which raises the odds of being in a job with more limited access to family wages and benefits by nearly 400 percent. Results for the other demographic variables are in the expected direction.
Table 4, column 3, shows the results of model 3, the interaction model, including race and nativity interactions to allow for additional differential effects of being foreign-born for each different race and ethnicity. As in model 2, being a foreign-born parent has a negative effect in terms of increased odds of holding a job that lacks some or all the job characteristics most important for employees supporting a family (46 percent, p < .001). Non-Hispanic Black and Hispanic parents (36 percent and 27 percent respectively, p < .001 for both) are more likely to hold jobs lacking characteristics facilitating parents’ economic investments in children, compared with non-Hispanic White parents. Among Black parents, the odds of being in a more limited wage and benefits job for foreign-born parents are not significantly different from U.S.-born parents. In contrast, among Hispanic parents, foreign-born parents are at significantly higher risk of being in a job that lacks one or more of the three most important job characteristics (OR 1.38, p < .001). Among Asian parents, the foreign-born also have higher odds than those among U.S.-born parents of being in a more limited wage and benefits job, but the difference is smaller and less significant (OR = 1.18, p < .05). Two of the three interaction terms are statistically significant, and a Wald chi-square test comparing unweighted results from model 2 (the full model) and model 3 (the interaction model) was significant at p < .001 (X2 = 153.82(3)). Taken together, these results indicate that the interaction variables significantly increase the explanatory power of the models.
Figure 5 depicts the predicted probabilities of a parent having a very limited wage and benefits job that has none of the job characteristics supporting parental investment in children for each of the races and ethnicities by nativity. Among White working parents, we found a relatively small difference in the probability of being in a very limited family wage and benefits job for U.S.- as compared with foreign-born working parents (as reflected in the height of the bar for “foreign born” versus the bar for “U.S. born”), as compared with the difference in the probabilities (and estimate of the effect of nativity) for Hispanic and Asian working parents.
To examine the potential role of assimilation and the influence it may have on foreign-born working parents’ access to jobs that enable parental investment in children, we conducted analyses of the foreign-born sample for different race and ethnic groups by duration in the United States. We find a statistically significant main effect of race and ethnicity and duration in the United States in both the unadjusted and the adjusted model. In the model that includes interactions between race and ethnicity and categorized duration in the United States that correspond to less than 4 years, 5 to 10 years, 11 to 14 years, and 15 or more years with 15 or more years being the base case, the main effect of both race and ethnicity and duration in the United States remains significant. Among foreign-born working parents, we observed significant interactions between each race and ethnicity and duration category (p < .001).
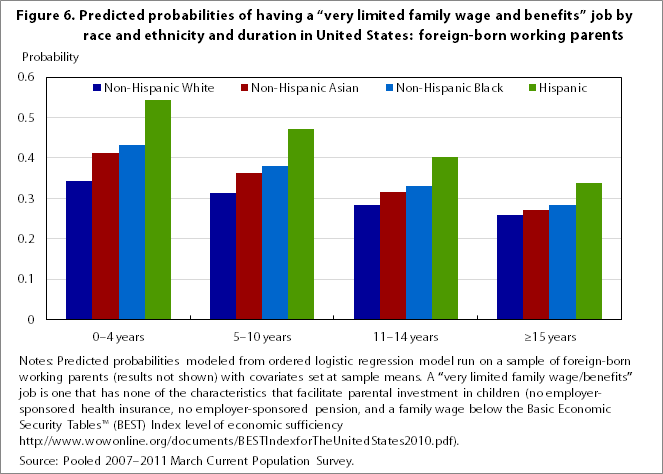
Figure 6 shows predicted probabilities of holding a very limited family wage and benefits job, one with none of the job characteristics facilitating parental investment (relative to a somewhat limited, slightly limited, and adequate family wage and benefits jobs) by race and ethnicity and duration calculated using the ordered logistic regression model results. This figure graphically represents the results to help one visualize whether among foreign-born parents, the length of time spent in the United States and potentially in the U.S. labor market reduces the likelihood of being in a very limited job that lacks access to characteristics facilitating parental investment in children, and how this relationship varies by race and ethnic group. Among foreign-born working parents, duration gradients are steeper among Hispanics than foreign-born working parents of other races and ethnicities. Foreign-born Hispanic parents who have been in the United States for 15 years or more have the same probability (34 percent) of having a job with none of the parental investment-enhancing job characteristics as foreign-born White parents who have been in the United States for 4 or fewer years.
THIS STUDY FILLS AN IMPORTANT GAP in the literature by examining job characteristics among an understudied and important subsample of adults in the United States—working parents. By combining 5 years of the March ASEC to the CPS, we were able to assess how job quality among the fastest growing subgroups of the U.S. labor force, the foreign-born and Hispanics, compares to U.S.-born employed parents and other race and ethnicities. We find that compared with U.S. working parents, foreign-born parents are markedly more likely to hold jobs that do not provide the resources necessary to sufficiently invest in children: they lack a wage high enough to meet a family’s basic needs and lack access to employer-provided health insurance as well as to a pension plan. Foreign-born Hispanic parents are at heightened disadvantage. On average, foreign-born Hispanic parents must reside in the United States 15 years before their job characteristics resemble those of foreign-born Whites.
This study documents statistically significant differences in parents’ jobs by nativity, race and ethnicity, and their intersection, even while controlling for a set of covariates included in standard wage determination models. Because of the cross-sectional sample and an incomplete set of job quality measures included in the CPS, testing competing explanations of the differences in job characteristics is limited. For example, studies have suggested that racial and ethnic- and nativity-based occupational segregation at a narrow level, such as within industry and firm, as an explanation for the disparities in wages.50 An assessment of the role of multiple hypotheses to account for the unexplained differences in job quality by race and ethnicity and nativity would require a data source that sufficiently represents all race and ethnicities, foreign- and U.S.-born workers, and a full set of job and worksite characteristics.
In addition to the significance of nativity and race as determinants of exposure to jobs with limited wage and benefits for parents, at least two other predictors should be noted. First, our results show that gender is a large and statistically significant influence on the likelihood of holding a job that enables a working parent to support a family well. For women, the odds of holding a job that paid lower than the recommended wage needed to invest in children and with no health insurance and no pension plan were significantly higher. Although explanations for this finding even in our model with a full set of controls are beyond the scope of this article, a worthwhile direction for future research is disaggregating exposure to jobs with limited wage and benefits among parents by more detailed work and family characteristics such as family and extended household composition, skill level, ability to speak multiple languages, and workplace discrimination.
Second, holding a job in a small firm significantly increases the odds of holding a job paying below a family wage and lacking benefits. Consistent with other studies using the 2005 Contingent Worker Supplement,51 we found that compared with White parents, Hispanic as well as foreign-born parents are more likely to work for smaller firms that on average provide fewer benefits, whereas Black parents were significantly more likely to be a regular employee in a large-sized firm defined as 1,000 or more employees. Small firms are exempted from many labor laws that apply to larger firms, including the 1972 amendment to the Civil Rights Act,52 which explicitly excludes firms with fewer than 15 employees. Another regulation protecting parents that does not apply to employers with small businesses is the Family and Medical Leave Act of 1993 (FMLA), which exempts firms with less than 50 employees (at any worksite within 75 miles). The FMLA guarantees 12 weeks of unpaid leave for the birth or adoption of a child, to care for a seriously ill family member, or for a serious personal illness.53
The descriptive analyses also highlighted that, as with the overall adult employed population, employed Black parents are disproportionately likely to be employed in public sector jobs which, on average at the state and federal level, offer better wages and benefits. The shrinking employment in public sector jobs has significantly affected the unemployment rate of Blacks (Black men, in particular),54 which could increase the number of Black parents at risk of being employed in jobs with limited wages and benefits and increasing the size of the job quality gap between White and non-White working parents.
ACKNOWLEDGMENT: This research was supported by a grant from the W. K. Kellogg Foundation (Project 3020864, Dolores Acevedo-Garcia, principal investigator).
Alison Earle, Pamela Joshi, Kimberly Geronimo, and Dolores Acevedo-Garcia, "Job characteristics among working parents: differences by race, ethnicity, and nativity," Monthly Labor Review, U.S. Bureau of Labor Statistics, May 2014, https://doi.org/10.21916/mlr.2014.19
1 Mitra Toossi, “Labor force projections to 2020: a more slowly growing workforce,” Monthly Labor Review, January 2012, pp. 43–64, https://www.bls.gov/opub/mlr/2012/01/art3full.pdf.
2 Mitra Toossi, “Projections of the labor force to 2050: a visual essay,” Monthly Labor Review, October 2012, pp. 3–16, http://www.bls .gov/opub/mlr/2012/10/art1full.pdf.
3 Toossi, “Labor force projections to 2020,” pp. 43–64.
4 Audrey Singer, Immigrant workers in the U.S. labor force (Brookings Institution, March 15, 2012), https://www.brookings.edu/wp-content/uploads/2016/06/0315_immigrant_workers_singer.pdf.
5 U.S. Department of Labor, Labor force characteristics by race and ethnicity, 2011, Report 1036 (Bureau of Labor Statistics, August 2012), https://www.bls.gov/cps/cpsrace2011.pdf; Arne L. Kalleberg, Barbara F. Reskin, and Kenneth Hudson, “Bad jobs in America: standard and nonstandard employment relations and job quality in the United States,” American Sociological Review, April 2000, pp. 256–278; Institute for Women’s Policy Research, Paid sick day access rates by gender and race/ethnicity, 2010 (Institute for Women’s Policy Research, March 2011), http://www.iwpr.org/publications/pubs/paid-sick-day-access-rates-by-gender-and-race-ethnicity-2010/; Raine Dozier, “The declining relative status of Black women workers, 1980–2002,” Social Forces, June 2010, pp. 1833–1857, http://muse.jhu.edu/journals/social_forces/summary/v088/88.4.dozier.html; Cassandra Moseley, “Ethnic differences in job quality among contract forest workers on six national forests,” Policy Sciences, June 2006, pp. 113–133; Julie A. Kmec, “Minority job concentration and wages,” Social Problems, February 2003, pp. 38–59; and Frederic Blavin, John Holahan, Genevieve M. Kenney, and Megan McGrath, Uninsurance is not just a minority issue: White Americans are a large share of the growth from 2000 to 2010 (Urban Institute, November 2012), http://www.urban.org/UploadedPDF/412698-Uninsurance-Is-Not-Just-a-Minority.pdf. See chart, “Employer-provided health insurance and pension coverage, by race and ethnicity, 1979–2010,” in Lawrence Mishel, Josh Bivens, Elise Gould, and Heidi Shierholz, The State of working America, 12th ed., Economic Policy Institute (Ithaca, NY: Cornell University Press, 2012), http://stateofworkingamerica.org/chart/swa-introduction-table-1-4-employer-health/.
6 U.S. Department of Labor, Foreign-born workers: labor force characteristics—2012, news release (U.S. Department of Labor, Bureau of Labor Statistics, May 22, 2013), https://www.bls.gov/news.release/pdf/forbrn.pdf; Lisa Catanzarite, “Brown-collar jobs: occupational segregation and earnings of recent-immigrant Latinos,” Sociological Perspectives, Spring 2000, pp. 45–75; and Frank D. Bean, Mark Leach, and B. Lindsay Lowell, “Immigrant job quality and mobility in the United States,” Work and Occupations: An International Sociological Journal, November 2004, pp. 499–518.
7 For example, see Gregory Acs and Pamela Loprest analyze the survey of Employers in the low-skill labor market and find differences in wages earned by race and ethnicity but not in access to health insurance and paid leave and present their findings, “Job differences by race and ethnicity in the low-skill job market,” Brief no. 4 (Urban Institute, February 2009), http://www.urban.org/UploadedPDF/411841_race_ethnicity_job_market.pdf.
8 Robert Cherry, Who gets the good jobs? Combating race and gender disparities (New Brunswick, NJ: Rutgers University Press, 2001); and Quincy Thomas Stewart and Jeffrey C. Dixon, “Is it race, immigrant status, or both? An analysis of wage disparities among men in the United States,” International Migration Review, Spring 2010, pp. 173–201.
9 Barbara Taylor, Robert Delcampo, and Donna Marie Blancero, “Work-family conflict/facilitation and the role of workplace supports for U.S. Hispanic professionals,” Journal of Organizational Behavior, July 2009, pp. 643–664; BS Clifford L. Broman, “Work stress in the family life of African Americans,” Journal of Black Studies, July 2001, pp. 835–846.
10 For example, see Kimberly A. Updegraff, Ann C. Crouter, Adriana J. Umaña-Tayulor, and Emily Cansier, “Work-family linkages in the lives of families of Mexican origin,” in Jennifer E. Lansford, Kirby Deater-Deckard, and Marc H. Bornstein, eds., Immigrant families in contemporary society (New York: Guilford Press, 2007), pp. 250–267; and Roger Waldinger, Nelson Lim, and David Cort, “Bad jobs, good jobs, no jobs? The employment experience of the Mexican American second generation,” Journal of Ethnic and Migration Studies, January 2007, pp. 1–35.
11 Sara Jane Glynn, Working parents’ lack of access to paid leave and workplace flexibility (Center for American Progress, November 20, 2012), http://www.americanprogress.org/wp-content/uploads/2012/11/GlynnWorkingParents-1.pdf; and Lisa Clemans-Cope, Genevieve M. Kenney, and Aaron Lucas, Health insurance in nonstandard jobs and small firms: differences for parents by race and ethnicity, Brief no. 12 (Urban Institute, April 2010), http://www.urban.org/UploadedPDF/412090-health-insurance-in-nonstandard.pdf.
12 Karina Fortuny and Ajay Chaudry, Children of immigrants: growing national and state diversity, Brief no. 5 (Urban Institute, October 2011), pp. 1–10, https://www.urban.org/sites/default/files/publication/26631/412433-Children-of-Immigrants-Growing-National-and-State-Diversity.PDF; William H. Frey, America’s diverse future: initial glimpses at the U.S. child population from the 2010 Census (Brookings Institution, April 6, 2011), https://www.brookings.edu/articles/americas-diverse-future-initial-glimpses-at-the-u-s-child-population-from-the-2010-census/; and Children of immigrants drive the increase in America’s youth population, but almost half live in low-income families (Urban Institute, September 16, 2010), http://webarchive.urban.org/publications/901382.html.
13 Kenneth M. Johnson and Daniel T. Lichter, “The changing faces of America’s children and youth,” Issue Brief no. 15 (The Carsey Institute, University of New Hampshire, Spring 2010), http://www.carseyinstitute.unh.edu/publications/IB_Johnson_ChangingFaces.pdf; and Fortuny and Chaudry, “Children of immigrants,” pp. 1–10.
14 Holly Mead, Lara Cartwright-Smith, Karen Jones, Christal Ramos, Kristy Woods, and Bruce Siegel, Racial and ethnic disparities in U.S. health care: a chartbook (The Commonwealth Fund, March 13, 2008), https://www.commonwealthfund.org/publications/publication/2008/mar/racial-and-ethnic-disparities-us-health-care-chartbook; Donald J. Hernandez and Wendy D. Cervantes, Children in immigrant families: ensuring opportunity for every child in America (Foundation for Child Development, March 2011), http://www.firstfocus.net/sites/default/files/FCDImmi gration.pdf, pp. 1–26; Angelina KewalRamani, Lauren Gilbertson, Mary Ann Fox, and Stephen Provasnik, Status and trends in the education of racial and ethnic minorities, NCES 2007039 (National Center for Education Statistics, September 2007), http://nces.ed.gov/pubsearch/pubsinfo.asp?pubid=2007039; Marla McDaniel, Christina Paxson, and Jane Waldfogel, “Racial disparities in childhood asthma in the United States: evidence from the national health interview survey, 1997 to 2003,” Pediatrics, May 2006, pp. e868–e877; Improving children’s health: understanding children’s health disparities and promising approaches to address them (Children’s Defense Fund, 2006), http://www.childrensdefense.org/child-research-data-publications/data/Childrens-Health-Disparities-Report-2006.pdf.
15 For a review of studies of male earnings, see Bruce Western and Becky Pettit, “Black–White wage inequality, employment rates, and incarceration,” American Journal of Sociology, September 2005, pp. 553–578; and Moshe Semyonov and Noah Lewin-Epstein, “The declining earnings gap in the United States: multi-level analysis of males’ earnings, 1960–2000,” Social Science Research, June 2009, pp. 296–311.
16 Kalleberg et al., “Bad jobs in America,” pp. 256–278.
17 Heather Boushey, “Reworking the wage curve: exploring the consistency of the model across time, space and demographic group,” Review of Political Economy, July 2002, pp. 293–312.
18 Semyonov and Lewin-Epstein, “The declining earnings gap, pp. 296–311; Matt L. Huffman and Philip N. Cohen, “Racial wage inequality: job segregation and devaluation across U.S. labor markets,” American Journal of Sociology, January 2004, pp. 902–936; and Jennifer R. Keene and Anastasia H. Prokos, “Comparing offers and take-ups of employee health insurance across race, gender, and decade,” Sociological Inquiry, August 2007, pp. 425–459.
19 Wallace Mok and Zahra Siddique, “Racial and ethnic inequality in employer provided fringe benefits,” Discussion Paper no. 6255 (Institute for the Study of Labor, December 2011), http://ftp.iza.org/dp6255.pdf.
20 John Schmitt, Labor markets and economic inequality in the United States since the end of the 1970s (Center for Economic and Policy Research, April 2005), http://www.cepr.net/documents/publications/inequality_2005_04.pdf.
21 David Card, “Is the new immigration really so bad?” The Economic Journal, November 2005, pp. 300–323; James P. Smith, “Immigrants and the labor market,” Journal of Labor Economics, April 2006, pp. 203–234; and Randolph Capps, Michael Fix, and Serena Yi-Ying Lin, Still an hourglass? Immigrant workers in middle-skilled jobs, report in brief (Migration Policy Institute, September 2010), http://www.migrationpolicy.org/research/immigrant-workers-middle-skilled-jobs-0.
22 Capps et al., Still an hourglass? pp. 14.
23 Swarn Chatterjee and Robert B. Nielsen, “Employer-provided health insurance coverage: a comparison of employed native-born and immigrant Americans,” Family and Consumer Sciences Research Journal, September 2011, pp. 15–27; and Thomas C. Buchmeuller, Anthony T. Lo Sasso, Lurie Ithai, and Sarah Dolfin, “Immigrants and employer-sponsored health insurance, Health Services Research, February 2007, pp. 286–310.
24 Mamta U. Ojha, “Job demands, social support, and work-family conflict: a comparative study of immigrant and native workers in the United States,” Paper 198 (Ph.D. diss., University of Kentucky Doctoral Dissertations, 2011), http://uknowledge .uky.edu/gradschool_diss/198.
25 Pia M. Orrenius and Madeline Zavodny, “Do immigrants work in risky jobs?” Demography, August 2009, pp. 535–551.
26 For more information, see Bean et al., “Immigrant job quality and mobility,” pp. 499–518.
27 Alejandro Portes and Ruben G. Rumbaut, Legacies: the story of the immigrant second generation (Berkeley, CA: University of California Press, 2001).
28 Min Zhou and Yang Sao Xiong, “The multifaceted American experiences of the children of Asian immigrants: lessons for segmented assimilation,” Ethnic and Racial Studies, November 2005, pp. 1119–1152; Tomás R. Jiménez, “Mexican immigrant replenishment and the continuing significance of ethnicity and race,” American Journal of Sociology, May 2008, pp. 1527–1567; Yen Le Espiritu, Home bound: Filipino American lives across cultures, communities, and countries (Berkeley, CA: University of California Press, 2003); Jennifer Lee and Frank D. Bean, “America’s changing color lines: immigration, race/ethnicity, and multiracial identification,” Annual Review of Sociology, August 2004, pp. 221–242; and Arpana G. Inman, Erin E. Howard, Robin L. Beaumont, and Jessica A. Walker, “Cultural transmission: influence of contextual factors in Asian Indian immigrant parents’ experiences,” Journal of Counseling Psychology, January 2007, pp. 93–100.
29 What kinds of work do immigrants do? Occupation and industry of foreign-born workers in the United States (Migration Policy Institute, January 23, 2004), http://migrationpolicy.org/research/what-kind-work-do-immigrants-do-occupation-and-industry-foreign-born-workers-united-states.
30 For example, see Ichiro Kawachi, Norman Daniels, and Dean E. Robinson, “Health disparities by race and class: why both matter,” Health Affairs, March 2005, pp. 343–352; Alistair Woodward and Ichiro Kawachi, “Theory and methods: why reduce health inequalities?” Journal of Epidemiology and Community Health, December 2000, pp. 923–929, http://jech.bmj.com/conte nt/54/12/923.
31 Robert Haveman and Barbara Wolfe, “The determinants of children’s attainments: a review of methods and findings,” Journal of Economic Literature, December 1995, pp. 1829–1878.
32 Heather Boushey, Shawn Fremstad, Rachel Gregg, and Margy Waller, Understanding low-wage work in the United States (Center for Economic and Policy Research, March 2007), http://inclusioni st.org/files/lowwagework.pdf.
33 Randolph Capps, Michael E. Fix, Jeffrey S. Passel, Jason Ost, and Dan Perez-Lopez, “A profile of the low-wage immigrant workforce,” Immigrant families and workers: facts and perspectives, Brief no. 4 in series (Urban Institute, November 2003), http://www.urban.org/publications/310880.html.
34 Boushey et al., Understanding low-wage work in the United States.
35 Capps et al., Still an hourglass? pp. 8; and Boushey et al., Understanding low-wage work. An example of this definition is in a study using the 2002 National Study of the Changing Workforce conducted by the Families and Work Institute, which defined a “low wage” employee as someone whose “earnings fall in the bottom 25 percent of the earnings distribution” (James T. Bond, Cynthia Thompson, Ellen Galinsky, and David Prottas, “Highlights of the 2002 national study of the changing workforce,” no. 2, executive summary [Families and Work Institute, 2002], http://www.immigrationresearch-info.org/report/migration-policy-institute/still-hourglass-immigrant-workers-middle-skilled-jobs-report-brief). Defining low-wage work by reference to a specific percentile of the wage distribution allows trends in wage growth to be seen. The disadvantage of this type of wage threshold, however, is that the share of the labor market with low wages is always set and unchanged; this approach does not provide information about changes in the number of low-wage jobs over time. Moreover, this methodology does not provide information about the spread of wages and, therefore, how much less low-wage jobs pay.
36 S. Jody Heymann, Sara Toomey, and Frank Furstenberg, “Working parents: what factors are involved in their ability to take time off from work when their children are sick?” Archives of Pediatrics and Adolescent Medicine, August 1999, pp. 870–874.
37 Wen-Jui Han, Christopher Ruhm, and Jane Waldfogel, “Parental leave policies and parents’ employment and leave-taking,” Journal of Policy Analysis and Management, Winter 2009, pp. 29–54.
38 Paula McDonald, Diane Guthrie, Lisa Bradley, and Jane Shakespeare-Finch, “Investigating work–family policy aims and employee experiences,” Employee Relations, October 2005, pp. 478–494; and Carol M. Devine, Margaret Jastran, Jennifer A. Jabs, Elaine Wethington, Tracy J. Farrell, and Carole A. Bisogni, “A lot of sacrifices: work–family spillover and the food choice coping strategies of low-wage employed parents,” Social Science and Medicine, November 2006, pp. 2,591–2,603.
39 Rucker C. Johnson, Ariel Kalil, and Rachel E. Dunifon (with Barbara Ray), Mothers’ work and children’s lives: low-income families after welfare reform (Kalamazoo, MI: W.E. Upjohn Institute for Employment Research, 2010).
40 For a review, see Jane Waldfogel, What children need (Cambridge, MA: Harvard University Press, 2006).
41 Mead et al., Racial and ethnic disparities in U.S. health care; Hernandez and Cervantes, Children in immigrant families; McDaniel et al., “Racial disparities in childhood asthma, pp. e868–e877; KewalRamani et al., Status and trends; and Improving children’s health (Children’s Defense Fund).
42 See Current Population Survey 2011 Annual Social and Economic Supplement, Documentation file (U.S. Census Bureau, 2011), http://www.nber.org/cps/cpsmar11.pdf.
43 By bi- and multiracial status, we include multiple named races or multiple unspecified races as well as the “other single race, not elsewhere classified.”
44 The basic economic security tables for the United States (Wider Opportunities for Women, 2011).
45 Algernon Austin, “Getting good jobs to people of color,” Briefing Paper 250 (Economic Policy Institute, November 12, 2009), http://www.epi.org/publication/getting_good_jobs_to_people_of_color/; John Schmitt, The good, the bad, and the ugly: job quality in the United States over the three most recent business cycles (Center for Economic and Policy Research, November 2007), http://www.cepr.net/index.php/publications/reports/the-good- the-bad-and-the-ugly/.
46 Note that this measure does not capture health insurance coverage because parents and families can obtain and have health insurance coverage through public provision.
47 John Schmitt, Unions and upward mobility for immigrant workers (Center for Economic and Policy Research, March 2010), http://www.cepr.net/index.php/publications/reports/un ions-upward-mobility-immigrant-workers/; John Schmitt and Janelle Jones, Where have all the good jobs gone? (Center for Economic and Policy Research, July 2012), http://www.cepr.net/documents/publications/good- jobs-2012-07.pdf
48 Hispanic ethnicity is defined using self-reported ethnicity of any of the following: “Hispanic,” “Mexican,” “Mexican American,” “Chicano/Chicana,” “Mexican (Mexicano),” “Mexicano/ Chicano,” “Puerto Rican,” “Cuban,” “Other Spanish,” “Central/South American,” and “Hispanic, unspecified.”
49 Jared Bernstein and Maury Gittleman, “Exploring low-wage labor with the National Compensation Survey,” Monthly Labor Review, November/December 2003, pp. 3–12, http://www.bls .gov/opub/mlr/2003/11/art1full.pdf.
50 See Algernon Austin, Darrick Hamilton, and William Darity Jr., “Whiter jobs, higher wages: occupational segregation and the lower wages of Black men,” Briefing Paper 288 (Economic Policy Institute Brief, February 25, 2011), http:/ /www.epi.org/publication/whiter_jobs_higher_wages/.
51 For example, see Kalleberg et al., “Bad jobs in America,” pp. 256–278; and Clemans-Cope et al., “Health insurance in nonstandard jobs and small firms.”
52 Equal Employment Opportunity Act of 1972, 42 U.S.C. § 2000e(b) (1972).
53 Family and Medical Leave Act of 1993, 29 U.S.C. § 2601 et seq. (1993).
54 William M. Rodgers III, “The great recession’s impact on African American public sector employment,” Working Paper 12-01 (Heldrich Center for Workforce Development, Rutgers, The State University of New Jersey; and the National Poverty Center, University of Michigan, January 2012), http://www.npc.umich.edu/publications/working_pape rs/?publication_id=229.