An official website of the United States government
An official website of the United States government
The .gov means it's official.
Federal government websites often end in .gov or .mil. Before sharing sensitive information,
make sure you're on a federal government site.
The site is secure.
The
https:// ensures that you are connecting to the official website and that any
information you provide is encrypted and transmitted securely.
The number of hours that people work for pay is an important economic and social indicator. Many household surveys ask respondents to estimate their weekly work hours (we will refer to this type of question as an “estimate question”). One of the main sources of data on work hours is the Bureau of Labor Statistics household labor force survey, the Current Population Survey (CPS), which asks respondents about the usual number of hours worked per week and the actual number of hours worked during the previous week.
One might question the accuracy of hours reports from estimate questions because respondents are faced with the potentially complex cognitive task of remembering how much they worked during the previous week or estimating their “usual” weekly work hours. Moreover, even an accurate estimate of “usual” (modal) work hours may be a poor estimate of mean work hours. To validate hours data from estimate questions, some researchers (ourselves included) have compared responses to those questions to time diaries, which are detailed accounts of the previous day’s activities.1 Time-diary data are generally considered to be more accurate because of the short, typically 1-day, recall period and the requirement that the total time spent on all activities must sum to 24 hours.
The American Time Use Survey (ATUS) is a single-day time-diary survey that is administered to a sample of individuals in households that have recently completed their participation in the CPS. In addition to the time diary, the ATUS collects information about the respondents’ employment status and usual hours worked (the question is the same as that in the CPS). Thus, for each ATUS respondent, responses are available for three estimate questions about hours worked: usual and actual hours worked from the CPS and usual hours worked from the ATUS.
In an earlier article in the Review,2 we compared the responses to these three estimate questions with the time-diary estimates for the same set of respondents. We found that, on average, responses to the two usual-hours questions overestimated work hours, and that the overestimation was greater for the ATUS usual-hours question. But we also found that actual hours worked were correctly reported by CPS respondents.
In this article, we comment on the ATUS–CPS analysis in a 2011 Review article by John Robinson, Steven Martin, Ignace Glorieux, and Joeri Minnen (hereafter Robinson et al.),3 who used time-diary data from the ATUS to argue that hours of work are typically overestimated in household surveys. In contrast to our previous article, these authors found that responses to all three estimate questions overestimated hours worked, and that the magnitude of the overestimation was about the same for all three questions. They also found that reports of longer hours in the estimate questions were associated with larger overestimates relative to time-diary hours.
We examined Robinson et al.’s results closely and found that their main table of results contains extensive internal inconsistencies—evidence of programming or transcription errors.4 When we used the methods described in their article to attempt to replicate the table, the results were consistent with our earlier work and showed a negligible mean difference between CPS actual hours and diary hours. We also attempted to replicate Robinson et al.’s chart 1, which shows how the gap between estimated and diary hours varies with estimated hours. Our replication was qualitatively similar to theirs. However, the chart should be interpreted carefully, and the interpretation in Robinson et al. is somewhat misleading. We note instances of misinterpretation and discuss the proper interpretation.
The ATUS sample is a stratified random sample that is drawn from households that have completed their participation in the CPS and is weighted to be representative of the U.S. civilian noninstitutional population. The ATUS interviews occur 2–5 months after the final CPS interview, with most occurring
In addition to the time diaries, the ATUS updates most of the labor force information collected in the CPS. As mentioned earlier, the ATUS asks respondents to report their usual hours worked, and reports of usual hours worked and actual hours worked from the final CPS interview are available in the
CPS hours questions
Usual hours
HRUSL1< How many hours per week (do/does) (name/you) USUALLY work at (your/his/her) (job?/main job? By main job we mean) (the one at which (you/he/she) usually) ((work/works) the most hours.)
HRUSL2< How many hours per week (do/does) (you/he/she) USUALLY work at (your/his/her) other (job/jobs)?
Actual hours
HROFF1< Now I have some questions about the exact number of hours (name/you) worked (THE WEEK BEFORE LAST/LAST WEEK). (THE WEEK BEFORE LAST/LAST WEEK), did (you/he/she) lose or take off any hours from (work/(your/his/her) MAIN job), for ANY reason such as illness, slack work, vacation, or holiday?
HROFF2< How many hours did (name/you) take off?
HROT1< (THE WEEK BEFORE LAST/LAST WEEK), did (name/you) work any overtime or extra hours (at (your/his/her) MAIN job) that (you/he/she) (do/does) not usually work?
HROT2< How many ADDITIONAL hours did (you/he/she) work?
HRACT1< ((LAST WEEK/THE WEEK BEFORE LAST)/So, for (LAST WEEK/THE WEEK BEFORE LAST)), how many hours did (you/he/she) ACTUALLY work at (your/his/her) (job?/MAIN job?)
HRACT2< (THE WEEK BEFORE LAST/LAST WEEK), how many hours did (you/he/she) ACTUALLY work at (your/his/her) other (job?/jobs?)
The main table from Robinson et al. is reproduced as the top panel of table 1. The authors used data from the 2003–2007 ATUS and restricted their sample to respondents who were ages 18 to 64. For all workers, they found that the difference between hours from the estimate questions and the time diaries ranged from 2.8 hours to 3.6 hours. (Robinson et al. used the rightmost six columns of table 1 to supplement their discussion of their chart 1, which we discuss below.) Note that the samples, and hence the diary hours, differ depending on what estimate question they pertain to, because the diary hours are “for the same groups of people that answered the respective estimate questions.”6
| Estimates of hours worked from Robinson et al. | |||||||||
|---|---|---|---|---|---|---|---|---|---|
| Estimate question | Hours ≥ 1 | Hours ≥ 20 | Hours ≥ 35 | ||||||
| Estimated | Diary | Difference | Estimated | Diary | Difference | Estimated | Diary | Difference | |
All | |||||||||
ATUS usual hours | 39.5 | 36.3 | 3.2 | 41.3 | 37.4 | 3.9 | 44.0 | 40.4 | 3.6 |
CPS usual hours | 39.5 | 35.9 | 3.6 | 41.3 | 37.3 | 4.0 | 43.5 | 38.1 | 5.4 |
CPS actual hours | 38.7 | 35.9 | 2.8 | 41.3 | 37.6 | 3.7 | 43.5 | 40.4 | 3.1 |
Women | |||||||||
ATUS usual hours | 35.5 | 32.3 | 3.2 | 38.4 | 34.8 | 3.6 | 41.9 | 37.4 | 4.5 |
CPS usual hours | 36.7 | 32.1 | 4.6 | 39.1 | 33.9 | 5.2 | 42.2 | 36.2 | 6.0 |
CPS actual hours | 35.5 | 31.9 | 3.6 | 38.7 | 33.5 | 5.2 | 43.9 | 37.6 | 6.3 |
Men | |||||||||
ATUS usual hours | 42.7 | 40.6 | 2.1 | 44.2 | 41.8 | 2.4 | 45.8 | 42.8 | 3.0 |
CPS usual hours | 42.5 | 40.0 | 2.5 | 43.6 | 40.7 | 2.9 | 44.8 | 41.7 | 3.1 |
CPS actual hours | 42.5 | 40.0 | 2.5 | 43.8 | 41.3 | 2.5 | 46.7 | 42.8 | 3.9 |
| Implied percentage of men in the sample | |||||||||
|---|---|---|---|---|---|---|---|---|---|
| Estimate question | Hours ≥ 1 | Hours ≥ 20 | Hours ≥ 35 | ||||||
| Estimated | Diary | Difference | Estimated | Diary | Difference | Estimated | Diary | Difference | |
ATUS usual hours | 55.6 | 48.2 | 7.4 | 50.0 | 37.1 | 12.9 | 53.8 | 55.6 | -1.7 |
CPS usual hours | 48.3 | 48.1 | 0.2 | 48.9 | 50.0 | -1.1 | 50.0 | 34.5 | 15.5 |
CPS actual hours | 45.7 | 49.4 | -3.7 | 51.0 | 52.6 | -1.6 | -14.3 | 53.8 | -68.1 |
Source: Robinson et al., "The overestimated workweek revisited,” Monthly Labor Review, June 2011, and authors' calculations. | |||||||||
Table 1 also shows estimates for men and women. This information allows us to perform an internal consistency check on the columns of the table. Letting H denote average hours for the sample as a whole, H = pHm + (1 – p)Hw, where Hm denotes average hours for men, Hw denotes average hours for women, and p denotes the proportion of men in the sample. Neither sample sizes nor the proportions of men for each column are given in the table. However, it is straightforward to show that p = (H – Hw)/(Hm – Hw), so the proportion of men in the sample can be derived from the table. The bottom panel of table 1 shows the implied proportion of men for each set of estimates.
The results are striking. Although the sample for each estimate question should be identical to the sample for the corresponding diary hours in the next column, in only one case is the implied proportion of men within a percentage point of the neighboring column. (In one case, the implied proportion is negative, because the reported average hours for the entire sample are not between those for men and women.) Even in the single case in which the proportions are within a percentage point of each other—the case comparing CPS usual hours with diary hours for the sample with usual hours greater than, or equal to, 1 hour—the proportion of men is suspiciously low. While one would expect the proportion to be close to that of the CPS as a whole, the implied proportion of about 48 percent contrasts with the average CPS proportion of more than 53 percent for 2003–2007. Given this clear evidence of programming or transcription errors, the numbers in the top panel of table 1 cannot be relied on.
Table 2 presents our attempt to reproduce the estimates in table 1, using Robinson et al.’s description of their procedures (with one important exception described below). We show the difference between our estimates and the estimates in Robinson et al. in the bottom panel. Following Robinson et al., we restricted the sample to individuals age 18 to 64. For each of the time-diary estimates, responses were reweighted so that each day of the week receives equal weight (one-seventh of the total). The reweighted responses were then used to compute the average number of hours worked per day.
| Replication results | ||||||||||||
|---|---|---|---|---|---|---|---|---|---|---|---|---|
| Estimate question | Hours ≥ 1 | Hours ≥ 20 | Hours ≥ 35 | |||||||||
| Esti- mated | Diary | Differ- ence | Sample size | Esti- mated | Diary | Differ- ence | Sample size | Esti- mated | Diary | Differ- ence | Sample size | |
All | ||||||||||||
ATUS usual hours | 41.2 | 37.5 | 3.7 | 41,815 | 42.9 | 38.9 | 4.0 | 39,648 | 45.5 | 41.0 | 4.6 | 34,693 |
CPS usual hours | 40.4 | 38.4 | 2.0 | 37,740 | 41.5 | 39.2 | 2.3 | 36,343 | 43.4 | 40.5 | 2.9 | 32,550 |
CPS actual hours | 39.7 | 39.5 | 0.2 | 37,799 | 41.5 | 40.5 | 1.1 | 35,606 | 44.5 | 42.1 | 2.4 | 29,702 |
CPS actual hours, reference week | 39.7 | 40.7 | -.9 | 9,302 | 41.6 | 41.7 | -.1 | 8,757 | 44.6 | 43.3 | 1.3 | 7,328 |
Women | ||||||||||||
ATUS usual hours | 37.4 | 33.7 | 3.6 | 21,609 | 39.7 | 35.6 | 4.1 | 19,905 | 43.3 | 38.4 | 4.9 | 16,094 |
CPS usual hours | 37.5 | 34.7 | 2.8 | 19,354 | 39.2 | 35.9 | 3.3 | 18,210 | 41.9 | 37.7 | 4.2 | 15,218 |
CPS actual hours | 36.4 | 35.7 | .7 | 18,868 | 38.9 | 37.1 | 1.7 | 17,294 | 42.6 | 39.0 | 3.6 | 13,273 |
CPS actual hours, reference week | 36.3 | 36.4 | .0 | 4,594 | 38.9 | 37.9 | .9 | 4,218 | 42.7 | 39.8 | 2.8 | 3,256 |
Men | ||||||||||||
ATUS usual hours | 44.6 | 40.9 | 3.7 | 20,206 | 45.6 | 41.7 | 3.9 | 19,743 | 47.2 | 42.8 | 4.3 | 18,599 |
CPS usual hours | 42.8 | 41.5 | 1.3 | 18,386 | 43.4 | 41.9 | 1.5 | 18,133 | 44.4 | 42.6 | 1.9 | 17,332 |
CPS actual hours | 42.4 | 42.6 | -.2 | 18,931 | 43.6 | 43.0 | .6 | 18,312 | 45.7 | 44.2 | 1.5 | 16,429 |
CPS actual hours, reference week | 42.5 | 44.1 | -1.7 | 4,708 | 43.7 | 44.6 | -.9 | 4,539 | 45.8 | 45.5 | .3 | 4,072 |
| Differences with Robinson et al. estimates | ||||||||||||
|---|---|---|---|---|---|---|---|---|---|---|---|---|
| Estimate question | Hours ≥ 1 | Hours ≥ 20 | Hours ≥ 35 | |||||||||
| Esti- mated | Diary | Differ- ence | Sample size | Esti- mated | Diary | Differ- ence | Sample size | Esti- mated | Diary | Differ- ence | Sample size | |
All | ||||||||||||
ATUS usual hours | 1.7 | 1.2 | 0.5 | 41,815 | 1.6 | 1.5 | 0.1 | 39,648 | 1.5 | 0.6 | 1.0 | 34,693 |
CPS usual hours | 0.9 | 2.5 | -1.6 | 37,740 | .2 | 1.9 | -1.7 | 36,343 | -.1 | 2.4 | -2.5 | 32,550 |
CPS actual hours | 1.0 | 3.6 | -2.6 | 37,799 | .2 | 2.9 | -2.6 | 35,606 | 1.0 | 1.7 | -.7 | 29,702 |
CPS actual hours, reference week | 1.0 | 4.8 | -3.7 | 9,302 | .3 | 4.1 | -3.8 | 8,757 | 1.1 | 2.9 | -1.8 | 7,328 |
Women | ||||||||||||
ATUS usual hours | 1.9 | 1.4 | .4 | 21,609 | 1.3 | .8 | .5 | 19,905 | 1.4 | 1.0 | .4 | 16,094 |
CPS usual hours | 0.8 | 2.6 | -1.8 | 19,354 | .1 | 2.0 | -1.9 | 18,210 | -.3 | 1.5 | -1.8 | 15,218 |
CPS actual hours | 0.9 | 3.8 | -2.9 | 18,868 | .2 | 3.6 | -3.5 | 17,294 | -1.3 | 1.4 | -2.7 | 13,273 |
CPS actual hours, reference week | 0.8 | 4.5 | -3.6 | 4,594 | .2 | 4.4 | -4.3 | 4,218 | -1.2 | 2.2 | -3.5 | 3,256 |
Men | ||||||||||||
ATUS usual hours | 1.9 | 0.3 | 1.6 | 20,206 | 1.4 | -.1 | 1.5 | 19,743 | 1.4 | .0 | 1.3 | 18,599 |
CPS usual hours | 0.3 | 1.5 | -1.2 | 18,386 | -.2 | 1.2 | -1.4 | 18,133 | -.4 | .9 | -1.2 | 17,332 |
CPS actual hours | -0.1 | 2.6 | -2.7 | 18,931 | -.2 | 1.7 | -1.9 | 18,312 | -1.0 | 1.4 | -2.4 | 16,429 |
CPS actual hours, reference week | 0.0 | 4.1 | -4.2 | 4,708 | -.1 | 3.3 | -3.4 | 4,539 | -.9 | 2.7 | -3.6 | 4,072 |
Source: Authors' calculations using 2003–2007 data from the American Time Use Survey and the Current Population Survey. | ||||||||||||
There are several ways to define work in the time diary. Robinson et al. state that their “diary figures include all activity clearly reported as work in the diary, including short breaks and social events that took place during the workday.”7 We take this to mean that activities coded “work at main or other job” and “other activities done as part of main or other job” were counted as work. This definition is slightly different from the one used in our previous work.8 To aid in replication, we give detailed specifications of our sample restrictions and definitions in the appendix.
One difference between our methodology and that in Robinson et al. is the sample definition. In private correspondence, Robinson informed us that he and his coauthors did not restrict the sample on the basis of employment status in any of their comparisons. For the comparison of ATUS usual hours with ATUS diary hours, the sample definition in Robinson et al. does not pose much of a problem, because only those who were employed at the time of the ATUS interview were asked to report their usual hours.9 However, not restricting the sample to the employed does pose a problem for the comparisons of diary hours with hours from the CPS estimate questions. While respondents to the CPS hours questions were employed at the time of their CPS interview, about 5 percent were not employed at the time of the ATUS interview, but were apparently included in Robinson et al.’s CPS comparisons.
For the comparison of diary hours to CPS usual hours, we restricted the sample to those who report being employed during both the final CPS interview and the ATUS interview.10 Both the CPS and the ATUS distinguish between those who worked during the previous week and those with a job but not at work. The CPS actual-hours questions are asked only for those who worked during the previous week. Accordingly, we restrict the sample for the CPS actual-hours comparison to those who reported working during the previous week both in the CPS and in the ATUS.11
Our estimates of work hours for both the diary and estimate questions tend to be higher than those shown in table 1. For the samples associated with the comparisons to CPS usual and actual hours, our diary-hours estimates are substantially greater than those in table 1. Accordingly, our replication shows a much smaller difference between diary hours and hours from the CPS estimate questions. For the sample as a whole, the average difference between CPS actual hours and diary hours is only 0.2 hour per week. Although including respondents “with a job but not at work” in the usual-hours comparisons results in differences between diary hours and usual hours (both ATUS and CPS) that are somewhat larger than those in our other work, the overall pattern of differences is similar.
If one is interested in whether CPS respondents report work hours correctly, comparing CPS actual hours and diary hours that cover the entire month is not appropriate because the reference periods differ. The reference period for the CPS is the week containing the 12th of the month.12 This week was specifically chosen to avoid holidays and thus would be expected to have greater average hours of work. Accordingly, we have added a row to each panel of table 2, showing the difference between diary hours and CPS actual hours for a sample in which the diary hours are restricted to CPS reference weeks. This comparison shows that, for the sample as a whole, CPS actual hours are less than diary hours of work by almost an hour. (This result implies that the difference between reference-week and nonreference-week hours is about 1.5 hours per week).
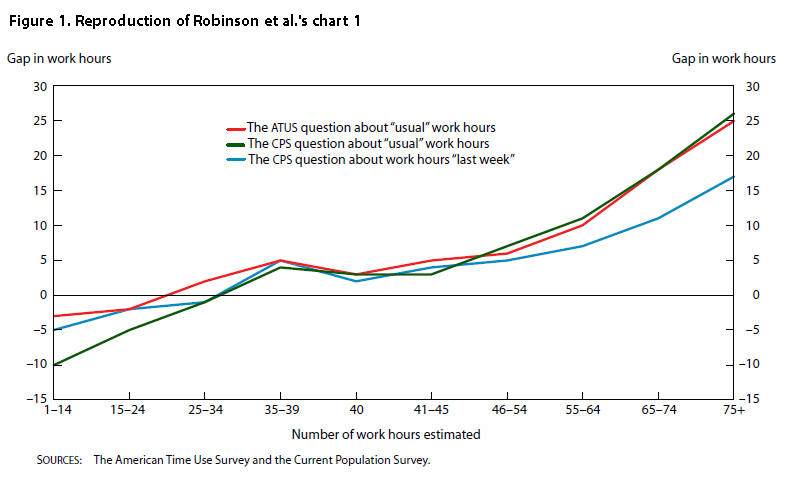
We now turn to Robinson et al.’s claim that those who work longer hours tend to overreport their hours. Figure 1, which reproduces chart 1 in Robinson et al., shows the difference between estimate-question hours and time-diary hours as a function of estimate-question hours. Figure 2 is our attempt to replicate Robinson et al.’s chart 1, using estimated hours that are analogous to those in table 2 above. (We use diary data for the CPS reference week for the “CPS actual” categories.)
Our results are qualitatively similar to Robinson et al.’s: the gap between estimate-question hours and diary hours grows almost monotonically for each comparison, going from negative to positive as reported hours increase. Unlike Robinson et al., we find that for much of the range, especially the extremes, the gaps between ATUS usual hours and time-diary hours are the closest to zero of the three measures. This result holds despite the greater bias for ATUS usual hours. Although the patterns documented in figure 1 confirm Robinson et al.’s statement that “the greater the estimate, the greater the overestimate,” these patterns need to be interpreted carefully. We now discuss what the figures do and do not show.
Let hu denote an estimate of usual weekly hours of work from an estimate question, h* denote the true mean weekly hours, and e denote reporting error:
(1) hu ≡ h* + e.
Observed diary hours are given by
(2) hd ≡ h*/7 + v,
where v represents variability of diary hours around the long-term daily mean. Because v represents variation in actual hours worked around the long-run mean, by construction, it is uncorrelated with h* and E(v) = 0. In contrast, E(e) does not necessarily equal zero. Also note that the error term, e, is uncorrelated with v.
Figure 2 essentially shows the mean reporting error, e, given hu.13 If there is no reporting error, hu = h*,
Therefore, graphs like figures 1 and 2 at most show evidence of reporting error (i.e., that Var(e) > 0). Even if there is no relation between true hours worked and reporting error, one would still expect respondents who exaggerate their work hours to be overrepresented among those who report particularly long hours and underrepresented among those who report short hours. Because a positive relationship between hu and e does not imply anything about the relationship between h* and e, the figures tell us nothing about whether persons who actually work long hours, as opposed to those who report long hours, overreport their hours more, on average. Robinson et al.’s article does not recognize this distinction. It alludes to the “difference in the accuracy of estimates between people who work more hours and those who work fewer hours”14 and “the underestimation of work hours by those with shorter workweeks.”15
Analysis of the gap between estimated actual hours and time-diary hours requires a slight modification of equation (1) to account for an additional source of variability:
(1') ha ≡ hr* + u + e',
where ha denotes actual hours, hr* denotes true mean of reference-week hours, u represents the variation of actual hours from their long-term mean, and e' denotes measurement error in actual hours. Note that, like v in equation (2), u is mean zero and uncorrelated with hr* by construction. In this case, the relevant line in figure 1 corresponds to plotting (u + e') against ha. Compared with the graph of ATUS usual hours against reporting error (and assuming e and e' have roughly equal variances), the variation in actual hours worked, u, makes up a greater proportion of the variation in reported hours, ha. Accordingly, we would expect the figure to show a greater positive slope, as we do, in fact, observe. As expected, CPS usual hours roughly fall between CPS actual hours and ATUS usual hours, as usual hours change for some respondents between the CPS and the ATUS but do not reflect the week-to-week variation, u.
Robinson et al. found fairly similar differences between estimated hours and diary hours for all three estimate questions. In contrast, we found a larger range, from an overestimate of 3.7 hours for ATUS usual hours to an underestimate of 0.9 hour for CPS actual hours (when the sample for the latter comparison is restricted to CPS reference weeks).16 This implies that the question “Is the workweek overestimated?” has no single answer; the correct answer depends on the specific questions about hours of work, the survey context, and the definition of work.
Perhaps the most surprising finding is the substantial difference in gaps when comparing ATUS usual hours and CPS usual hours with time-diary hours. The difference between ATUS usual hours and time-diary hours is 1.7 hours larger than the difference between CPS usual hours and time-diary hours.17
This result may be partly due to CPS respondents having more experience answering the hours questions than do ATUS respondents. The CPS households (more strictly, addresses, since movers are not followed) are in the CPS sample for 8 months over a 16-month period (4 months in the survey, 8 months out, and 4 months in). CPS interviewers try to interview the same household member (hereafter the “self-respondent”) each month and gather information about other members of the household only through the household respondent. Consequently, by the time of the last CPS interview, the self-respondent had been interviewed up to eight times and, in most cases, had been interviewed for the previous 3 months. By contrast, the ATUS respondent may be different from the CPS self-respondent and may be answering the usual-hours questions for the first time. Even when the ATUS respondent was the CPS self-respondent, he or she had not answered the hours questions for several months.
Respondent experience matters because it is well documented that answers to labor force questions vary by month-in-sample (MIS).18 ATUS respondents who were not CPS self-respondents are comparable to CPS self-respondents in their first month-in-sample (MIS 1), while ATUS respondents who were also CPS self-respondents are comparable to CPS self-respondents in MIS 5, when they return to the CPS sample after an 8-month break. MIS 1 self-respondents report 1.1 more hours, on average, than do MIS 8 self-respondents, while MIS 5 respondents report 0.4 more hours. Overall, weighting these MIS effects by the proportion of ATUS respondents who were and were not CPS self-respondents, we can explain 0.7 hour of the difference between CPS usual hours and ATUS usual hours.
We do not have any evidence on the source of the remaining differential of 1.1 hours. One might speculate that some respondents exaggerate their work hours because the ATUS is specifically about time use, and the survey’s introduction to respondents states that the purpose of the ATUS is to ask “how people divide their time between work, family and other demands in our fast-paced society.”
Turning to a comparison of CPS usual and actual hours, excluding those with a job but not at work from the average of CPS usual hours shrinks the difference from 1.8 hours to 0.6 hour. This difference is similar to that estimated using the complete data from the CPS. If the CPS usual-hours question were an estimate of mean hours worked, one would expect actual hours to be equal to, or greater than, usual hours, because we know that people work longer hours in CPS reference weeks, which exclude most holidays. One possible explanation for the contrary finding is that respondents reply with the mode, rather than the mean, of hours worked, as suggested by the wording of the question. If the distribution of weekly work hours for a person has more mass on the left tail, because of time off, than on the right tail, because of longer-than-usual hours, modal hours will be above mean hours.
The results for CPS actual hours indicate that, on average, respondents underreport their hours worked during the reference week by a small amount. In previous research, in which we use a broader, unmatched sample, we find that the difference between CPS actual hours and diary hours is essentially zero.19 As shown in the box presented earlier, CPS actual hours are derived from a series of questions. The usual-hours question anchors the response, and the follow-up questions direct the respondent to focus on the previous week. This sequence of questions appears to substantially reduce bias relative to asking a single question. So one answer to the question “Is the workweek overestimated?” is “Not by average CPS respondents answering questions about the previous week.”20
Another question of interest is whether the CPS overestimates total hours worked. As we noted above, diary hours during CPS reference weeks are about 1.5 hours greater than during nonreference weeks. In the matched sample used here, there is a negligible difference between CPS actual and diary hours for the month as a whole. In our other research, we see a small positive difference. Thus, workweeks are overestimated by the CPS in the sense that CPS reference weeks are not representative of the entire month.
WE HAVE SHOWN THAT THE KEY TABLE in Robinson et al. exhibits substantial internal inconsistencies, which render it of no value in assessing any bias in CPS questions on work hours. Our replication of the table produced results similar to those in our earlier work—a substantial bias for the ATUS usual-hours question, less bias for CPS usual hours, and a small negative bias for CPS actual hours.
Robinson et al.’s chart 1 (reproduced as figure 1 in this article) is qualitatively accurate. However, the authors appear to interpret the chart as showing that workers who work longer hours overreport their hours by a greater amount. In fact, we demonstrated that the chart shows only that workers who report longer hours overreport their hours by a greater amount. This is to be expected in the presence of misreporting—in particular, when misreporting is uncorrelated with actual hours worked.
The wide range of over- and underestimates of work hours corresponding to the different survey questions implies that answers to the question “Is the workweek overestimated?” depend on the specific questions and survey context. The answer to a general question in a one-shot survey may differ from the answer derived from a series of questions about the previous week in a repeated survey. Given that the CPS is one of the main sources of hours data, the small magnitude of the bias in CPS hours reports is reassuring.
The specifications for table 2 are as follows:
Harley Frazis and Jay C. Stewart, "Is the workweek really overestimated?," Monthly Labor Review, U.S. Bureau of Labor Statistics, June 2014, https://doi.org/10.21916/mlr.2014.21
1 The ATUS and most time-use surveys collect data for 1 day, but some collect data for more than 1 day.
2 Harley Frazis and Jay Stewart, “What can time-use data tell us about hours of work?” Monthly Labor Review, December 2004, pp. 3–9, https://www.bls.gov/opub/mlr/2004/12/art1full.pdf. See also Frazis and Stewart, “Where does the time go? Concepts and measurement in the American Time Use Survey,” in Ernst Berndt and Charles Hulten, eds., Hard to measure goods and services: essays in memory of Zvi Griliches, NBER Studies in Income and Wealth (Chicago: University of Chicago Press, 2007), pp. 73–97; Frazis and Stewart, “Comparing hours worked per job in the Current Population Survey and the American Time Use Survey,” Social Indicators Research, August 2009, pp. 191–195; and Frazis and Stewart, “Why do BLS hours series tell different stories about trends in hours worked?” in Katharine G. Abraham, James R. Spletzer, and Michael Harper, eds., Labor in the new economy, NBER Studies in Income and Wealth (Chicago: University of Chicago Press, 2010), pp. 343–372, where we find similar results. For similar results for the United Kingdom, see Richard D. Williams, “Investigating hours worked measurements,” Labour Market Trends, February 2004, pp. 71–79.
3 John Robinson, Steven Martin, Ignace Glorieux, and Joeri Minnen, “The overestimated workweek revisited,” Monthly Labor Review, June 2011, pp. 43–53, https://www.bls.gov/opub/mlr/2011/06/art3full.pdf.
4 So far, we have been unable to reproduce the results in Robinson et al.’s table 1. We have shared an earlier draft of this article with Professor Robinson and his coauthors. Robinson, who has written to us to state that he performed the data analysis for the ATUS–CPS comparison in Robinson et al., has been unable to locate the relevant programs as of this writing.
5 The ATUS does not collect actual hours worked during the previous week.
6 Robinson et al., “The overestimated workweek revisited,” p. 48.
7 Ibid., p. 46.
8 The definition of work in our previous research included time spent traveling between job sites (same job) and time spent in breaks of 15 minutes or less. This definition required the use of episode-level, rather than summary, data, because these episodes are not identified as work time. We assume that Robinson et al. did not include these episodes in work time. On the other hand, our preferred definition of work does not include job-related activities such as socializing.
9 The sample definition in Robinson et al. includes a small fraction of the employed who were “with a job but not at work” during the previous 7 days.
10 “Hours vary” responses to the usual-hours question are also excluded.
11 In our previous work (see endnote 2), we also restricted the sample to people who worked in the previous week in our comparisons of usual hours to diary hours, on the basis that we were interested in the average workweek conditional on working at all. One could argue that it is appropriate to include people with a job but not at work if one is interested in annual working time. For comparability with Robinson et al., this paper includes those with a job but not at work in the comparisons of diary hours with usual hours.
12 There are exceptions, such as when the collection week (the week that includes the 19th) is close to a major holiday. This situation occurs frequently in December and, occasionally, in November. In those cases, the reference week is the week that includes the 5th.
13 Because we are examining the mean of (e – 7v) given h, rather than a scatterplot, and v is mean zero and uncorrelated with e, with a sufficiently large sample, v will not appreciably affect the line shown in the figures.
14 Robinson et al., “The overestimated workweek revisited,” p. 52.
15 Ibid., p. 51.
16 The overestimate for ATUS usual hours is reduced to 2.6 hours when those with a job but not at work are excluded from the comparison; so, even in this case, the range of differences in hours estimates is still substantial.
17A direct comparison of ATUS and CPS usual hours using a matched sample of respondents who report both yields a difference of 1.5 hours.
18 One key reference is Barbara A. Bailar, “The effects of rotation group bias on estimates from panel surveys,” Journal of the American Statistical Association, March 1975, pp. 23–30.
19 Frazis and Stewart, “Where does the time go?”
20 The CPS actual-hours questions in table 1 are from MIS 8. Hours derived from these questions are lower than average CPS actual hours by about 0.3 hour. Also note that different demographic groups show significant over- and underreporting, so the small magnitude of the aggregate bias does not apply universally. See the references in endnote 2.