An official website of the United States government
An official website of the United States government
The .gov means it's official.
Federal government websites often end in .gov or .mil. Before sharing sensitive information,
make sure you're on a federal government site.
The site is secure.
The
https:// ensures that you are connecting to the official website and that any
information you provide is encrypted and transmitted securely.
For the past several decades, U.S. consumers have been considered an “engine” of economic growth in the United States.1 In 2012 they were responsible for just under 71 percent of U.S. gross domestic product (GDP), almost 8 percentage points higher than in 1960.2 American consumers have also played a prominent role in the global economy, accounting for just over 15 percent of world GDP in 20123 (see figure 1).
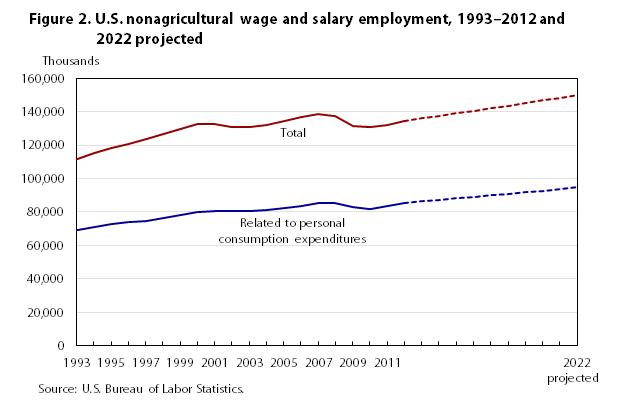
When consumers shop, they directly support4 jobs in companies that produce, transport, and sell final goods and services. Consumers also indirectly support jobs that make inputs (intermediates) requisite for final production. More U.S. jobs directly or indirectly relate to consumer spending than to all other sectors of the economy combined. In 2007, which was the business cycle peak prior to the latest economic downturn, 85.1 million nonagricultural wage and salary jobs related to consumer spending; these jobs were 61.5 percent of total nonagricultural wage and salary employment in the United States5(see figure 2). But unlike GDP, the percentage of U.S. jobs tied to consumption has fluctuated within a relatively stable range since the late 1970s because of labor-saving technologies and increased consumption of imports (see figure 3).
During the “Great Recession,” which took place from late-2007 through mid-2009, the economy steeply contracted and nearly 8.7 million jobs were lost.6 Consumer spending experienced the most severe decline since World War II.7Households cut spending, shed outstanding debt, and increased their rate of personal savings in response to reductions in income, wealth, confidence, and credit access.8
With persistently high unemployment rates, the weak revival in job growth has been one of the most debated aspects of the recent recession.9 Several structural and cyclical factors have been proposed as causes, including the nature of the financial crisis, dependency of the economy on services, economic and policy uncertainty, extended unemployment insurance, and high long-term unemployment rates.10 Many have also blamed sluggish consumer spending: as Federal Reserve Chairman Ben Bernanke stated in 2011, “Consumer behavior has both reflected and contributed to the slow pace of recovery.”11 Others made stark statements, such as, “Don't expect [U.S.] consumer spending to be the engine of economic growth it once was.”12
Using an input–output methodology, this article estimates U.S. employment related to each final demand component in the latest recession (2007–2009) and during the recovery years through 2012, with a focus on consumer spending. Though consumer behavior during and after the recession has been documented in various papers,13 the relationship between consumption and employment has not yet been quantified in the literature.14 This article also projects the number and type of U.S. jobs relating to consumer spending in 2022 using the most recent economic and employment projections developed by the Office of Occupational Statistics and Employment Projections at the Bureau of Labor Statistics (BLS).15
BLS estimates that the number of jobs tied to consumer demand declined by 3.2 million from the 2007 employment peak to 2010, the year of the employment trough. The 3.2 million were over a third of the total 8.7 million jobs lost in that time frame, and most of the consumer-related job losses were concentrated in three industries: manufacturing, professional and business services, and retail trade.16 In contrast, over half of total job losses between 2007 and 2010 occurred in investment-related employment, which is typically more sensitive than consumer-related jobs to the business cycle. The largest annual decline in consumer-related employment occurred in 2009. In 2010, after the recession officially ended, consumer-related employment accounted for the majority of job declines in the entire economy.
Despite the postrecession decline in consumer-related employment and the historic decline in spending, consumer-related employment demonstrated relative stability both during and after the recession, upheld by gains in two sectors: health care and social assistance,17 and educational services.18 The percentage of jobs in the economy supported by consumers increased (see figure 3) as the share of investment-related employment fell to unprecedented levels. And by 2012, consumer-related employment reached prerecession marks, while overall employment did so in 2014.19 The relative resilience of consumption reflects its stability in comparison with other GDP components during economic slumps.
As the economy continues to recover and the baby boomers age, BLS projects that consumer spending will grow 2.6 percent annually from 2012 through 2022, expanding slower than in the past and at the same pace as the overall economy. The rise of consumer spending as a percentage of GDP is also anticipated to stabilize, thus ending past decades of relative growth in comparison with other GDP components (see figure 1). Consumer-related employment is projected to increase 1.0 percent annually to reach 94.7 million jobs in 2022 (see figure 2), slightly slower than both past growth rates and the projected 1.1 percent annual growth rate for all employment. But as consumer expenditures on traditionally labor-intensive services like health care continue to grow, 63.2 percent of jobs in the U.S. economy are expected to relate to consumption in 2022; this percentage is within the stable historic range (see figure 3). Over half of the new 9.1 million consumer-related jobs are anticipated to be in the health care and social assistance sector, and 94.5 percent of all consumer-related jobs are projected to be in services.
This article is arranged in the following manner: the first section reviews the methodology to translate consumer spending to employment using the input–output system, while the second section goes over prerecession consumption and employment trends. The third section summarizes consumer-related employment during the latest recession and recovery, comparing it with the economy as whole and other GDP components. The fourth section looks at consumer-related employment for major sectors and detailed industries during the latest recession and recovery. The last presents BLS projections of consumer-related and total employment through 2022.
Consumer spending, referred to interchangeably in this article as “consumer demand” or “personal consumption expenditures” (PCE), measures the purchase of goods and services by households and nonprofit institutions serving households. Furthermore, by definition PCE includes other expenditures, such as employer contributions for health insurance and workers’ compensation, imputed rent of owner-occupied housing, indirect financial services, in-kind social benefits, and expenses for pensions and life insurance.20 BLS uses annual PCE data from the National Income and Product Accounts published by the Bureau of Economic Analysis (BEA). To estimate the number of U.S. jobs related to consumer demand, BLS first adjusts PCE to reflect only the purchase of U.S.-produced goods and services. Otherwise, the purchase of imports would artificially inflate U.S. production data (and jobs) according to the input–output methodology used.21 Import-adjusted consumer expenditures, or “domestic PCE,” are reported for 189 diverse industries that correspond to 17 major sectors that are then coupled into either goods-producing or service-providing categories. Domestic PCE for the 17 major sectors are listed in table 1.
| Industry | Billions of 2005 constant dollars(1) | Percent change | Annual percent change | ||||||
|---|---|---|---|---|---|---|---|---|---|
| 2007 | 2008 | 2009 | 2010 | 2011 | 2012 | 2022 | 2007–2010 | 2012–2022 | |
| All industries | 8,723.8 | 8,684.0 | 8,561.2 | 8,708.4 | 8,950.7 | 9,137.1 | 11,860.2 | -0.2 | 2.6 |
| Goods-producing | 1,054.3 | 1,014.4 | 1,013.1 | 996.5 | 1,031.2 | 1,063.5 | 1,273.7 | -5.5 | 1.8 |
Mining | < .1 | .1 | .1 | < .1 | < .1 | < .1 | .1 | <.1 | 1.6 |
Construction | .0 | .0 | .0 | .0 | .0 | .0 | .0 | — | — |
Manufacturing | 1,054.3 | 1,014.4 | 1,013.1 | 996.4 | 1,031.2 | 1,063.5 | 1,273.7 | -5.5 | 1.8 |
| Service-providing | 7,669.5 | 7,669.6 | 7,548.1 | 7,711.9 | 7,919.5 | 8,073.6 | 10,586.5 | .6 | 2.7 |
Utilities | 215.3 | 211.2 | 213.6 | 216.9 | 212.3 | 207.7 | 252.8 | .7 | 2.0 |
Wholesale trade | 381.8 | 386.7 | 345.4 | 374.7 | 406.1 | 418.5 | 544.4 | -1.8 | 2.7 |
Retail trade | 1,029.4 | 1,000.3 | 982.5 | 1,059.2 | 1,100.0 | 1,148.5 | 1,572.5 | 2.9 | 3.2 |
Transportation and warehousing | 205.1 | 197.7 | 189.4 | 183.5 | 189.0 | 189.9 | 247.3 | -10.5 | 2.7 |
Information | 405.5 | 418.8 | 415.0 | 438.9 | 471.3 | 482.7 | 721.3 | 8.2 | 4.1 |
Financial activities | 1,111.3 | 1,110.6 | 1,058.7 | 1,070.4 | 1,081.5 | 1,092.2 | 1,394.9 | -3.7 | 2.5 |
Professional and business services | 200.0 | 200.5 | 190.7 | 190.5 | 190.0 | 195.9 | 238.5 | -4.7 | 2.0 |
Educational services | 226.8 | 230.7 | 232.3 | 237.0 | 244.8 | 249.7 | 300.5 | 4.5 | 1.9 |
Health care and social assistance | 1,531.5 | 1,578.5 | 1,609.0 | 1,633.4 | 1,691.8 | 1,719.3 | 2,346.0 | 6.7 | 3.2 |
Leisure and hospitality | 734.0 | 727.2 | 695.3 | 712.9 | 737.1 | 761.4 | 920.4 | -2.9 | 1.9 |
Other services | 459.5 | 455.0 | 422.6 | 422.2 | 429.9 | 439.4 | 548.6 | -8.1 | 2.2 |
Federal government | 6.4 | 6.0 | 5.5 | 5.0 | 4.6 | 4.4 | 3.0 | -20.3 | -3.5 |
State and local government | 52.1 | 52.0 | 53.4 | 53.0 | 53.4 | 55.4 | 69.5 | 1.7 | 2.3 |
Special industries(2) | 1,110.7 | 1,094.5 | 1,134.6 | 1,114.2 | 1,107.6 | 1,108.7 | 1,426.7 | .3 | 2.6 |
Notes: (1) For convenience, industry figures have been summed rather than chain weighted. (2) Special industries, such as imputed rent of owner-occupied dwellings, affect GDP but do not lead to employment. Note: Figures may not add because of rounding. Source: U.S. Bureau of Labor Statistics. | |||||||||
BLS translates import-adjusted expenditures to employment using an input–output system, which traces the purchase of a good or service through the entire chain of production, from intermediate production to final sales. The diagram summarizes the input–output system.
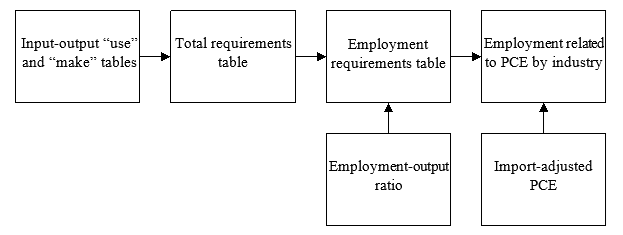
BLS utilizes input–output “use” and “make” tables to determine interindustry production relationships. The “use” table shows what commodities each industry uses for production (inputs), and the “make” table shows what commodities each industry ultimately creates (outputs). Both tables are used to calculate a “total requirements table,” which shows how much total output directly and indirectly is required based on interindustry relationships per final demand dollar. Then, the total requirements table is transformed to an employment requirements table using employment–output ratios that reflect labor productivity. Import-adjusted PCE is then multiplied by the employment requirements table—which is also import-adjusted—to arrive at net annual PCE-related employment.22 The employment figure includes jobs both directly and indirectly related to PCE, but not induced employment.23 In summary, BLS first determines how much production (output) supports domestic consumer demand, and then production (output) is translated to employment using trends in labor productivity, or employment–output ratios.
In contrast to past BLS publications, in this article the terms “consumer-supported” or “consumer-related” employment are preferred to “consumer-generated” employment. This is because changes in consumer-related employment are driven not just by consumer demand, but also by factors such as the commodity distribution of demand, relationships between output and demand (total requirements matrix), and employment–output ratios. Furthermore, in the context of the recession, a simultaneity issue exists between consumer spending and total job loss: do consumers cut spending in response to an economic downturn, or is a downturn caused or worsened because of consumer behavior? For this analysis, BLS simply estimates the correlation between consumer spending and overall employment but does not assert the causal direction of the relationship.
Though most attention in this article is given to 2007–2012 and projections through 2022, long-term trends for consumption and employment use a time series dating back to 1993. Historical BLS publications are relied upon to determine approximate ranges for the period from 1977 to 1993. All spending figures are in 2005 real (inflation-adjusted) dollars and based on BEA data published in March 2013.24 Only nonfarm wage and salary employment is addressed in this article, at both an aggregate and PCE-related level.
Leading up to the 2007–2009 recession, consumer spending as a percentage of GDP had risen for 40 years, increasing from just over 61 percent in 1966 to just under 70 percent in 2006 (see figure 1). PCE growth also outpaced general economic expansion (see figure 4). Consumers bought increasingly more services, and the composition of PCE shifted over time with rising in-kind social benefits and third-party contributions towards health insurance and workers’ compensation.25 As a result, the percentage of PCE stemming from direct household expenditures declined from 84.5 percent in 1960 to 67.6 percent in 2006.26
The late 1990s saw a surge in spending as Americans bought new technology and globalization ushered in less expensive imports. Economic growth, rising home values and equity, easy credit, and declining personal savings rates also prompted higher consumer spending, supplemented by baby boomers reaching their highest earning years.27 The 2001 recession and its lingering effects briefly tempered consumer spending, but growth rates rose again as Americans spent more on durable household items, new technology, and vehicles as the housing bubble peaked in 2005.28
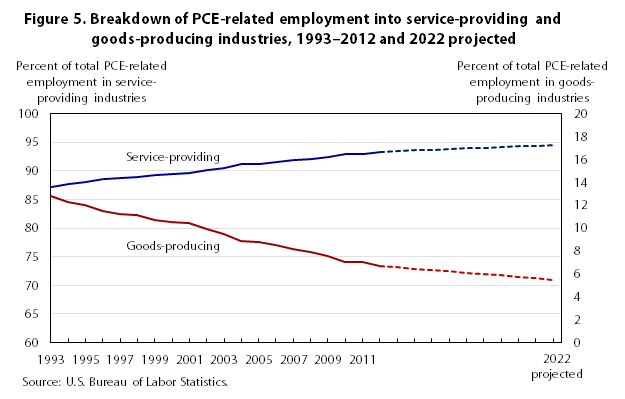
Even though consumer spending as a share of GDP rose several percentage points, the percentage of U.S. jobs supported by consumers fluctuated within a lower, narrow range prior to the 2007–2009 recession (see figure 3). Between 1993 and 2006, PCE-related employment accounted for roughly 60 to 62 percent of all employment. In fact, consumers have been responsible for a relatively stable percentage of total employment since the late 1970s: BLS previously estimated that PCE-related employment ranged between 61 to 63 percent for 1985–2000 and 60 to 64 percent for 1977–1993.29 But over time, a greater percentage of consumer-related jobs have been in services (see figure 5).
Between 1993 and 2007, PCE grew 3.5 percent annually while PCE-related employment grew 1.5 percent annually. Some of the discrepancy was due to increased consumption of imported goods. But domestic PCE, which removes imported goods and services, still grew 3.0 percent annually—about twice as fast as PCE-related employment. The remaining disparity between PCE and PCE-related employment can be attributed to productivity improvements, such as automation that reduces labor requirements. Broader measures of economic activity showed similar discrepancies. Overall GDP grew 3.2 percent annually between 1993 and 2007, while total employment grew 1.5 percent annually over the same period.
To understand the complete relationship between consumer spending and employment, we must also evaluate the relationship between all GDP components and employment as well. Focusing on consumer spending, this section covers employment related to each final demand component annually during the latest recession and the recovery years through 2012. The section concludes with an analysis of long-run trends affected by the recent recession.
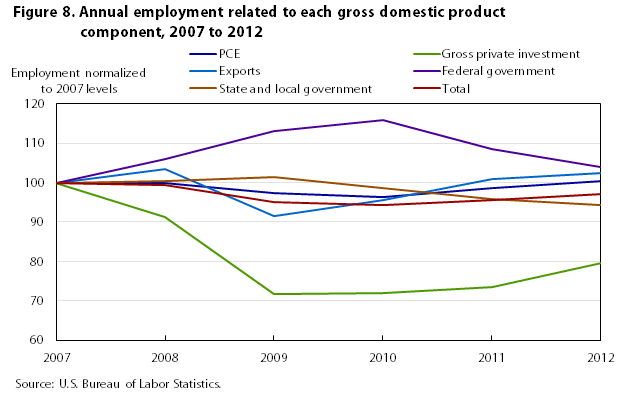
Tables 2 and 3 document output and employment levels in the recession tied to each final demand component, as well as showing projections to 2022.30, 31 Even though the recession ended in 2009, employment changes for the 2007–2010 time period are included in table 3 because overall employment levels peaked in 2007 and troughed in 2010. Tables 1 and 4 break out domestic PCE and consumer-related employment by major sector—which are reviewed in more depth in the next section—and figure 6 illustrates quarterly PCE from 2007 through 2012. Figures 7 and 8 plot the output and employment path of each final demand component in comparison with 2007 levels,32 while figure 9 shows the net annual change of employment that is related to each final demand component.
| Gross domestic product component | Billions of chained 2005 dollars | Annual rate of change | Contribution to percentage change in real GDP | ||||||
|---|---|---|---|---|---|---|---|---|---|
| 2007 | 2008 | 2009 | 2010 | 2011 | 2012 | 2022 | 2012–2022 | 2012–2022 | |
| Total GDP | 13,206.4 | 13,162.0 | 12,757.9 | 13,063.0 | 13,299.2 | 13,593.3 | 17,584.2 | 2.6 | 2.6 |
| Personal consumption expenditures | 9,262.9 | 9,211.7 | 9,032.6 | 9,196.1 | 9,428.8 | 9,603.3 | 12,380.1 | 2.6 | 1.8 |
Durable goods | 1,232.5 | 1,171.9 | 1,109.2 | 1,178.3 | 1,262.6 | 1,361.0 | 1,935.7 | 3.6 | .3 |
Nondurable goods | 2,042.9 | 2,019.1 | 1,982.8 | 2,029.4 | 2,075.2 | 2,094.5 | 2,556.6 | 2.0 | .3 |
Services | 5,990.2 | 6,017.0 | 5,930.6 | 5,987.6 | 6,101.5 | 6,176.6 | 7,973.1 | 2.6 | 1.2 |
| Gross private investment | 2,159.5 | 1,939.8 | 1,458.1 | 1,658.1 | 1,744.0 | 1,914.4 | 3,038.2 | 4.7 | .7 |
| Exports | 1,554.5 | 1,649.3 | 1,498.7 | 1,665.6 | 1,776.9 | 1,837.4 | 3,117.7 | 5.4 | .8 |
| Imports(1) | 2,203.3 | 2,144.0 | 1,853.8 | 2,085.2 | 2,184.9 | 2,238.1 | 3,296.8 | 3.9 | -.7 |
| Federal government | 906.1 | 971.1 | 1,030.6 | 1,076.8 | 1,047.0 | 1,024.1 | 861.6 | -1.7 | -.1 |
| State and local government | 1,528.1 | 1,528.1 | 1,561.8 | 1,534.1 | 1,482.0 | 1,461.7 | 1,615.1 | 1.0 | .1 |
| Residual(2) | -1.4 | 6.0 | 29.9 | 17.6 | 5.3 | -9.5 | -131.7 | — | — |
Notes: (1) Imports are subtracted from the other components of GDP because they are not produced in the United States. (2) The residual is calculated as real gross domestic product, plus imports, less other components. Sources: U.S. Bureau of Economic Analysis (2013) and U.S. Bureau of Labor Statistics. | |||||||||
| Gross domestic product component | Employment in thousands | Change | Percent change | Change | Annual percent change | ||||||
|---|---|---|---|---|---|---|---|---|---|---|---|
| 2007 | 2008 | 2009 | 2010 | 2011 | 2012 | 2022 | 2007-2010 | 2007–2010 | 2012–2022 | 2012–2022 | |
| Total nonagricultural wage and salary employment | 138,351.3 | 137,600.2 | 131,608.4 | 130,535.5 | 132,171.9 | 134,427.6 | 149,751.3 | -7,815.8 | -5.6 | 15,323.7 | 1.1 |
| Personal consumption expenditures | 85,144.0 | 85,136.4 | 82,971.5 | 81,982.0 | 83,839.3 | 85,505.8 | 94,650.1 | -3,162.0 | -3.7 | 9,144.3 | 1.0 |
| Gross private investment | 16,999.4 | 15,512.8 | 12,203.0 | 12,218.2 | 12,505.8 | 13,553.8 | 17,374.2 | -4,781.2 | -28.1 | 3,820.4 | 2.5 |
| Exports(1) | 9,215.8 | 9,531.0 | 8,434.9 | 8,808.5 | 9,293.3 | 9,426.2 | 12,334.3 | -407.3 | -4.4 | 2,908.1 | 2.7 |
| Federal government | 5,252.2 | 5,562.4 | 5,940.8 | 6,090.6 | 5,700.8 | 5,458.8 | 4,200.4 | 838.5 | 16.0 | -1,258.4 | -2.6 |
| State and local government | 21,739.9 | 21,857.5 | 22,058.1 | 21,436.2 | 20,832.7 | 20,483.0 | 21,192.3 | -303.7 | -1.4 | 709.3 | .3 |
Notes: (1) See endnote 30 in accompanying article. Note: Figures may not add because of rounding. Source: U.S. Bureau of Labor Statistics. | |||||||||||
2007. In the last quarter of 2007, the first official quarter of the recession, consumer spending peaked at $9.3 trillion (see figure 6). At that time, 85.1 million jobs—61.5 percent of total U.S. employment—related to consumer spending (see figures 2–3 and table 3). Goods-producing industries claimed 8.2 percent of consumer-related employment (just under 7 million jobs), while 91.8 percent (78.2 million jobs) was in services (see figure 5 and table 4). As the housing market collapsed and the financial crisis ensued, spending and employment relating to private fixed investment—which includes spending on structures, equipment, and software related to production—continued to decline from its 2006 peak, sparking economic contraction (see figures 7–9).
| Industry | Employment in thousands | Change | Percent change | Change | Annual percent change | ||||||
|---|---|---|---|---|---|---|---|---|---|---|---|
| 2007 | 2008 | 2009 | 2010 | 2011 | 2012 | 2022 | 2007–2010 | 2007–2010 | 2012–2022 | 2012–2022 | |
| All industries | 85,144.0 | 85,136.4 | 82,971.5 | 81,982.0 | 83,839.3 | 85,505.8 | 94,650.1 | -3,162.0 | -3.7 | 9,144.3 | 1.0 |
| Goods-producing | 6,983.8 | 6,723.3 | 6,267.7 | 5,744.8 | 5,880.6 | 5,761.9 | 5,233.8 | -1,238.9 | -17.7 | -528.1 | -1.0 |
Mining | 186.5 | 192.7 | 188.5 | 176.8 | 180.4 | 183.1 | 175.7 | -9.7 | -5.2 | -7.4 | -.4 |
Construction | 638.9 | 640.7 | 654.2 | 557.4 | 586.9 | 457.8 | 510.8 | -81.5 | -12.8 | 53.0 | 1.1 |
Manufacturing | 6,158.4 | 5,890.0 | 5,425.1 | 5,010.7 | 5,113.3 | 5,121.0 | 4,547.3 | -1,147.7 | -18.6 | -573.7 | -1.2 |
| Service-providing | 78,160.3 | 78,413.1 | 76,703.8 | 76,237.2 | 77,958.6 | 79,743.9 | 89,416.3 | -1,923.1 | -2.5 | 9,672.4 | 1.2 |
Utilities | 439.6 | 437.8 | 452.6 | 447.1 | 452.0 | 456.6 | 402.6 | 7.5 | 1.7 | -53.9 | -1.2 |
Wholesale trade | 3,432.2 | 3,324.8 | 3,340.3 | 3,073.6 | 3,150.1 | 3,197.4 | 3,090.9 | -358.7 | -10.5 | -106.4 | -.3 |
Retail trade | 14,147.0 | 14,212.0 | 13,727.8 | 13,532.1 | 13,887.0 | 14,089.0 | 14,894.4 | -614.8 | -4.3 | 805.4 | .6 |
Transportation and warehousing | 2,776.0 | 2,752.0 | 2,689.4 | 2,562.3 | 2,649.6 | 2,716.1 | 2,773.1 | -213.7 | -7.7 | 57.0 | .2 |
Information | 2,150.2 | 2,130.6 | 1,998.8 | 1,928.0 | 1,913.0 | 1,904.6 | 1,827.3 | -222.2 | -10.3 | -77.2 | -.4 |
Financial activities | 6,957.1 | 6,949.8 | 6,635.9 | 6,526.5 | 6,508.1 | 6,532.8 | 6,787.9 | -430.6 | -6.2 | 255.1 | .4 |
Professional and business services | 10,035.1 | 9,778.5 | 8,999.9 | 9,145.6 | 9,751.8 | 10,181.2 | 11,639.2 | -889.5 | -8.9 | 1,458.0 | 1.3 |
Educational services | 2,823.4 | 2,953.4 | 3,020.8 | 3,076.7 | 3,188.2 | 3,294.0 | 3,947.5 | 253.3 | 9.0 | 653.5 | 1.8 |
Health care and social assistance | 14,779.9 | 15,148.4 | 15,563.6 | 15,849.6 | 15,980.6 | 16,340.9 | 21,414.3 | 1,069.7 | 7.2 | 5,073.4 | 2.7 |
Leisure and hospitality | 12,352.3 | 12,388.6 | 12,067.4 | 12,051.4 | 12,372.2 | 12,855.1 | 13,960.7 | -300.9 | -2.4 | 1,105.6 | .8 |
Other services | 5,828.3 | 5,861.8 | 5,703.0 | 5,629.4 | 5,717.5 | 5,791.7 | 6,362.4 | -198.9 | -3.4 | 570.6 | .9 |
Federal government | 646.9 | 649.0 | 635.6 | 586.0 | 567.0 | 551.4 | 394.0 | -61.0 | -9.4 | -157.4 | -3.3 |
State and local government | 1,792.2 | 1,826.5 | 1,868.5 | 1,828.9 | 1,821.4 | 1,833.0 | 1,921.8 | 36.7 | 2.0 | 88.8 | .5 |
| Special industries(1) | .0 | .0 | .0 | .0 | .0 | .0 | .0 | — | — | 0 | — |
Notes: (1) Special industries impact GDP but do not lead to employment, such as imputed rent of owner-occupied dwellings. Note: Figures may not add because of rounding. Source: U.S. Bureau of Labor Statistics. | |||||||||||
2008. By the last quarter of 2008, as the recession deepened, consumers cut spending by over $200 billion from the previous year to just under $9.1 trillion, with lower purchases of goods, especially vehicles. Employment supported by consumer spending decreased slightly as consumer-supported jobs fell by 7,600 (see figure 9 and table 3). Nearly all PCE-related employment declines were confined to goods-producing industries (see table 4). Investment-related employment essentially accounted for the entirety of job declines for the whole economy in 2008. Government-related spending and employment at the federal level increased, while state and local government-related spending and employment remained virtually flat. Export-related spending and employment increased slightly (see figures 7–9).
2009. In 2009 consumers spent just under $9.0 trillion in the second quarter, the last official quarter of the recession. This was the lowest PCE value registered in the recession. Services were particularly affected, especially transportation, food services, recreation, and financial services. PCE-related employment declined that year by 2.2 million jobs, or 2.5 percent. Of those 2.2 million jobs, 1.7 million were in service-providing industries and 456,000 in goods-producing industries. More PCE-related (and total) jobs were lost in 2009 than any other year in the recession (see figure 9 and table 3).
Excluding government-related employment gains, lower consumer spending was associated with one-third of the 6.6-million job decrease in 2009. Half of the 6.6-million decline related to investment spending, while 17 percent related to exports. Exports have been a bright spot in the U.S. economy in recent years, and the only net annual job declines for export-related employment occurred in 2009. Meanwhile, employment related to federal, state, and local governments increased by a combined 579,000.
2010. Consumer spending slowly recovered through 2010 after bottoming out in the second quarter of 2009. The revival in spending, however, was the weakest since the 1940s, especially for services and nondurable goods.33 Spending growth of durable goods also remained low, with little boost from low interest rates for durable goods purchases.34 As for domestic PCE, consumer spending on U.S. goods-producing industries actually declined in 2010 (see table 1). With weak growth, in 2010 PCE contributed less to GDP growth than did gross private investment—the first time since 1984.
Typically, employment tends to lag output in recovery from recessions. This held for PCE-related and, consequently, total employment in the latest recession. Even as PCE slowly recovered, PCE-related employment continued to decline through 2010 with 989,500 fewer jobs—a smaller decrease than in 2009—as the economy began to turn around (see figures 8 and 9). (In contrast, employment levels increased (or decreased) the same year that output levels did for the investment, export, and government sectors in the Great Recession.) PCE-related employment recovery was also impaired by weak spending on labor-intensive services and lower purchases towards goods-producing industries. A similar number of consumer-related jobs in goods-producing industries were lost (a decline of 523,000 jobs) as service-providing ones (a 467,000 decline) in 2010 (see table 4).
Consumer-related employment accounted for the majority (61.4 percent) of job loss among GDP sectors that experienced employment declines in 2010, which was 1 year after the recession officially ended. State and local government-related employment, experiencing its first decline in this business cycle, accounted for the remainder of the decrease. Meanwhile, export-related employment improved, while investment-related employment remained essentially flat. Employment and spending related to the federal government peaked in 2010, supported by the employment increase with the administration of the 2010 Census (see figures 7–9 and tables 2–3).
In total, the number of jobs tied to consumer demand declined by 3.2 million from the 2007 employment peak to the 2010 trough, representing a 3.7 percent decrease (see table 3). By 2010, PCE-related employment stood at levels last seen in 2005. The recession had a disproportionate impact on goods-producing industries: although less than 10 percent of PCE-related jobs are involved in making goods, these industries represented 39.2 percent of consumer spending–related job reductions between 2007 and 2010. Services accounted for the remaining 60.8 percent (see table 4).
The total economy experienced a net decline of 7.8 million jobs between 2007 and 2010 as employment fell to levels last seen in 2000. This represents a 5.6-percent decrease, which was greater than the consumer-related job decrease and signaled the relative stability of PCE. After federal government–related employment increases are excluded, a total 8.7 million35 jobs were lost between 2007 and 2010. PCE-related employment accounted for over a third of this decline—36.5 percent—while over half of job reductions correlated with investment spending (see figure 10 and table 3). Because of its cyclical nature, investment-related employment experienced much larger and more rapid declines than all other sectors of the economy: between its peak and trough (2006–2009), investment-related employment fell 31.2 percent, a reduction of 5.5 million jobs. Many of those jobs were related to the construction industry. The remainder of the decline between 2007 and 2010 was in export-related employment (4.7 percent, or –407,300), and in state and local government–related employment (3.5 percent, or –303,700).36
2011. In 2011 consumer spending grew 2.5 percent, recovering to prerecessionary levels in the first quarter (see figures 6–7). The 3-year journey back to 2007 spending levels was the slowest recovery from recession since World War II.37 As for employment, PCE-related jobs increased 2.3 percent as nearly 1.9 million jobs were added. Because of the unavailability of historical PCE-related employment time series, the growth rate can’t be compared with postrecessionary time periods prior to 1993. However, 2.3 percent was generally in the range of PCE-related employment growth in the late 1990s. With 83.8 million PCE-related jobs, levels remained over a million shy of the 2007 peak (see figure 8).
In 2011 overall employment increased by 1.6 million jobs or 1.3 percent, well below the job growth following other recessions and slower than PCE-related gains. Federal government–related employment began to decline from its 2010 peak, while export-related employment reached 2007 levels. Declining government-related employment at the federal, state, and local levels, as well as weak investment-related employment growth, were the primary causes of low employment growth in 2011 (see figures 8–9 and table 3).
2012. In 2012 consumer spending and its related employment expanded slower than in 2011, as the unemployment rate remained elevated around 8 percent in the United States and the Eurozone slipped into another recession. PCE increased 1.9 percent—the slowest growth rate for a nonrecessionary year (except 2010) since 1951—while PCE-related employment expanded 2.0 percent (see figure 9 and table 3).
In 2012 PCE-related employment finally recovered recessionary losses (see figure 8). Because the time series of employment relating to consumption only extends back to 1993, the recovery from the latest recession can only be compared with the 2001 recession. In the 2001 recession, PCE-related employment took 3 years to recover to 2001 highs, and total employment took 4 years to recover. In the most recent recession, PCE-related employment recovered in 5 years, while total employment required 7. The quicker recovery of PCE-related employment in comparison with the overall economy reflects the relatively stability of consumption during the business cycle, the strong performance of some of its subsectors (see next section), and the negative toll of low investment spending on broader economic recovery in the latest recession.
In contrast to PCE-related employment, total employment expanded faster in 2012 than in 2011 as investment spending began to show stronger recovery (see figure 9)—nonetheless, the overall employment growth rate remained lower than rates typically seen following recessions. In addition to slow consumer-related employment growth, declining government-related employment and diminished export-related growth all hindered overall job growth in 2012. Total employment stood 3.9 million below 2007 levels, and investment-related employment remained at 76.4 percent of its prerecession 2006 peak.
Long-run trends. Despite the historic decline in spending, consumers nevertheless supported a higher proportion of jobs during the latest recession than they had from the inception of the data series in 1993 through 2008, although the percentage of employment related to consumer spending from 2009 to 2012 was still within the long-run historic range (see figure 3). Between 1993 and 2007, consumer-related employment fluctuated between 60 and 62 percent of total employment—at the lower end of the historic range dating to the late 1970s—when the percentage of investment-related employment increased to fuel economic expansion. But in 2009, the worst year of the recession, PCE-related employment increased to 63 percent of U.S. employment and then rose again in 2011 and 2012 as investment-related employment remained near historic lows and government-related employment began to decline (see table 3). In fact, investment-related employment declined to levels previously unobserved in this time series (which, as previously noted, dates back to 1993).
The larger role of consumption during the latest recession and recovery reflects its stability in comparison with other GDP components in the business cycle; the relative stability has been a consistent pattern with all recessions following WWII.38 Consumers still need vital goods and services like food and shelter during economic downturns even as some businesses entirely shut down. The relative stability also reflects the positive performance of specific sectors for PCE-related employment in the recession, as is discussed in the next section. Furthermore, the larger percentage of PCE-related employment as a share of all employment underscores the severity of the recession. As seen in figure 3, PCE-related employment as a percentage of all employment tends to increase during economic contractions, when investment-related employment declines more rapidly, and decrease during expansions, when investment-related employment rises more quickly. Figures 7 and 8 also demonstrate the volatility of each GDP component and the whole economy for output and employment and further reveal the relative stability of PCE.
This section analyzes PCE-related employment at the major sector and detailed industry levels, including the most consumer-dependent industries, from 2007 through 2012. For major sectors, it analyzes overall 2007–2010 employment changes, specific declines in 2010 (the year when consumer-related employment constituted the majority of job declines), and the recovery. For detailed industries, the research focuses on 2007–2010 changes exclusively. The section then concludes with an analysis of long-run sector trends that were affected by the recession. Table 1 shows domestic PCE and table 4 breaks down PCE-related employment for 17 major sectors.
PCE-related employment by major sector. A few sectors were not as affected by the latest recession, and they added PCE-related employment from 2007 to 2010. Because of the aging of baby boomers and the increased demand for health care, the health care and social assistance industry added nearly 1.1 million jobs related to PCE (see tables 1 and 4). With tight economic conditions, enrollment in postsecondary education programs increased—especially community colleges—leading to over 253,000 more PCE-related jobs in educational services.39 With a 9.0 percent growth rate, this sector grew faster than any other for consumer-related (and total) employment during the recession, followed by the health care and social assistance industry, which grew 7.2 percent. State and local government employment related to consumers grew 2.0 percent by adding 36,700 jobs. These jobs included mostly transportation and enterprises such as utilities, transit systems (including parking and tolls), and gambling. Consumer-related employment also increased, by 7,500, in private utilities.
The remaining sectors were responsible for nearly 4.5 million consumer-related job losses between 2007 and 2010. Of those 4.5 million jobs, just over three-quarters were concentrated in five industries: manufacturing, professional and business services, retail trade, financial activities, and wholesale trade. Manufacturing jobs related to U.S. consumption declined by over 1.1 million, while professional and business services declined by 889,500. Most of the declines in professional and business service jobs were in the employment services category, primarily an intermediate service that includes employment placement agencies, temporary help services, and professional employer organizations. PCE-related employment also declined by 614,800 for retail trade (4.3 percent), 431,000 for financial activities (6.2 percent), and 358,700 for wholesale trade (10.4 percent).40
From 2009 to 2010, when the majority of employment declines were consumer-related, five major industry sectors were primarily responsible for the PCE-related job declines: manufacturing, wholesale trade, retail trade, transportation, and financial activities. PCE-related manufacturing jobs alone declined by 414,400. As for services, wholesale trade was particularly affected, with PCE-related employment decreasing by 8 percent (266,700 jobs). In total, more goods-producing jobs tied to consumption were lost than service-providing jobs in 2010. This differs from 2009, when more service-providing jobs were lost. The larger decline in goods-producing jobs in 2010 coincided with a larger decline in consumer demand for those industries than the previous year (see tables 1 and 4).
The recovery of PCE-related employment in 2012 to prerecession levels varied by major sector, and largely occurred in industries that weren’t as affected by the recession. In 2012 six major sectors surpassed 2007 levels: utilities, professional and business services, educational services, health care and social assistance, leisure and hospitality, and state and local government. Only two of those sectors actually had experienced PCE-related declines between 2007 and 2010: professional and business services, and leisure and hospitality. As for sectors that did not recover, in 2012 PCE-related wholesale trade jobs remained 235,000 jobs below 2007 levels, while PCE-related employment in retail trade had 58,000 fewer jobs than in 2007 . Financial activities had 424,000 fewer PCE-related jobs, while manufacturing lost more than 1 million such jobs.
In comparison with the recovery from the 2001 recession, the severity of the recent recession can be observed at the major sector level. For example, both the professional and business services sector and the leisure and hospitality sector required 1 more year to recover PCE-related employment in the latest recession than in the 2001 recession. Furthermore, PCE-related jobs in retail trade had not recovered as of 2012—5 years after the recession began—while they required 4 years to recover from the 2001 recession. PCE-related jobs in wholesale trade hadn’t recovered as of 2012 either, whereas they took 6 years to recover after the 2001 recession.
PCE-related employment by detailed industry: Table 5 shows the detailed industries with the top 10 largest and most rapid consumer-related employment declines from 2007 to 2010. All of the industries with the largest job declines were services—such as trade, finance, information services, and food services—with the exception of printing and related support activities. Seven of the industries with the largest PCE-related declines were among the industries that also experienced the largest employment declines in the overall economy, with the exception of private households, telecommunications, and printing and related support activities. Lower consumer spending correlated with the most PCE-related job reductions in the retail trade industry, which declined by 614,800 jobs.
| Largest declines | Level change | Most rapid declines(2) | Percent change |
|---|---|---|---|
| Retail trade(1) | -614,832 | Motor vehicle body and trailer manufacturing(1) | -49.2 |
| Employment services(1) | -588,033 | Ship and boat building | -45.1 |
| Wholesale trade(1) | -358,651 | Navigational, measuring, electromedical, and control instruments manufacturing | -40.3 |
| Monetary authorities, credit intermediation, and related activities(1) | -238,303 | Spring and wire product manufacturing | -38.2 |
| Food services and drinking places(1) | -158,388 | Motor vehicle parts manufacturing(1) | -38.1 |
| Private households | -146,000 | Motor vehicle manufacturing(1) | -38.0 |
| Newspaper, periodical, book, and directory publishers(1) | -109,163 | Veneer, plywood, and engineered wood product manufacturing(1) | -37.9 |
| Telecommunications | -102,229 | Other transportation equipment manufacturing | -37.3 |
| Truck transportation(1) | -99,068 | Manufacturing and reproducing magnetic and optical media(1) | -37.2 |
| Printing and related support activities | -89,841 | Audio and video equipment manufacturing(1) | -36.8 |
| Largest gains | Level change | Most rapid gains(2) | Percent change |
| Hospitals(1) | 303,348 | Federal enterprises except the postal service and electric utilities(1)(3) | 20.0 |
| Junior colleges, colleges, universities, and professional schools(1) | 176,006 | Home health care services(1) | 18.8 |
| Home health care services(1) | 171,148 | Individual and family services(1) | 16.2 |
| Individual and family services(1) | 168,950 | Grantmaking and giving services and social advocacy organizations(1) | 13.0 |
| Offices of health practitioners(1) | 163,749 | Outpatient, laboratory, and other ambulatory care services(1) | 12.8 |
| Nursing and residential care facilities(1) | 149,089 | Junior colleges, colleges, universities, and professional schools(1) | 12.0 |
| Outpatient, laboratory, and other ambulatory care services(1) | 120,413 | Software publishers | 11.5 |
| Religious organizations | 70,754 | Other educational services(1) | 11.4 |
| Other educational services(1) | 60,757 | Hospitals | 7.1 |
| Local government enterprises except passenger transit | 44,500 | Nursing and residential care facilities | 5.4 |
| Notes: (1) Also listed among the top 10 industries that changed in the total economy. (2) Note that industries with rapid gains or losses may have low personal consumption expenditures-related employment, hence small absolute changes translate to large percentage changes. (3) Federal enterprises are typically intermediate services, like the National Flood Insurance Program. Source: U.S. Bureau of Labor Statistics. | |||
The 10 industries with the most rapid declines in PCE-related jobs were all manufacturing industries. Several were involved in the housing and auto markets, such as motor vehicle body and trailer manufacturing (–49.2 percent); motor vehicle parts manufacturing (–38.1 percent); motor vehicle manufacturing (–38.0 percent); and veneer, plywood, and engineered wood product manufacturing (–37.9 percent). Six of the industries with the most rapid PCE-related job declines were also among the top 10 industries with the most rapid declines in the overall economy. The remaining four industries with the most rapid job declines for the overall economy were all investment-related in the construction industry. (Note that some of the industries that shed jobs most quickly when consumer demand lessened had a low base of consumer-related employment to begin with).
Table 5 also shows the detailed industries with the largest and most rapid gains in consumer-related employment during the latest recession. Industries that gained the most jobs related to consumer spending were typically in the health care or education sectors. Health care and education jobs were also among the fastest growing for both consumer-related employment and total employment.
Table 6 ranks the top 20 detailed industries that were most dependent on consumer spending in 2010—meaning industries with the highest ratio of PCE-related jobs to total jobs—and shows how they fared during the recent recession. With the exception of beverage manufacturing, the last in the ranking, all industries most dependent on consumers were service-providing industries. Just over half of the most consumer-dependent industries gained jobs between 2007 and 2010, many because they are in the health care and education fields. Other heavily dependent industries with higher income elasticities of demand, such as recreation and personal services industries, experienced declines associated with lower consumer spending in the recession.
| Detailed industry | Percent of total employment related to PCE, 2010 | PCE-related employment change (in thousands), 2007–2010 | Percent change, 2007–2010 |
|---|---|---|---|
Private households | 100.0 | -146.0 | -18.0 |
Personal care services | 99.9 | -7.2 | -1.2 |
Home health care services | 99.9 | 171.1 | 18.8 |
Religious organizations | 99.8 | 70.8 | 4.4 |
Grantmaking and giving services and social advocacy organizations | 99.8 | 43.6 | 13.0 |
Museums, historical sites, and similar institutions | 99.5 | -2.1 | -1.6 |
Individual and family services | 99.2 | 168.9 | 16.2 |
Elementary and secondary schools | 98.9 | 16.6 | 2.0 |
Hospitals | 98.2 | 303.3 | 7.1 |
Outpatient, laboratory, and other ambulatory care services | 98.1 | 120.4 | 12.8 |
Death care services | 98.1 | -3.5 | -2.6 |
Child day care services | 98.0 | -.9 | -.1 |
Funds, trusts, and other financial vehicles | 98.0 | -3.0 | -3.4 |
Community and vocational rehabilitation services | 97.7 | -6.1 | -1.2 |
Insurance carriers | 97.4 | 42.4 | 3.1 |
Junior colleges, colleges, universities, and professional schools | 97.4 | 176.0 | 12.0 |
Amusement, gambling, and recreation industries | 96.8 | -53.1 | -3.8 |
Other educational services | 96.1 | 60.8 | 11.4 |
Offices of health practitioners | 95.9 | 163.7 | 4.7 |
Beverage manufacturing | 95.3 | -9.7 | -5.7 |
Source: U.S. Bureau of Labor Statistics. | |||
The industry composed of grantmaking, giving services, and social advocacy organizations is also heavily dependent on PCE. Most PCE in this industry comes from the final consumption expenditures of nonprofit institutions serving households. PCE-related employment grew 13.0 percent between 2007 and 2010 for this industry, putting it among the fastest growing industries for both consumer-related and total employment during this time frame. Employment and spending growth in this industry dissipated as the weak recovery of the recession took place through 2011 and 2012.
Long-run trends. The recent recession had a notable impact on two long-run trends relating to employment and consumer spending: first, the percentage of PCE-related jobs devoted to health care and social assistance increased; and second, the percentage of PCE-related manufacturing jobs declined.
The percentage of PCE-related jobs in the health care and social assistance industry increased relative to other sectors during the 2007–2009 recession, rising from 17.4 percent in 2007 to 19.3 percent in 2010, as other sectors were affected by the recession and baby boomers continued to age (see figure 11 and table 4). On the other hand, the percentage of PCE-related jobs in the retail industry hovered around 16.5 percent. In 2011 and 2012, as employment began to recover in other sectors, the percentage of PCE-related jobs in the health care and social assistance sector held steady. With aging baby boomers, however, upward employment pressure will likely continue for this industry (see projections section).
The recession also had an impact on the decline of PCE-related manufacturing jobs. Consumers—who support over 40 percent of all U.S. manufacturing jobs—have increased spending on items from U.S. manufacturing industries over the past several decades.41 Yet the number of jobs required to satisfy that demand has fallen because of productivity gains. The same pattern exists for all manufacturing jobs in the United States. As seen in table 4, the latest recession intensified the decline of consumer-supported employment in manufacturing industries between 2007 and 2010. Yet in 2011 and 2012, manufacturing jobs tied to consumption (and the overall economy) did not decline for the first time since 1998. Higher domestic demand for the products of U.S. manufacturing industries appears to have reversed the decline in those years (see table 1).42
With the impact of the Great Recession on consumers and with the aging of the U.S. population, will consumers drive economic growth through 2022? Will they continue to support the majority of U.S. jobs? To determine the impact of consumer spending on future economic growth, we take into consideration both the projected output of the U.S. economy and employment estimated for a full-employment economy.
Output. BLS projects that the 2007–2009 recession and other factors will have an adverse effect on the U.S. economic outlook through 2022.43 The aging of the population, lack of business investment during the recession, and high long-term unemployment are expected to place constraints on potential GDP growth. As such, U.S. GDP is not expected to attain the higher growth rates that are typically seen following recessions as the economy settles into a “new normal.” BLS projects that GDP will increase to $17.6 trillion by 2022 at a 2.6-percent compound annual growth rate, which is slower than prerecession growth rates (see figure 4 and table 2).
Consumer spending, like the total economy, is projected to experience slower growth than its prerecession rates as demographics shift and consumer behavior changes. As the baby boomers leave the labor force, their consumption is expected to decline and shift more towards services. In fact, BLS projects that 58.6 million people—17.3 percent of the population—will be over age 65 by 2022, compared with 41.9 million, or 13.3 percent, in 2012.44 In addition, the latest recession is expected to alter consumer behavior in the long run with an expected personal savings rate of 3.7 percent in 2022; this is higher than the prerecession rates, which were based on higher household net worth and reliance on credit.45 Per-capita real disposable income is also projected to grow more slowly than it did prior to the 2007–2009 recession. A projected expansion of 1.8 percent annually is faster than the 0.9-percent growth for 2002–2012 but short of the 2.3-percent growth for 1992–2002.46
In light of these factors, BLS projects that PCE, growing at the same rate as the overall economy, will expand 2.6 percent annually between 2012 and 2022 (see figure 4 and table 2). This differs from every 10-year time span since 1942, during which consumer spending grew faster than did the overall economy. The projected growth of PCE is more rapid than the 1.8-percent annual compound growth rate for 2002–2012 but slower than the swift 3.8-percent annual rate for 1992–2002 and the 2.9-percent annual rate for 2002–2007. Consumers are projected to be responsible for 67.4 percent of all GDP growth; this percentage is lower than in previous decades, when PCE accounted for 75.3 and 80.8 percent of growth for 1992–2002 and 2002–2012, respectively.47 The distributional change is typical for postrecessionary periods, because investment revives to make other GDP components appear less important. With the resurgence in investment, strong growth in exports, and the changing demographics of consumers, the decades-long rise of consumer spending as a percentage of nominal GDP is expected to stabilize (see figure 1).
Employment: Total employment, by expanding at an annual growth rate of 1.1 percent and adding 15.3 million more jobs, is projected to reach 149.8 million by 2022 (see figure 2 and table 3).48 This growth rate is faster than the 2002–2012 annual 0.3-percent rate that was dampened by the recession, but is slower than the 1.8 percent achieved for 1992–2002 and equivalent to the 1.1 percent for 2002–2007. Over 90 percent of the new jobs are anticipated to be in services, with the remaining growth coming from the recovering construction industry. Nearly a third of job growth is projected to be in the health care and social assistance sector.
Because the majority of jobs in services—which are expected to account for over 90 percent of new job growth—relate to PCE,49 consumers are projected to remain a stable and important force in the economy through 2022. The health care and social assistance sector alone, which is projected to supply nearly a third of new jobs, is overwhelmingly dependent on consumers by definition.50 By 2022 consumers are projected to support an additional 9.1 million jobs, or 59.7 percent of all job growth, with PCE-related jobs increasing to 94.7 million (see figure 2 and table 3). This represents 63.2 percent of 2022 projected U.S. employment and is at the higher end of the stable historic range (see figure 3). The percentage of all jobs related to consumers tends to decline during times of economic expansion as investment-related employment increases in share (see figure 3); through 2022, however, upward pressure exists for PCE-related employment with the growth of labor-intensive, consumer-dependent industries such as health care.
Like PCE, employment related to PCE is projected to grow slower than it did prior to the latest recession. Between 2012 and 2022, PCE-related employment is projected to grow 1.0 percent annually, slower than the 1.5 percent for 1993–2007 and the 1.1 percent for 2002–2007. The PCE-related employment projected growth rate is slightly slower than, though similar to, the projected 1.1-percent annual growth rate for all employment through 2022.
In comparison with PCE-related employment, employment related to investment is projected to grow 2.5 percent annually, reaching 17.4 million in 2022, as the investment sector continues to recover from the recession. Growing faster than any other GDP component, export-related jobs are projected to increase 2.7 percent annually to reach 12.3 million in 2022. For the public sector, employment related to the federal government is projected to decline, while employment related to state and local government is projected to grow 0.3 percent annually to reach 21.2 million.
Seven of the top ten industries projected to have the largest growth through 2022—most notably health care–related industries—are largely dependent upon consumer spending, as seen in table 7. Consumer spending also plays a prominent role in 4 of the top 10 industries projected to experience the fastest growth through 2022, as seen in table 8. The other fastest growing industries in the overall economy are involved with construction as investment spending rebounds. Several of the top industries with expected large and rapid declines also depend largely on PCE, but not to the extent of those with large and rapid projected job gains do.
| Industry description | Thousands of jobs | Change | Compound annual rate of change | Percent of employment related to personal consumption expenditures | |
|---|---|---|---|---|---|
| 2012 | 2022 | 2012–2022 | 2012 –2022 | 2012 | |
| Largest growth | |||||
| Construction | 5,641 | 7,263 | 1,622 | 2.6 | 8.1 |
| Offices of health practitioners | 3,968 | 5,194 | 1,226 | 2.7 | 96.4 |
| Retail trade | 14,875 | 15,966 | 1,091 | .7 | 94.7 |
| Food services and drinking places | 9,963 | 10,852 | 888 | .9 | 94.1 |
| Hospitals, private | 4,791 | 5,606 | 815 | 1.6 | 95.5 |
| Employment services | 3,148 | 3,930 | 782 | 2.2 | 67.7 |
| Nursing and residential care facilities | 3,194 | 3,954 | 761 | 2.2 | 93.0 |
| Home health care services | 1,199 | 1,914 | 716 | 4.8 | 99.9 |
| Individual and family services | 1,311 | 2,023 | 712 | 4.4 | 99.4 |
| Computer systems design and related services | 1,620 | 2,229 | 609 | 3.2 | 20.3 |
| Outpatient, laboratory, and other ambulatory care services | 1,151 | 1,674 | 522 | 3.8 | 98.1 |
| Wholesale trade | 5,673 | 6,143 | 470 | .8 | 56.4 |
| Management, scientific, and technical consulting services | 1,121 | 1,577 | 456 | 3.5 | 60.0 |
| General local government educational services compensation | 7,779 | 8,234 | 454 | .6 | .0 |
| Junior colleges, colleges, universities, and professional schools | 1,763 | 2,197 | 433 | 2.2 | 98.2 |
| Services to buildings and dwellings | 1,830 | 2,109 | 279 | 1.4 | 74.3 |
| Architectural, engineering, and related services | 1,323 | 1,596 | 272 | 1.9 | 23.2 |
| Child day care services | 856 | 1,052 | 197 | 2.1 | 98.7 |
| Securities, commodity contracts, and other financial investments and related activities | 814 | 1,001 | 187 | 2.1 | 76.7 |
| Accommodation | 1,817 | 1,999 | 182 | 1.0 | 88.2 |
| Largest declines | |||||
| General federal nondefense government compensation | 1,557 | 1,376 | -180 | -1.2 | .0 |
| Postal service | 611 | 442 | -169 | -3.2 | 76.5 |
| Newspaper, periodical, book, and directory publishers | 452 | 347 | -105 | -2.6 | 76.9 |
| Apparel manufacturing | 148 | 62 | -86 | -8.3 | 73.9 |
| State government enterprises | 500 | 442 | -58 | -1.2 | 88.6 |
| Other miscellaneous manufacturing | 268 | 211 | -57 | -2.4 | 54.2 |
| Air transportation | 458 | 406 | -52 | -1.2 | 75.0 |
| Textile mills and textile product mills | 235 | 183 | -52 | -2.4 | 63.9 |
| Telecommunications | 858 | 807 | -51 | -.6 | 78.8 |
| Electric power generation, transmission and distribution | 397 | 351 | -46 | -1.2 | 83.2 |
| General federal defense government compensation | 550 | 505 | -45 | -.9 | .0 |
| Couriers and messengers | 533 | 489 | -44 | -.9 | 57.4 |
| Computer and peripheral equipment manufacturing | 159 | 119 | -40 | -2.9 | 24.9 |
| Plastics product manufacturing | 516 | 477 | -39 | -.8 | 50.4 |
| Navigational, measuring, electromedical, and control instruments manufacturing | 400 | 367 | -33 | -.9 | 5.3 |
| Semiconductor and other electronic component manufacturing | 384 | 353 | -31 | -.8 | 19.9 |
| Aerospace product and parts manufacturing | 497 | 467 | -31 | -.6 | 4.7 |
| Communications equipment manufacturing | 110 | 79 | -31 | -3.3 | 12.3 |
| Printing and related support activities | 462 | 434 | -28 | -.6 | 65.8 |
| Metalworking machinery manufacturing | 177 | 154 | -23 | -1.4 | 11.0 |
| Source: U.S. Bureau of Labor Statistics. | |||||
| Industry description | Thousands of jobs | Change | Compound annual rate of change | Percent of employment related to personal consumption expenditures | |
|---|---|---|---|---|---|
| 2012 | 2022 | 2012–2022 | 2012–2022 | 2012 | |
| Fastest growing | |||||
| Home health care services | 1,198.6 | 1,914.3 | 715.7 | 4.8 | 99.9 |
| Individual and family services | 1,311.4 | 2,022.9 | 711.5 | 4.4 | 99.4 |
| Outpatient, laboratory, and other ambulatory care services | 1,151.4 | 1,673.7 | 522.3 | 3.8 | 98.1 |
| Management, scientific, and technical consulting services | 1,121.1 | 1,577.1 | 456.0 | 3.5 | 60.0 |
| Computer systems design and related services | 1,620.3 | 2,229.0 | 608.7 | 3.2 | 20.3 |
| Cement and concrete product manufacturing | 161.6 | 218.9 | 57.3 | 3.1 | 31.5 |
| Office administrative services | 426.4 | 571.3 | 144.9 | 3.0 | 63.2 |
| Offices of health practitioners | 3,968.0 | 5,193.8 | 1,225.8 | 2.7 | 96.4 |
| Veneer, plywood, and engineered wood product manufacturing | 63.8 | 83.5 | 19.7 | 2.7 | 38.0 |
| Facilities support services | 125.8 | 164.4 | 38.6 | 2.7 | 37.9 |
| Construction | 5,640.9 | 7,263.0 | 1,622.1 | 2.6 | 8.1 |
| Commercial and industrial machinery and equipment rental and leasing | 132.2 | 167.1 | 34.9 | 2.4 | 44.5 |
| Software publishers | 286.0 | 359.1 | 73.1 | 2.3 | 30.5 |
| Other professional, scientific, and technical services | 609.5 | 761.0 | 151.5 | 2.2 | 70.1 |
| Employment services | 3,147.9 | 3,929.6 | 781.7 | 2.2 | 67.7 |
| Junior colleges, colleges, universities, and professional schools | 1,763.2 | 2,196.6 | 433.4 | 2.2 | 98.2 |
| Nursing and residential care facilities | 3,193.5 | 3,954.2 | 760.7 | 2.2 | 93.0 |
| Other educational services | 671.5 | 830.3 | 158.8 | 2.1 | 97.1 |
| Funds, trusts, and other financial vehicles | 86.8 | 107.3 | 20.5 | 2.1 | 98.6 |
| Child day care services | 855.5 | 1,052.0 | 196.5 | 2.1 | 98.7 |
| Securities, commodity contracts, and other financial investments and related activities | 814.4 | 1,001.0 | 186.6 | 2.1 | 76.7 |
| Most rapidly declining | |||||
| Apparel manufacturing | 148.1 | 62.3 | -85.8 | -8.3 | 73.9 |
| Leather and allied product manufacturing | 29.4 | 18.5 | -10.9 | -4.5 | 64.7 |
| Communications equipment manufacturing | 109.5 | 78.6 | -30.9 | -3.3 | 12.3 |
| Postal service | 611.2 | 442.1 | -169.1 | -3.2 | 76.5 |
| Computer and peripheral equipment manufacturing | 158.6 | 118.7 | -39.9 | -2.9 | 24.9 |
| Spring and wire product manufacturing | 41.6 | 31.3 | -10.3 | -2.8 | 29.0 |
| Newspaper, periodical, book, and directory publishers | 451.8 | 346.8 | -105.0 | -2.6 | 76.9 |
| Hardware manufacturing | 25.0 | 19.4 | -5.6 | -2.5 | 32.3 |
| Textile mills and textile product mills | 234.6 | 183.1 | -51.5 | -2.4 | 63.9 |
| Other miscellaneous manufacturing | 268.4 | 211.1 | -57.3 | -2.4 | 54.2 |
| Glass and glass product manufacturing | 80.0 | 64.0 | -16.0 | -2.2 | 50.3 |
| Sugar and confectionery product manufacturing | 66.8 | 53.5 | -13.3 | -2.2 | 88.9 |
| Pulp, paper, and paperboard mills | 108.2 | 86.8 | -21.4 | -2.2 | 59.4 |
| Pesticide, fertilizer, and other agricultural chemical manufacturing | 36.8 | 29.8 | -7.0 | -2.1 | 53.8 |
| Manufacturing and reproducing magnetic and optical media | 21.0 | 17.2 | -3.8 | -2.0 | 44.1 |
| Pipeline transportation | 43.9 | 36.1 | -7.8 | -1.9 | 59.8 |
| Audio and video equipment manufacturing | 19.9 | 16.4 | -3.5 | -1.9 | 41.9 |
| Natural gas distribution | 109.7 | 92.1 | -17.6 | -1.7 | 77.3 |
| Other chemical product and preparation manufacturing | 80.8 | 67.9 | -12.9 | -1.7 | 37.0 |
| Source: U.S. Bureau of Labor Statistics. | |||||
Focusing on consumer-related employment, we see that the Bureau projects employment to decline in goods-producing industries—mostly manufacturing—even though BLS anticipates more consumer demand for U.S.-made goods. By 2022, goods-producing jobs related to PCE are expected to decline by 528,000, or 1.0 percent annually, with continuous productivity gains in accordance with long-run trends (see table 4). PCE-related employment declines in apparel manufacturing, miscellaneous manufacturing, textile mills, plastics product manufacturing, and printing and related support activities are expected to drive the decrease. However, like the decline of manufacturing jobs in the overall economy, the decline of manufacturing jobs tied to domestic PCE is expected to slow in comparison with the past decade. Meanwhile, domestic consumer purchases from these industries are expected to grow 1.8 percent annually between 2012 and 2022 (see table 1).
The services sector is expected to account for virtually all consumer-related employment gains between 2012 and 2022 (see table 4). Domestic PCE for services are projected to grow 2.7 percent annually (see table 1), while PCE-related employment in services is projected to grow 1.2 percent annually to add 9.7 million more jobs by 2022. Six service industries will be responsible for most of the expected consumer-related jobs gains: health care and social assistance (+5.1 million to 21.4 million), professional and business services (+1.5 million to 11.6 million), leisure and hospitality (+1.1 million to 14.0 million), retail trade (+805,400 to 14.9 million), education (+653,500 to 3.9 million), and other services (+570,600 to 6.4 million). In total, consumer-supported jobs in services are projected to reach 89.4 million in 2022 and account for 94.5 percent of all PCE-related jobs.
Health care and social assistance jobs alone are anticipated to account for more than half of the total PCE-related employment gains between 2012 and 2022. This sector is projected to account for 22.6 percent of total consumer-supported jobs by 2022, a notable rise from the 14.7 percent that the sector claimed back in 1993 (see figure 11 and table 4). Because of the aging of baby boomers and rising demand for health care, consumer-related employment in health care and social assistance is expected to increase both the most and the fastest of all sectors through 2022. The rise of health care and social assistance jobs among consumer-supported employment reflects the economy as a whole; this industry is projected to surpass the state and local government sector as the largest U.S. employer. As for spending, domestic consumption of health care and social assistance is projected to experience strong growth, increasing 3.2 percent annually to reach $2.3 trillion (see table 1).
Other highlights of projected PCE-related employment in service sectors include continued long-run employment declines in information services and federal government (mostly Postal Service) jobs tied to PCE and declines in utilities and wholesale trade jobs. Two industries that are projected to add PCE-related jobs are still not expected to completely recover from the latest recession by 2022: transportation and warehousing, and financial activities.
THERE WERE 85.1 MILLION JOBS SUPPORTED BY CONSUMERS IN 2007, or 61.5 percent of all U.S. employment. By 2010, in the aftermath of the recession, consumer-related employment had declined by 3.2 million to levels last seen in 2005. These declines accounted for over a third of total job losses between the 2007 employment peak and the 2010 trough of the Great Recession. In 2010, consumer-related job reductions accounted for the majority of job losses in the economy. Through 2011 and 2012, consumer-related employment grew at rates similar to those of the late 1990s, though growth slowed slightly in 2012. Consumer-related employment recovered in 2012, 5 years after the recession began—this was 2 years longer than the 2001 recession required.
Despite the historic decline in output and jobs, consumers displayed relative resilience during the 2007–2009 recession and recovery. This resilience is consistent with other economic contractions, as PCE and its related employment tend to be less volatile than other GDP components; not surprisingly, the percentage of jobs tied to PCE climbed as investment-related employment fell to historically low levels. In comparison with the overall economy, consumer spending and its related employment declined less severely and recovered sooner. The recovery and relative resilience of PCE was fueled in large part by industries that were not affected negatively by the latest recession: educational services and the health care and social assistance industry.
With changing demographics, the impact of the 2007–2009 recession, and increasing global exchange and growth, some wonder if U.S. consumers will be an “engine” for economic growth in the future. Through 2022, BLS projects that the rise of consumer spending as a percent of nominal U.S. GDP will stabilize, and that consumer spending will grow at the same pace as the overall economy with slower growth than seen in the past. The percentage of employment related to PCE is projected to not deviate much from its historical range as expenditures on traditionally labor-intensive services, like health care and social assistance, continue to rise. By 2022 BLS projects that consumers will be responsible for 70.5 percent of nominal U.S. GDP and 63.2 percent of total U.S. employment as consumers spend $12.4 trillion to support more than 94.7 million jobs. Nearly 95 percent of all PCE-related jobs are projected to be in services, and over half of PCE-related job growth is expected to occur in the health care and social assistance sector. Though PCE and its related employment are projected to grow slower than in the past and at rates similar to the overall economy, consumers are still expected to play a stable and important role in economic output and growth.
Stephanie Hugie Barello, "Consumer spending and U.S. employment from the 2007–2009 recession through 2022," Monthly Labor Review, U.S. Bureau of Labor Statistics, October 2014, https://doi.org/10.21916/mlr.2014.34
1 For example, see Mitra Toossi, “Consumer spending: an engine for U.S. job growth,” Monthly Labor Review, November 2002.
2 Bureau of Economic Analysis (BEA) data from March 2013 does not include the National Income and Product Account (NIPA) comprehensive revision from July 2013. With the revision, consumer spending as a percentage of GDP is now slightly lower. To be consistent with data used for the 2012–2022 employment projections, BEA’s March 2013 data are used for the rest of this paper.
3 World Bank data, March 2013.
4 The terms “consumer-supported” or “consumer-related” employment are preferred to “consumer-generated” employment in this paper, in contrast to past BLS publications. See methodology section for more details.
5 Employment throughout the rest of this article will be nonagricultural wage and salary employment only.
6 The National Bureau of Economic Research (NBER) is the official arbiter of recessions. See www.nber.org/cycles for historical recession dates. See endnote 16 for employment details.
7 See Mariacristina De Nardi, Eric French, and David Benson, “Consumption and the Great Recession,” NBER working paper 17688 (Washington, DC: National Bureau of Economic Research, December 2011) and endnote 2.
8 Federal Reserve Economic Data (FRED) downloaded March 2013 and “The financial crisis at the kitchen table: trends in household debt and credit,” Federal Reserve Bank of New York, Current Issues in Economics and Finance, vol. 13, no. 2, 2013.
9 For example, see speech by Janet L. Yellen as vice chair of the Federal Reserve Board, “A painfully slow recovery for America’s workers: causes, implications, and the Federal Reserve’s response,” February 11, 2013.
10 For example, see Carmen M. Reinhart and Kenneth S. Rogoff, “The aftermath of financial crises,” NBER working paper no. 14656 (Washington, DC: National Bureau of Economic Research, January 2009); Martha L. Olney and Aaron Pacitti, “Goods, services, and the pace of economic recovery,” Berkeley Economic History Lab working paper 2013-04, March 2013; Scott R. Baker, Nicholas Bloom, and Steven J. Davis, “Has economic policy uncertainty hampered the recovery?” Chicago Booth paper no. 12-06, February 7, 2012; and Mary Daly, Bart Hobijn, Aysegul Sahin, and Rob Valletta, “A rising natural rate of unemployment: transitory or permanent?” Federal Reserve Bank of San Francisco working paper 2011-05, September 2011.
11 See statement by Ben Bernanke before the Joint Economic Committee (October 4, 2011).
12 See Williams R. Emmons, “Don't expect consumer spending to be the engine of economic growth it once was,” Federal Reserve Bank of St. Louis, The Regional Economist, January 2012, and Kathleen Madigan, “Sorry, world, U.S. consumers can't save you,” Wall Street Journal, May 13, 2013.
13 For example, see the following: De Nardi, French, and Benson, “Consumption and the Great Recession;” Emmons, “Don’t expect consumer spending;” and Ivaylo D. Petev and Luigi Pistaferri, “Consumption in the Great Recession,” The Russell Sage Foundation and The Stanford Center on Poverty and Inequality, Recession Trends, October 2012.
14 For a review of industry employment in the latest recession for the whole economy, see Christopher J. Goodman and Steven M. Mance, “Employment loss and the 2007-09 recession: an overview,” Monthly Labor Review, April 2011.
15 BLS projections cover a 10-year period. BLS projections are based on structural economic trends as BLS assumes a full-employment economy for the target year of the projections and does not attempt to predict fluctuations in the business cycle. In a full-employment economy, any unemployment is frictional—meaning it is attributable to workers transitioning between jobs.
16 The 8.7-million job decrease between 2007 and 2010 is calculated on an annual basis and does not include federal government-related employment increases. The annual figure was selected because consumer-related employment is only available on an annual basis. This differs from the net 8.8-million job decline on a monthly basis between the monthly employment peak and trough of December 2007 and February 2010, respectively, calculated from the Current Employment Statistics (CES) and the Current Population Survey (CPS). The monthly figure is calculated using total nonfarm payroll employment plus private household employment less logging. Monthly figures are seasonally adjusted except for private household employment, which is only available on a nonseasonally adjusted basis.
17 Medical care paid on behalf of households by third parties, like employers and the government, is included in health care consumer spending. Health insurance paid by third parties is not included in health care consumer spending, but is included in consumer spending on financial activities. The social assistance component of the aggregate health care and social assistance sector includes individual and family services, community and vocational rehabilitation services, and child day care services.
18 Consumer spending includes both public and private tuition and fees. See chapter 5 of Concepts and methods of the U.S. National Income and Product Accounts (Bureau of Economic Analysis, 2014).
19 Calculated using the method described in endnote 16 to estimate monthly employment, April 2014 total nonagricultural wage and salary employment was 139.1 million, approximately equal to December 2007. Calculated using preliminary data retrieved on June 2, 2014.
20 See Chapter 5 of Concepts and methods and Nicole Mayerhauser of the Bureau of Economic Analysis, “Inside look at U.S. consumers,” Washington Journal (CSPAN, December 27, 2013).
21 Eliminating imports from the calculation of PCE does not, however, remove the positive employment impact that imports have on the transportation and trade (retail and wholesale) sectors in the data set.
22 BLS assumes that the employment requirements table for the whole economy holds for individual GDP components.
23 Direct employment is employment in industries that produce final goods or services. Indirect employment is employment in industries that supply inputs to industries which produce the final product. People employed both directly and indirectly will spend a majority of their earned income on consumption, which further supports employment. The latter type of employment, called “induced employment,” is not measured by BLS.
24 See endnote 2.
25 See Mayerhauser, “Inside look at U.S. consumers.” Also see endnote 20.
26 Author’s estimation with methodology used in Mayerhauser, “Inside look at U.S. Consumers.” Use of older BEA data to be consistent with BLS employment projections leads to slightly different 2012 estimates than in Mayerhauser. All data are from March 2013, with the exception of 2012 estimates for in-kind social benefits and employer contributions for health insurance and workers’ compensation, which are from July 2013.
27 In the year 2000, baby boomers—born between 1946 and 1964—were ages 36 to 54 years.
28 See Michael L. Walden, “Where did we indulge? Consumer spending during the asset boom,” Monthly Labor Review, March 2013.
29 See Toossi, “Consumer spending,” and Janet Pfleeger, “U.S. consumers: which jobs are they creating?” Monthly Labor Review, June 1996. Note that both Toossi and Pfleeger also counted agricultural wage and salary employment. In addition, Pfleeger included self-employment plus unpaid family employment in her definition of employment.
30 Recall that employment tied to each GDP component equals direct plus indirect employment. Investment-related employment is associated with private fixed investment, which is spending on fixed assets like structures, equipment, and software (see chapter 6 of Concepts and methods). All trade-related employment is essentially tied to exports, with import-related employment accounting for less than 1 percent of total employment. As such, all trade-related employment in this paper can be assumed to be export-related employment only.
31 Contact author for PCE-related employment data dating back to 1993.
32 Note that investment peaked in 2006, so 2007 levels don’t represent the series’ prerecession peak.
33 De Nardi, French, and Benson, “Consumption and the Great Recession,” and Petev and Pistaferri, “Consumption in the Great Recession.”
34 Willem Van Zandweghe and John Carter Braxton, “Has durable goods spending become less sensitive to interest rates?” Federal Reserve Bank of Kansas City, Economic Review, fourth quarter 2013.
35 See endnote 16.
36 Note that investment, exports, and government-related employment experienced peaks and troughs at different times than PCE—hence why job declines by component for 2007–2010 differ from their respective individual peak-to-trough declines.
37 De Nardi, French, and Benson, “Consumption and the Great Recession.”
38 De Nardi, French, and Benson, “Consumption and the Great Recession.”
39 “National postsecondary enrollment trends: before, during, and after the Great Recession,” National Student Clearinghouse Research Center and Project on Academic Success, Indiana University Signature Report 1, July 2011.
40 Figures differ from table 4 because of rounding.
41 BLS estimates that domestic consumer demand for U.S. manufactured goods increased from $852.8 billion in 1993 to $1.1 trillion in 2012. Contact author for complete historical time series.
42 Contact author for complete 1993–2012 time series for domestic PCE on U.S. manufacturing and the related employment to observe the long-term spending and employment interaction.
43 See Maggie C. Woodward, “The U.S. economy to 2022: settling into a new normal,” Monthly Labor Review, December 2013. Also see endnote 15.
44 See Mitra Toossi, “Labor force projections to 2022: the labor force participation rate continues to fall,” Monthly Labor Review, December 2013.
45 Woodward, “The U.S. economy to 2022.”
46 Woodward, “The U.S. economy to 2022.”
47 Woodward, “The U.S. economy to 2022.” Estimates differ from table 2 because of rounding.
48 See Richard L. Henderson, “Industry employment and output projections to 2022,” Monthly Labor Review, December 2013.
49 In 2012, 68.7 percent of services jobs were consumer-related.
50 See endnote 17. In 2012, 96.3 percent of all jobs in the health care and social assistance sector were consumer-related.