An official website of the United States government
An official website of the United States government
The .gov means it's official.
Federal government websites often end in .gov or .mil. Before sharing sensitive information,
make sure you're on a federal government site.
The site is secure.
The
https:// ensures that you are connecting to the official website and that any
information you provide is encrypted and transmitted securely.
Since the late 1970s, the Producer Price Index (PPI) has employed the Stage of Processing (SOP) system as its primary form of data analysis. The SOP system is composed of price indexes for goods and organizes these data by type of buyer and level of fabrication. Goods destined for households or capital investment fall under the finished goods SOP, while processed and unprocessed goods for business demand (excluding capital investment goods) fall under the categories for intermediate materials, supplies, and components or crude materials for further processing. Domestic production for government purchases and domestic production for export and are excluded from the SOP system.1
Over time, the PPI has expanded to include coverage of the majority of the services sectors of the United States economy and a portion of the construction sector. PPI coverage now includes indexes for trade services, distribution and warehousing services, and other service areas, such as professional services, insurance and annuities, banking, and health care, as well as indexes for selected nonresidential construction and maintenance and repair. PPI currently covers approximately 72 percent of services and 34 percent of construction as measured by 2007 Census revenue.2 As a result of this expansion, the PPI plans to enhance its primary aggregation system for data analysis. The restructured system, named the Final Demand–Intermediate Demand (FD–ID) system, was introduced on an experimental basis with the PPI release of data for January 2011. At that time, the majority of indexes from the FD–ID system were published with historical data beginning in November 2009. The new system combines data on services sold to households, exports of goods and services, nonresidential construction, and government purchases of goods and services with data on finished goods to provide coverage of final-demand inflation. The PPI program also has developed two treatments tracking price movements for intermediate-demand goods and services. One treatment replicates the current SOP system by tracking changes in selling prices for processed and unprocessed goods to intermediate demand, but adds categories for services and construction to intermediate demand. A second treatment breaks down intermediate demand using a production flow approach, separating intermediate demand into four stages.3 The shift from the SOP system to the FD–ID system with the release of data for January 2014 in February 2014 will greatly expand PPI coverage as a percentage of the U.S. economy. Currently, using relative importance figures, the final-demand index represents a fourfold increase in coverage compared with the finished goods index, while the expanded treatment of intermediate demand provides for roughly a doubling in coverage of the U.S. economy.4
This article presents and analyzes limited historical data from the new aggregation system. (An earlier article provided a detailed explanation of the methodology used to develop the new aggregation system, as well as a more detailed description of its structure.5) Data for this analysis are not seasonally adjusted. As a background to analysis of the new aggregate indexes, the article includes a section that presents economic and commodity price trends from November 2009 through June 2012, the period for which the new aggregate data are analyzed. The paper also includes sections that analyze historical data for the final-demand, intermediate-demand-by-commodity-type, and intermediate-demand-by-production-flow portions of the new system. This is followed by concluding remarks.
After a steep decline in 2008 and the first half of 2009, gross domestic product (GDP) growth in the United States resumed in the third quarter of 2009. For the next six quarters, through the close of 2010, U.S. GDP grew at a moderate rate.6 During this period, a similar turnaround was occurring in many other parts of the world.7 Beginning in 2011 and continuing into 2012, GDP growth slowed considerably in the United States: U.S. GDP growth slowed to 1.8 percent in 2011 and estimates for the first half of 2012 show expansion at less than 2.0 percent.8 Furthermore, economic expansion slowed in many other parts of the world. In 2011, Japan and parts of the European Union entered a recession, and growth slowed in Canada, the United Kingdom, and many parts of Asia and Latin America.
Economic expansion that began in the second half of 2009 and continued through 2010 helped drive up prices for unprocessed goods such as crude petroleum, iron and steel scrap, nonferrous scrap and ores, and wastepaper. (From November 2009 to May 2011, the PPI for crude petroleum jumped 35.7 percent, while prices for core crude goods climbed 45.4 percent.9) Crude petroleum prices also likely increased in response to uncertainty due to political unrest in Libya, Egypt, and Tunisia. The surge in crude petroleum prices contributed to advances in prices for products made from petroleum, including gasoline, diesel fuel, jet fuel, heating oil, and liquefied petroleum gas, and nonenergy goods such as basic organic chemicals, thermoplastic resins, and plastic products.
The worldwide economic slowdown that began in 2011 contributed to a reversal in U.S. producer prices for many goods from May 2011 to June 2012. Falling prices for highly volatile energy goods led the decline. Gasoline prices dropped 13.2 percent; liquefied petroleum gas, 40.0 percent; diesel fuel, 9.3 percent; and jet fuel, 14.5 percent. In addition, a large increase in natural gas production resulted in a substantial decline in prices for both wellhead natural gas and utility natural gas. Prices for organic chemicals, carbon steel scrap, integrated microcircuits, and computers also fell over this period.
As was the case with most goods, unprocessed foods such as corn, wheat, and soybeans experienced significant price increases from November 2009 through May 2011—climbing 92.7, 73.4, and 45.8 percent, respectively. However, unlike prices for many other goods, prices for unprocessed foods continued to rise after May 2011. After peaking in 2009, both corn production and yield steadily declined.10 For wheat, despite somewhat more consistent production, yearend stocks fell in both the 2010–2011 and the 2011–2012 growing seasons, in response to increased export demand.11 Corn, wheat, and soybeans were affected by poor growing seasons within and outside the United States, and corn prices also were influenced by growing demand for ethanol.12 In response, the index for prepared animal feeds jumped 23.8 percent from November 2009 through June 2012, and prices for meats, poultry, and dairy products also climbed. These advances drove the steep run-up in foods prices from November 2009 through May 2011, as well as the more modest increases observed from May 2011 through June 2012.
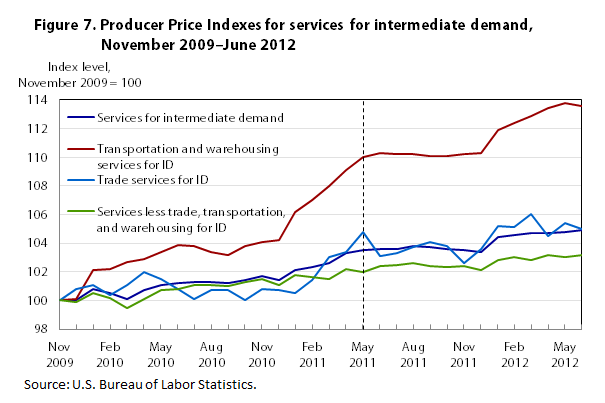
Increases in refined petroleum product prices led to higher prices for many transportation services as transportation companies attempted to mitigate the impact of the rising cost of fuel by including fuel surcharges in the prices for their services.13 From November 2009 to June 2012, prices for airline passenger services climbed 19.7 percent, while the index for air transportation of freight jumped 24.9 percent. Prices for both long-distance and local motor carrying, as well as the index for rail transportation of freight and mail, also moved up at relatively steep rates.
Prices for trade services generally rose from November 2009 through June 2012. In the PPI, trade indexes measure changes in margins received by wholesalers and retailers.14 From late 2009 though early 2011, inflation for final-demand goods was 11.1 percent, but from mid-2011 to mid-2012, prices for final-demand goods were essentially flat. The PPI for final-demand trade services, which track changes in margins for goods sold to final demand, rose 4.5 percent from late 2009 through early 2011. This rate slowed to 3.2 percent in the latter period.
Unlike the indexes for trade services and transportation and warehousing services, the overall price movement for final-demand services other than trade and transportation was muted for the 31-month period, inching up 3.6 percent. From November 2009 to June 2012, over half of the rise can be traced to medical care inflation. However, prices for other nontrade and transportation services, such as banking deposit services and residential property sales and rental (brokerage fees and commissions), fell from November 2009 to June 2012 and partly offset the rise in medical services prices.
The final-demand portion of the new PPI aggregation FD–ID system measures price changes for goods, services, and construction products sold as personal consumption, capital investment, government purchase, and export. The final-demand portion of the system includes an overall index measuring price change for all goods, services, and construction products sold to final demand (the PPI for final demand), as well as indexes for final-demand goods, final-demand services, and final-demand construction. Indexes tracking price changes for detailed types of commodities sold to final demand are also published. These categories include foods, energy, goods less food and energy, trade services, transportation and warehousing services, and services less trade, transportation, and warehousing.
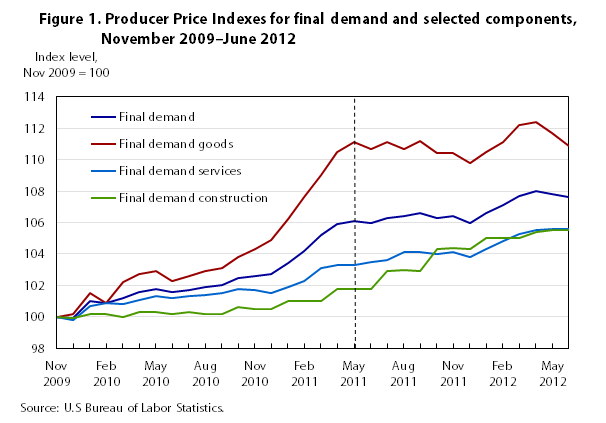
The PPI for final demand increased 7.6 percent from November 2009 to June 2012, with prices for final-demand goods advancing 10.9 percent and the index for final-demand services moving up 5.6 percent. On a weighted basis, goods and services each accounted for about half of the overall rise in the final-demand index. Prices for final-demand construction climbed 5.5 percent from November 2009 to June 2012.15 (See table 1 and figure 1.) Final-demand price movements over this 31-month period can be divided into two main intervals, November 2009 to May 2011 and May 2011 to June 2012, with prices (excluding construction) rising at a substantially higher rate in the first interval compared with the second. In the first interval, the final-demand index climbed 6.1 percent, mainly because of an 11.1-percent jump in prices for final-demand goods. In the second interval, the final-demand index edged up 1.4 percent, mostly because of a 2.2-percent advance in prices for final-demand services. The index for final-demand goods inched down from May 2011 to June 2012.
| Category | Nov 2009–May 2011 | Nov 2009–May 2011 (annualized) | May 2011–June 2012 | May 2011–June 2012 (annualized) | Nov 2009–June 2012 | Nov 2009–June 2012 (annualized) |
|---|---|---|---|---|---|---|
| Final demand | 6.1 | 4.1 | 1.4 | 1.3 | 7.6 | 2.9 |
Final demand goods | 11.1 | 7.4 | -0.2 | -0.2 | 10.9 | 4.2 |
Food | 11.3 | 7.5 | 3.1 | 2.9 | 14.8 | 5.7 |
Energy | 34.9 | 23.3 | -8.6 | -7.9 | 23.3 | 9.0 |
Excluding food and energy | 4.7 | 3.1 | 1.9 | 1.8 | 6.6 | 2.6 |
Final demand services | 3.3 | 2.2 | 2.2 | 2.0 | 5.6 | 2.2 |
Trade | 4.5 | 3.0 | 3.2 | 3.0 | 7.8 | 3.0 |
Transportation | 10.8 | 7.2 | 3.5 | 3.2 | 14.7 | 5.7 |
Other services | 2.0 | 1.3 | 1.6 | 1.5 | 3.6 | 1.4 |
Final demand construction | 1.8 | 1.2 | 3.7 | 3.4 | 5.5 | 2.1 |
| Source: U.S. Bureau of Labor Statistics. | ||||||
From November 2009 to May 2011, the 11.1-percent rise in the index for final-demand goods was led by steep increases in prices for energy goods, which surged 34.9 percent and accounted for about 60 percent of the gain. The indexes for final-demand foods and final-demand goods other than food and energy increased 11.3 and 4.7 percent, respectively. In contrast, from May 2011 to June 2012, the index for final-demand goods was essentially unchanged, as an 8.6-percent drop in prices for energy goods offset a 3.1-percent rise in prices for final-demand foods and a 1.9-percent advance in prices for final-demand goods other than foods and energy. (See table 1 and figure 2.)
A 64.9-percent surge in gasoline prices led the rise in the index for final-demand goods from November 2009 to May 2011. Most other energy goods also exhibited large price increases during this period, including diesel fuel, home heating oil, jet fuel, liquefied petroleum gas, and residential electric power. Within final-demand foods, higher prices for corn, beef and veal, pork, and oilseeds were factors in the rise of the index for final-demand goods. Among goods other than foods and energy, advances in prices for basic organic chemicals, carbon steel scrap, inedible fats and oils, thermoplastic resins, pharmaceuticals, civilian aircraft, and cigarettes contributed to the rise in the final-demand goods index.
In a reversal from May 2011 to June 2012, prices for gasoline, liquefied petroleum gas, residential natural gas, home heating oil, and jet fuel all posted relatively large decreases and drove the decline in the final-demand energy goods index. To a lesser degree, lower prices for selected food and core final-demand goods also factored in this decline; these included carbon steel scrap, basic organic chemicals, computers and integrated microcircuits, corn, pork, and dairy products. In contrast, prices for motor vehicles, civilian aircraft, pharmaceutical preparations, cigarettes, beef, and chicken continued to move higher from May 2011 to June 2012.
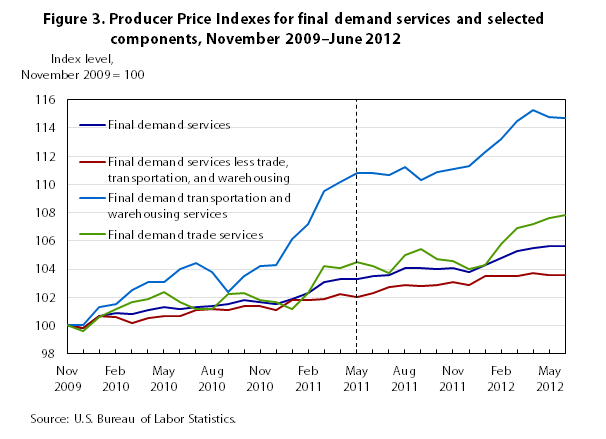
In contrast to final-demand goods, the increase in prices for final-demand services was relatively linear from November 2009 to June 2012, averaging about 0.18 percent per month. The index advanced 3.3 percent from November 2009 to May 2011 (18 months) and continued to rise another 2.2 percent from May 2011 to June 2012 (13 months). Within the index for final-demand services, which increased 5.6 percent from November 2009 to June 2012, prices for trade services advanced 7.8 percent and prices for services other than trade, transportation, and warehousing moved up 3.6 percent. These increases each accounted for about 40 percent of the rise in prices for final-demand services. Despite a 14.7-percent jump in prices for final-demand transportation and warehousing services, only about 20 percent of the overall rise in the index for final-demand services can be traced to that advance.16 (See table 1 and figure 3.)
Trade services. From November 2009 to June 2012, a 16.0-percent jump in margins—the difference between producer selling prices and producer costs of acquiring goods—for food and alcohol retailing led to the 7.8-percent rise in the index for final-demand trade services. Higher margins received for health and beauty care retailing (including optical goods retailing), automobile retailing, apparel retailing, and machinery and equipment wholesaling also contributed to the rise in the final-demand trade services index.
Transportation and warehousing services. From November 2009 to June 2012, the index for final-demand transportation and warehousing services advanced 14.7 percent. During this period, prices for airline passenger services climbed 19.7 percent, while the index for air transportation of freight jumped 24.9 percent. Prices for truck transportation of freight, as well as the index for rail transportation of freight and mail, also moved up at steep rates.
Services other than trade, transportation, and warehousing. Unlike the indexes for trade services and transportation and warehousing services, the overall price movement for final-demand services other than trade, transportation, and warehousing was relatively muted for the 31-month period in question, inching up 3.6 percent. For the November 2009 to June 2012 period, over half of the rise can be traced to medical care inflation. Prices for hospital inpatient care increased 6.5 percent, the index for hospital outpatient care moved up 7.0 percent, prices for nursing home care rose 5.1 percent, and the index for physician care advanced 5.0 percent. However, prices for banking deposit services, residential property sales and rental brokerage fees, cellular and other wireless communication services, and passenger car rentals fell from November 2009 to June 2012.
As stated previously, the PPI’s migration from the SOP system to the FD–ID system represents a significant expansion in coverage. The finished goods index—the main publication number for the PPI since 1978—makes up only about 24 percent of overall final-demand and roughly 69 percent of final-demand goods. The indexes for government-purchased goods and goods for export constitute the remainder of the goods weight within the final-demand goods index.17 In comparing price movements for final demand with price movements for finished goods, the finished goods index increased substantially more than the final-demand index from November 2009 through June 2012 (See figure 4.) Prices for services and construction increased at a slower rate than goods prices over this period, causing the final-demand index to rise less than the finished goods index.
The new system also differs from the SOP system in its inclusion of the weight for goods sold to government and as exports. Figure 4 shows that the index for final-demand goods increased somewhat more than prices for finished goods from November 2009 through June 2012. This difference can be traced to index movements for commodities excluded from finished goods but included in final-demand goods as exports and government purchases, and to commodities with augmented weight within final-demand goods as compared with the finished goods index; the difference is due to substantial purchases by government and as export. The index for government-purchased goods includes substantial weight for the following commodities: gasoline, diesel fuel, jet fuel, beef and veal, bulk fluid milk and cream, and basic organic chemicals. The index for goods for export includes significant weight for jet fuel, diesel fuel, lubricating oil base stocks, corn, oilseeds, basic organic chemicals, thermoplastic resins, and carbon steel scrap. All of these commodities experienced price volatility over the period covered by this analysis.
The expanded system for intermediate demand by commodity type measures price changes for goods, services, and construction commodities sold to businesses as inputs to production. In this system, commodities are assigned to categories based on commodity type, and price indexes are constructed for each type of commodity within intermediate demand. The categories include processed goods (formerly titled intermediate materials, supplies, and components); unprocessed goods (formerly titled crude materials for further processing); trade services; transportation and warehousing services; services excluding trade, transportation, and warehousing; and construction. (See table 2.) An overall intermediate-demand index is not calculated because it would be subject to high levels of multiple counting. Multiple counting occurs within a price index when the index includes prices both for outputs and for the inputs used to make those outputs. For example, an index including prices for gasoline and crude petroleum used to manufacture gasoline would suffer from multiple counting. Multiple counting can lead to exaggerated or distorted measures of price change.
| Category | Nov 2009–May 2011 | Nov 2009–May 2011 (annualized) | May 2011–June 2012 | May 2011–June 2012 (annualized) | Nov 2009–June 2012 | Nov 2009–June 2012 (annualized) |
|---|---|---|---|---|---|---|
| Processed goods | 15.4 | 10.3 | -1.2 | -1.1 | 14.0 | 5.4 |
Food | 16.4 | 10.9 | 3.1 | 2.9 | 20.0 | 7.7 |
Energy | 30.9 | 20.6 | -5.4 | -5.0 | 23.8 | 9.2 |
Excluding food and energy | 10.9 | 7.3 | -0.3 | -0.3 | 10.6 | 4.1 |
| Category | Nov 2009–Sept 2011 | Nov 2009–Sept 2011 (annualized) | Sept 2011–June 2012 | Sept 2011–June 2012 (annualized) | Nov 2009–June 2012 | Nov 2009–June 2012 (annualized) |
| Unprocessed goods | 30.8 | 16.8 | -9.4 | -12.3 | 18.5 | 7.2 |
Food | 43.6 | 23.8 | -1.9 | -2.5 | 40.8 | 15.8 |
Energy | 11.6 | 6.3 | -16.3 | -21.1 | -6.6 | -2.6 |
Excluding food and energy | 48.2 | 26.3 | -10.0 | -13.1 | 33.4 | 12.9 |
| Category | Nov 2009–May 2011 | Nov 2009–May 2011 (annualized) | May 2011–June 2012 | May 2011–June 2012 (annualized) | Nov 2009–June 2012 | Nov 2009–June 2012 (annualized) |
| Services | 3.5 | 2.3 | 1.4 | 1.3 | 4.9 | 1.9 |
Trade | 4.8 | 3.2 | 0.2 | 0.2 | 5.0 | 1.9 |
Transportation | 10.0 | 6.7 | 3.3 | 3.0 | 13.6 | 5.3 |
Other services | 2.0 | 1.3 | 1.3 | 1.2 | 3.2 | 1.2 |
| Source: U.S. Bureau of Labor Statistics. | ||||||
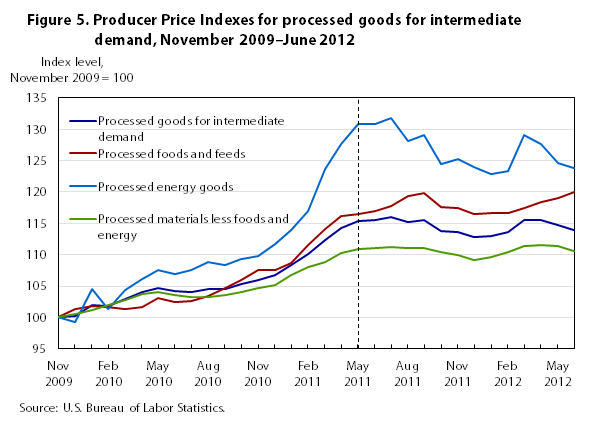
The PPI for processed goods for intermediate demand climbed 14.0 percent from November 2009 to June 2012. Over half of this increase can be traced to a 10.6-percent advance in prices for processed goods other than foods and energy. During the same period, the indexes for processed energy goods and processed foods and feeds for intermediate demand also rose, 23.8 percent and 20.0 percent, respectively. (See table 2 and figure 5.)
For the analysis of processed goods for intermediate demand, price movements can be divided into two main time intervals, November 2009 to May 2011 and May 2011 to June 2012. In the first interval, processed goods for intermediate demand jumped 15.4 percent; this was due to a 10.9-percent increase in prices for processed goods other than foods and energy and a 30.9-percent increase in prices for processed energy goods. In contrast, in the second interval, the index for processed goods for intermediate demand declined 1.2 percent, mostly because of a 5.4-percent drop in prices for processed energy goods.
From November 2009 to May 2011, a 64.9-percent jump in gasoline prices was a major factor in the rise of the index for processed goods for intermediate demand. Most other energy goods, including diesel fuel, jet fuel, and finished lubricants, also posted large increases during this period. Among goods other than foods and energy, higher prices for basic organic chemicals (+42.6 percent), thermoplastic resins (+26.8 percent), and steel mill products (+30.1 percent) also were central to the rise in the processed goods index. Within processed foods and feeds for intermediate demand, prices for prepared animal feeds advanced 20.1 percent, and meat prices climbed 29.5 percent from November 2009 to May 2011.
By contrast, from May 2011 to June 2012 the index for processed goods for intermediate demand declined 1.2 percent, as previously noted. Principal to this reversal were a 10.4-percent retreat in prices for basic organic chemicals and a 13.2-percent drop in the gasoline index. Also contributing to the overall decrease were energy goods such as diesel fuel, jet fuel, and liquefied petroleum gas and core processed goods such as heat transfer equipment; iron and steel pipe, tube, and fittings; and softwood logs, bolts and timber.
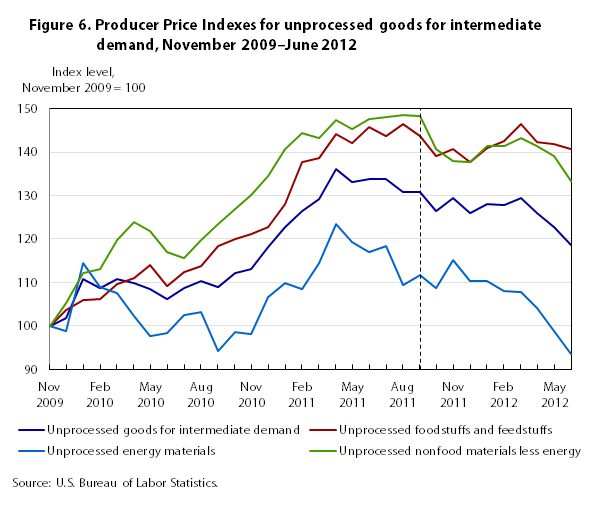
From November 2009 to June 2012, the PPI for unprocessed goods for intermediate demand advanced 18.5 percent. About three-fourths of this rise can be attributed to a 40.8-percent surge in prices for unprocessed foodstuffs and feedstuffs. In addition, the index for unprocessed nonfood materials less energy climbed 33.4 percent. Conversely, prices for unprocessed energy goods declined 6.6 percent from November 2009 to June 2012. (See table 2 and figure 6.)
As was the case with analyzing processed goods for intermediate demand, price movements of unprocessed goods for intermediate demand can also be divided into two main intervals, in this instance November 2009 to September 2011 and September 2011 to June 2012. In the first interval, the index for unprocessed goods for intermediate demand advanced 30.8 percent. Higher prices for foodstuffs and feedstuffs (+43.6 percent) accounted for about half of this increase, and rising prices for core unprocessed goods (+48.2 percent) were responsible for roughly one-third of the advance. In the second interval, roughly two-thirds of the 9.4-percent decline in the index for unprocessed goods for intermediate demand can be linked to a 16.3-percent drop in prices for unprocessed energy goods.
From November 2009 to September 2011, corn prices surged 98.5 percent, leading the 30.8-percent advance in the index of unprocessed goods for intermediate demand. Higher prices for other unprocessed foodstuffs and feedstuffs, such as slaughter livestock, oilseeds, and raw milk, also contributed to the rise in the overall unprocessed goods index. Crude petroleum prices climbed 25.8 percent from November 2009 to September 2011. Within the category for unprocessed nonfood materials less energy, increasing prices for iron and steel scrap (+58.5 percent), nonferrous metal ores (+53.6 percent), and nonferrous scrap (+24.0 percent) also were major factors in the rise of the index for unprocessed goods for intermediate demand.
Conversely, from September 2011 to June 2012, over half of the 9.4-percent decline in the index of unprocessed goods for intermediate demand was due to a 39.1-percent drop in natural gas prices. In addition, the crude petroleum index fell 9.6 percent, and prices for basic industrial materials such as iron and steel scrap (-9.3 percent), nonferrous metal ores (-10.0 percent), and corrugated wastepaper (-25.7 percent) also played roles in the decrease in the index of unprocessed goods for intermediate demand during the second interval. Within unprocessed foodstuffs and feedstuffs, lower prices for raw milk (-23.7 percent), corn (-13.6 percent), and wheat (-10.6 percent) slightly outweighed higher prices for slaughter livestock (+6.2 percent), slaughter chickens (+19.5 percent), and oilseeds (+8.0 percent).
The index of services for intermediate demand rose 4.9 percent from November 2009 to June 2012. (See table 2 and figure 7.)
Services other than trade, transportation, and warehousing services for intermediate demand. Over 40 percent of the advance in services for intermediate demand can be traced to prices for services other than trade, transportation, and warehousing services; the index for this “other services” category moved up 3.2 percent. Leading this advance, the index for business loans jumped 58.7 percent.18 Higher prices for legal services, portfolio management, investment banking services, and television advertising time sales also contributed to the overall rise. In contrast, falling prices for bank deposit services partly offset the increase in the index for services other than trade, transportation, and warehousing for intermediate demand.
Transportation and warehousing services for intermediate demand. The index for transportation and warehousing services for intermediate demand increased 13.6 percent from November 2009 to June 2012, accounting for over one-third of the overall services advance. During this period, prices for postal, courier, messenger, and airmail services climbed 16.9 percent. In addition, higher prices for long-distance motor carrying, railroad transportation of freight and mail, and airline passenger services also contributed to the rise in the index of transportation services for intermediate demand.
Trade services for intermediate demand. Prices of trade services for intermediate demand moved up 5.0 percent from November 2009 to June 2012 and were responsible for about one-sixth of the rise in services prices. An 8.2-percent rise in margins for machinery and equipment parts and supplies wholesaling led the advance in the index of trade services for intermediate demand. Higher margins for hardware and building materials and supplies retailing, fuel oil retailing, and alcoholic beverages retailing also contributed to the increase in the index of trade services for intermediate demand.
The production flow treatment of intermediate demand organizes commodities consumed by businesses as inputs to production into four stages and measures price changes for these inputs at each stage of intermediate demand. The goal of the production flow treatment is to assign commodities to sequential stages so that commodities in one intermediate stage are used as inputs to produce commodities consumed by the next stage, emphasizing forward flow through the economy.
The PPI program developed stage-based indexes by first assigning all industries in the economy (even those which PPI does not currently cover) to one of four stages of production. Industries assigned to the fourth stage of production produce commodities that are primarily consumed for final demand. Industries in the third stage of production produce commodities mainly consumed by industries in the fourth stage. Industries assigned to the second stage of production produce commodities primarily consumed by industries in the third stage. Industries included in the first stage of production produce commodities mainly consumed by industries in the second stage. The stage-based indexes do not track prices for outputs produced by industries in each of the stages but instead track prices for inputs consumed by industries in each of the stages. For example, the fourth-stage intermediate-demand index tracks prices for inputs consumed by industries assigned to the fourth stage—that is, fourth-stage industries that primarily produce commodities sold to final demand.
A more detailed description of the four intermediate-demand stages is provided below and is followed by an analysis of historical data from the production flow treatment. The production flow treatment was developed to aid in price transmission analysis; therefore, the data analysis focuses on price transmission within the stage-based system. Unfortunately, data from the PPI production flow treatment only date back to November 2009, thereby leaving an insufficient sample for rigorous econometric price-transmission modeling. The price transmission analysis in this section is therefore based on nonrigorous examination of historical price trends over the sample period. Still, this analysis provides a sense of how the results for these new indexes can be viewed until enough data are available to make economic modeling possible.
The paragraphs below describe each of the four stages of intermediate demand.
Stage 4 intermediate demand. The stage 4 intermediate-demand index tracks net input prices for products consumed by industries classified as stage 4 producers.19 Industries are classified as stage 4 producers if at least 75 percent of their production is sold to final demand. Examples of heavily weighted goods-producing industries included in stage 4 are light truck and utility vehicle manufacturing, automobile manufacturing, pharmaceutical preparation manufacturing, and aircraft manufacturing. Heavily weighted service industries included in stage 4 include retail trade; food service and drinking places; offices of physicians, dentists, and other health practitioners; and hospitals. Stage 4 also includes all industries engaged in new-building construction (as opposed to maintenance and repair construction).
Examples of goods consumed by stage 4 industries include motor vehicle parts, commercial electric power, jet fuels, ready-mix concrete, plastic construction products, fabricated structural metal, biological products, and beef and veal. Services consumed by stage 4 industries include parts and supplies for machinery wholesaling; securities brokerage, dealing, and investment advice; engineering services; machinery and equipment wholesaling; business loans; long-distance motor carrying; and legal services.
Stage 3 intermediate demand. The stage 3 intermediate-demand index tracks net input prices for products consumed by industries classified as stage 3 producers. Industries are classified as stage 3 producers if at least 65 percent of their output is sold to stage 4 and final demand but less than 75 percent of their output is sold to final demand. Examples of highly weighted goods-producing industries included in stage 3 are motor vehicle parts manufacturing; animal (except poultry) slaughtering, rendering, and processing; semiconductor manufacturing; and poultry processing. Services industries classified in stage 3 include wholesale trade; telecommunications; insurance carriers; securities, commodity contracts, investments, and related activities; truck transportation; architecture, engineering, and related services; and hotels and motels.
Examples of goods consumed by stage 3 industries include raw milk; slaughter steers and heifers; gasoline; diesel fuel; thermoplastic resins and materials; industrial electric power; paper boxes and containers; and hot rolled steel bars, plates, and structural shapes. Services commonly consumed by stage 3 industries include commissions from sales of property and casualty insurance, business loans, legal services, temporary help services, courier and messenger services, co-employment staffing services, and administrative and general management consulting services.
Stage 2 intermediate demand. The stage 2 intermediate-demand index tracks net input prices for products consumed by industries classified as stage 2 producers. Industries are classified as stage 2 producers if they sell at least 65 percent of their output to stage 3, stage 4, and final demand but less than 65 percent of their output to stage 4 and final demand and less than 75 percent of their output to final demand. Among the goods-based industries assigned to stage 2 are petroleum refineries; electric power generation, transmission, and distribution; printing; natural gas distribution; cattle ranching and farming; poultry and egg production; and plastic materials and resin manufacturing. Services industries that are heavily weighted in stage 2 include management of companies and enterprises; nondepository credit intermediation and related activities; insurance agencies, brokerages, and related activities; and services to buildings and dwellings.
Goods commonly purchased by stage 2 industries include crude petroleum; natural gas; formula feeds; paperboard; primary basic organic chemicals; carbon steel scrap; corn; writing and printing papers; and logs, bolts, timber, pulpwood, and woodchips. Services that are heavily weighted in the intermediate-demand stage 2 index are legal services; business loans; metals, minerals, and ores wholesaling; chemicals and allied products wholesaling; and cellular phone and other wireless telecommunication.
Stage 1 intermediate demand. The stage 1 intermediate-demand index tracks net input prices for products consumed by industries classified as stage 1 producers. Industries not classified in stages 2, 3, or 4 are categorized as stage 1 producers. Goods-producing industries in stage 1 include oil and gas extraction, paper mills, grain farming, and logging. Among the highly weighted services industries included in stage 1 are real estate; legal services; employment services; management, scientific, and technical consulting services; accounting, tax preparation, bookkeeping, and payroll services; and advertising services.
Examples of goods consumed by stage 1 industries are commercial electric power, industrial electric power, primary basic organic chemicals, carbon steel scrap, and gasoline. Services commonly consumed by stage 1 industries include securities brokerage, dealing, and investment advice; portfolio management; engineering services; solid waste collection; chemicals and allied products wholesaling; and guestroom or unit rental. It should be noted that all inputs purchased by stage 1 industries are by definition produced either within stage 1 or by latter stages of processing, leaving stage 1 less useful for price transmission analysis.
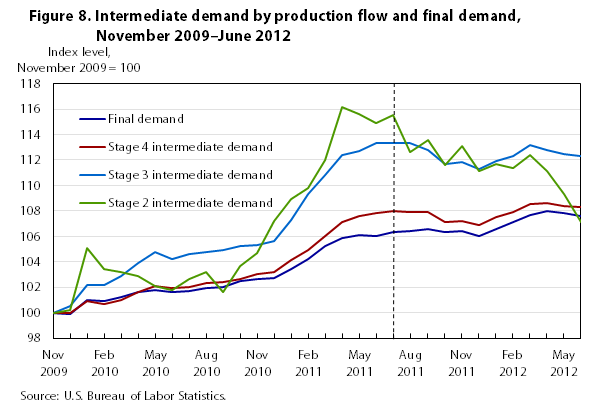
Figure 8 presents the indexes for stages 2 through 4 of intermediate demand by production flow, as well as the index for final demand, for November 2009 to June 2012. Stage 1 is omitted because it is less useful than the remainder of the system for price transmission analysis. The data analysis is broken into two periods, November 2009 through July 2011 and July 2011 through June 2012. These two periods are examined separately because of the differing price trends in the periods. From November 2009 through July 2011, prices at all stages rose substantially, whereas from July 2011 through June 2012 prices at each stage fell or rose only slightly.
November 2009 to July 2011. Prices at all stages of intermediate demand and for final demand increased from November 2009 to July 2011. The stages 2 and 3 intermediate-demand indexes increased 15.5 and 13.3 percent, respectively, while prices for stage 4 intermediate demand and final demand advanced 8.0 and 6.3 percent.
The stage 2 intermediate-demand index increased from November 2009 to July 2011 mainly as a result of rising prices for a number of unprocessed goods. (Unprocessed goods constitute more than half of the stage 2 intermediate-demand index.) Crude petroleum, corn, and scrap metal were among the unprocessed goods whose prices advanced from November 2009 to July 2011.
Price trends at stages 3 and 4 of intermediate demand and within final demand suggest that price passthrough occurred from unprocessed goods in stage 2 to later stages within the system. For example, higher corn prices (at stage 2) increased cattle feed costs, which led to higher prices for slaughter cattle at stage 3. In turn, rising prices for slaughter cattle passed through to the index for beef and veal, which contributed to the increase in final-demand prices.
Similarly, rising crude petroleum prices, included in stage 2, appear to have been transmitted forward to later stages within the production flow system. From November 2009 to July 2011, prices for refined petroleum products surged. Higher gasoline and diesel fuel prices were major factors in the increases in the indexes for stages 3 and 4 of intermediate demand and in the final-demand index. Climbing prices for jet fuel also contributed to the advance in the stage 3 intermediate-demand index, while higher prices for home heating oil added to the rise in the final-demand index.
In addition to passthrough from crude petroleum to refined petroleum products, crude petroleum price increases influenced prices for other goods and services at subsequent stages. Crude petroleum is an important input to the production of organic chemicals that, in turn, are used to produce thermoplastic resins and plastic products. Prices for basic organic chemicals, thermoplastic resins, and plastic products all rose from November 2009 to July 2011 and contributed to advances in the indexes for intermediate-demand stages 3 and 4. Rising crude petroleum prices also caused the index for transportation services to climb, as transportation service providers increased prices in response to higher fuel costs. Rising prices for courier and messenger services (except air) and airmail and package delivery services (except the U.S. Postal Service) contributed to the stage 3 increase. The increase in prices for long-distance motor carrying helped push the stage 4 intermediate-demand index and the index for final demand higher. Climbing prices for airline passenger services also contributed to the advance in the final-demand index.
At stage 2 of intermediate demand, iron and steel scrap prices rose from November 2009 to July 2011. At stage 3, the index for steel mill products increased, and within stage 4, prices for motor vehicle parts advanced. Prices for scrap and processed metal products likely are linked; however, determining the causal direction is not a straightforward process. Scrap prices rose because of the recovering economy, better export demand, and improvement in the automobile market; hence, scrap prices may have risen as a result of demand from later stages of production. Analysis of the scrap and processed metal products markets suggests that within the stage-based aggregation system, price transmission not only may be forward flowing and based on supply shocks but also could be the result of demand shocks and be backward moving through the production flow system.
Finally, it should be noted that at the later stages of the production flow system, higher prices for nontransportation services made a major contribution to aggregate index movements, as opposed to at the earlier stages, during which services other than transportation were less important. At stage 4, rising prices for business loans, portfolio management, and securities brokerage, dealing, and investment advice were major factors in the increase of the overall index. Higher prices for food and alcohol retailing, inpatient care, and outpatient care contributed to the advance in the final-demand index. It is unlikely that increases in prices for these nontransportation services were due to earlier-stage material and service inflation passthrough. Instead, factors such as changes in interest rates, trade margins, and Medicare payments more likely provide better explanations of these advances.
July 2011 to June 2012. From July 2011 to June 2012, the indexes for stages 2 and 3 intermediate demand declined 7.2 and 0.9 percent, respectively. By contrast, the index for stage 4 intermediate demand increased 0.3 percent and prices for final demand rose 1.2 percent.
Lower prices for unprocessed goods led the drop in the stage 2 intermediate-demand index from July 2011 to June 2012, with falling prices for natural gas and crude petroleum being the most important contributors to this decline. These decreases appear to have transmitted forward to processed energy products at later stages in the system. The index for utility natural gas moved down in response to lower wellhead natural gas prices. Falling prices for commercial natural gas and natural gas to electric utilities contributed to the decline in the stage 3 intermediate-demand index, while lower prices for commercial natural gas and residential natural gas tempered the increases in the stage 4 index and the index for final demand. Refined petroleum products prices also moved down from July 2011 to June 2012, because of lower crude petroleum input costs. Price declines for diesel fuel and gasoline contributed to the retreat in the stage 3 index; falling prices for gasoline, jet fuel, and diesel fuel lessened the gain in the stage 4 intermediate-demand index; and lower prices for gasoline and liquefied petroleum gas tempered the advance in final-demand prices.
In contrast to prices for energy goods, prices for many food products continued to rise from July 2011 to June 2012. At stage 2 of intermediate demand, prices for formula feeds increased, and these higher feed costs were transmitted to more-highly-processed foods at later stages in the system. At stage 3 of intermediate demand, rising prices for slaughter cattle and slaughter chickens partially offset the decline in the overall index. Higher prices for beef and veal and for young chickens contributed to increases in both the stage 4 intermediate-demand and final-demand indexes from July 2011 to June 2012.
From July 2011 to June 2012, the indexes for final demand and stage 4 intermediate demand moved in the opposite direction of the stages 2 and 3 indexes. This divergence was mainly due to rising prices for services that outweighed falling prices for energy goods. (Services are more heavily weighted in the stage 4 index than in indexes at prior stages.) While lower prices for unprocessed goods appear to have transmitted forward to more-highly-refined goods at later stages of processing from July 2011 to June 2012, higher prices for services more than outweighed the decreases in stage 4 and final-demand goods. At stage 4 of intermediate demand, prices rose for wholesale trade, business loans, and legal services. Within final demand, higher prices were reported for retail and wholesale trade, hospital inpatient care, and airline passenger services. As stated earlier, changes in these services prices are unlikely the result of price transmission from earlier stages of production.
THIS ARTICLE PRESENTS AND ANALYZES DATA from the updated PPI FD–ID aggregation structure released on an experimental basis in February 2011. The new aggregation system expands coverage beyond the current PPI SOP system by adding price changes for the services and construction sectors of the economy to the system, as well as adding exports and government purchases.
By increasing coverage to include services, construction, exports, and government purchases, the updated aggregation system provides data users with a more accurate and comprehensive measure of producer inflation than the SOP system.By increasing coverage to include services, construction, exports, and government purchases, the updated aggregation system provides data users with a more accurate and comprehensive measure of producer inflation than the SOP system. For example, within the final-demand segment of the economy, the PPI for finished goods rose 9.8 percent from November 2009 to June 2012. The more comprehensive PPI for final demand advanced 7.6 percent, indicating a substantially lower measure of inflation than indicated by the finished goods index. Within intermediate demand, prices for processed goods climbed 14.0 percent from November 2009 to June 2012, and unprocessed goods prices advanced 18.5 percent. Services for intermediate demand increased at a slower 4.9-percent rate from November 2009 to June 2012. The addition of services to the PPI system, therefore, indicates a lower level of inflation on the intermediate-demand side of the economy from 2009 to June 2012 compared with the SOP system, which only includes goods. As with final demand, the more complete coverage of intermediate demand provided by the new PPI FD–ID aggregation system leads to a superior measure of overall producer inflation from November 2009 to June 2012 compared with the PPI SOP system.
The updated aggregation system also contains a production flow treatment of intermediate demand, which organizes commodities that are inputs to production into four stages and measures price changes for these inputs at each stage of intermediate demand. Unfortunately, data from the PPI production flow treatment only date back to November 2009, currently leaving an insufficient sample for rigorous econometric price-transmission modeling. However, analysis of the limited historical data from November 2009 through June 2012 suggests that price changes at earlier stages in the system transmitted to processed commodities at later stages in the structure. Rising prices for unprocessed petroleum goods at stage 2 led to price increases at subsequent stages of the system through higher prices for refined petroleum products, chemicals, plastics, and transportation services. Falling prices for wellhead natural gas, also found in stage 2 of intermediate demand, affected indexes at later stages through decreasing prices for industrial, commercial, and residential natural gas. Rising prices for grains were transmitted forward to subsequent stages through price increases for prepared animal feeds, slaughter cattle, slaughter chickens, beef and veal, and young chickens.
Brian Hergt, Joseph Kowal, and Jonathan C. Weinhagen, "Analyzing price movements within the Producer Price Index Final Demand–Intermediate Demand aggregation system," Monthly Labor Review, U.S. Bureau of Labor Statistics, January 2014, https://doi.org/10.21916/mlr.2014.3
1 For more information on the SOP system and how PPI calculates SOP indexes, see https://www.bls.gov/ppi/ppisopallo.htm.
2 Important areas not included in the PPI are education, residential rent, and residential construction.
3 All PPI aggregate indexes, including the SOP indexes and FD–ID indexes, are constructed from producers’ output prices. In both the SOP system and FD–ID system presented in this article, commodity prices are aggregated according to the type of buyer, and producer output prices are used as a proxy for actual prices paid by the buyer. In many cases, the same commodity is purchased by different types of buyers and is therefore included in more than one aggregate index. In these cases, the same PPI commodity index often is used in all aggregations. For example, regular gasoline is purchased for personal consumption, export, government use, and business use. The PPI program publishes only one commodity index for regular gasoline (wpu057104), and this index is used in all aggregations regardless of whether the gasoline is sold for personal consumption, as an export, to government, or to businesses.
4 As of December 2011, the relative importance of finished goods as a percentage of final demand was 23.952 percent. Within intermediate demand on a gross-weighted basis, services slightly outweighed the combined weight of processed and unprocessed goods as of December 2011. On a net-forward-flow basis, the production flow system of intermediate demand allocated services inputs to intermediate-demand stages as follows: stage 4, 48.082 percent; stage 3, 44.584 percent; stage 2, 41.155 percent, and stage 1, 40.353 percent.
5 See “A new, experimental system of indexes from the PPI program, Monthly Labor Review (February 2011), https://www.bls.gov/opub/mlr/2011/02/art1full.pdf.
6 Gross Domestic Product: second quarter 2012 (second estimate), BEA 12–35 (Bureau of Economic Analysis, August 29, 2012), p. 6, https://www.bea.gov/index.php/system/files/2019-02/gdp2q12_2nd.pdf.
7 “Navigating strong currents,” Global Economic Prospects (The World Bank, January 2011), p. 4, http://documents.worldbank.org/curated/en/293851468162862428/pdf/674090v10NWP000GEP2011JanFullReport.pdf.
8 See note 6.
9 Within the PPI stage-of-processing structure and new aggregation system, the indexes for goods other than foods and energy commonly are referred to as the core indexes.
10 “Corn yield plummets as drought continues,” Feed Outlook, FDS-12h (U.S. Department of Agriculture, August 14, 2012), p. 1 (figure 1), http://usda.mannlib.cornell.edu/usda/ers/FDS//2010s/2012/FDS-08-14-2012.pdf.
11 “Higher production and imports push supplies up,” Wheat Outlook, WHS-12h (U.S. Department of Agriculture, August 14, 2012), p. 17, http://usda.mannlib.cornell.edu/usda/ers/WHS//2010s/2012/WHS-08-14-2012.pdf.
12 “Higher corn acreage and yield boosts supplies, corn exports projected higher,” Feed Outlook, FDS-12a (U.S. Department of Agriculture, January 17, 2012), p. 4 and p. 6 (figure 7). The 5 billion bushels of corn marketed for ethanol production in 2011 reflected about 40 percent of total corn production for that year, 12.358 billion bushels.
13 For more information about fuel surcharges and their use by the transportation sector, see “The impact of fuel surcharges on the PPI,” Focus on Prices and Spending (U.S. Bureau of Labor Statistics, August 2011), https://www.bls.gov/opub/btn/archive/producer-price-indexes-the-impact-of-fuel-surcharges-on-the-ppi.pdf, as well as “How new fees are affecting the Producer Price Index for air travel,” Beyond the Numbers (U.S. Bureau of Labor Statistics, May 2012), https://www.bls.gov/opub/btn/volume-1/pdf/how-new-fees-are-affecting-the-producer-price-index-for-air-travel.pdf.
14 For more information about wholesale and retail trade indexes in the PPI and the treatment of margins in the wholesale and retail trade sectors, see “Wholesale and retail Producer Price Indexes: margin prices,” Beyond the Numbers (U.S. Bureau of Labor Statistics, August 2012), https://www.bls.gov/opub/btn/volume-1/pdf/wholesale-and-retail-producer-price-indexes-margin-prices.pdf.
15 As of December 2011, the relative-importance values for final-demand goods, services, and construction with respect to overall final demand were 34.721 percent, 63.520 percent, and 1.759 percent.
16 As of December 2011, the relative-importance values for final-demand trade services, transportation and warehousing services, and services other than trade and transportation with respect to final-demand services were 31.781 percent, 7.543 percent, and 60.676 percent.
17 As of December 2011, the remainder of the weight for goods within the final-demand goods index was allocated to goods for export (7.330 percent of final demand and 21.111 percent of final-demand goods) and government-purchased goods (3.438 percent of final demand and 9.902 percent of final-demand goods).
18 To measure prices for banking services, the PPI program has implemented a user-cost methodology. The user cost for a financial service is the difference between the revenue it generates and the sum of its implicit and explicit costs. To measure these costs, interest is allocated between loans and deposits by means of a reference rate. The reference rate is the opportunity-cost rate of money, where the risk premium has been eliminated to the greatest extent possible and intermediation services are excluded. For the PPI, the reference rate is the interest rate on risk-free assets held by the specific bank (if available) or by all banks. For more information on how PPI measures price change for banking, see https://www.bls.gov/ppi/ppibanking.htm.
19 Net inputs for a given stage include inputs to production consumed but not produced by industries within the stage.