An official website of the United States government
An official website of the United States government
The .gov means it's official.
Federal government websites often end in .gov or .mil. Before sharing sensitive information,
make sure you're on a federal government site.
The site is secure.
The
https:// ensures that you are connecting to the official website and that any
information you provide is encrypted and transmitted securely.

Defined benefit pension plans can provide financial security to retirees who receive the monthly benefit payments throughout their retirement. Defined benefit plans are pension plans that provide guaranteed income during retirement, and are often based on a formula that considers years of service and a percentage of a worker’s salary. Employers have traditionally offered defined benefit plans to their employees, but the high costs associated with these plans have caused many employers to switch to alternate retirement plan options.1 In March 2015, costs for defined benefit plans for private industry employers were approximately 61 cents per employee hour worked, on average. However, when data are averaged only by the employers that offer these plans, the costs are much higher. In this Beyond the Numbers article, we’ll explore how costs fluctuate by industry, occupation, establishment size, and region, and review trends in costs for employees with access to these plans from 2008 to 2015.
Costs for defined benefit plans are collected by the Bureau of Labor Statistics through the National Compensation Survey. For defined benefit plans, the survey collects data on premiums, administration fees, and dollar amounts placed by employers into pension funds. These amounts may be from cash, stock, corporate bonds, and other financial instruments. For private industry estimates, the National Compensation Survey does not collect actuarial estimates or actual costs of pension benefits paid to retirees.
Benefit costs collected by the survey are converted to hourly rates by dividing the annual costs by the annual hours worked, thus producing the employer costs for employee compensation estimates. These estimates measure compensation costs in cents per hour worked for a specific point in time (for example, the March reference period). The estimates include all employees regardless of access to benefits; this calculation produces lower costs than when eligibility is considered. Benefit incidence rates can be applied to benefit costs estimates to obtain a measure that shows how providing access to a benefit may affect an employer’s hourly labor costs. Costs for only those employees with access to a benefit (called access costs) can be derived by dividing the benefit costs estimate by the benefit access rate.2 For example, if the benefit costs were 48 cents per employee hour worked and 12 percent of employees had access to the benefit then the costs for employees with access would be $0.48 ÷ 12% = $4.00 per employee hour worked.3
In goods-producing industries, access costs have increased from $2.73 per employee hour worked in March 2008 to $4.48 in March 2015, and from $1.79 to $3.00 in service-providing industries. In March 2014, data show that access costs ranged from an average of $1.10 per employee hour worked in the financial activities industry sector to $7.63 per employee hour worked in the other services sector. In comparison, access costs in March 2008 ranged from an average of 67 cents in the leisure and hospitality sector to $5.61 in the construction sector. (See table 1.) The construction sector has had access costs in excess of $5.00 per employee hour worked from 2008 to 2015. These costs fluctuations raise questions about why some industries see larger cost changes than other industries. The other services industry sector experienced a sizeable increase from March 2011 through March 2014; however, this sector includes a variety of industries that may contribute to this volatility.
| Characteristic | Year | |||||||
|---|---|---|---|---|---|---|---|---|
| 2008 | 2009 | 2010 | 2011 | 2012 | 2013 | 2014 | 2015 | |
|
All goods-producing industries |
$2.73 | $2.74 | $2.90 | $3.18 | $3.04 | $3.28 | $4.00 | $4.48 |
|
Construction |
5.61 | 5.63 | 5.94 | 6.88 | 6.59 | 7.18 | 7.00 | 6.20 |
|
Manufacturing |
2.00 | 1.91 | 2.00 | 2.28 | 2.00 | 2.15 | 3.04 | 3.52 |
|
All service-providing industries |
1.79 | 1.68 | 1.74 | 1.78 | 2.06 | 2.24 | 2.29 | 3.00 |
|
Trade, transportation, and utilities |
1.77 | 1.59 | 2.00 | 1.95 | 2.00 | 2.32 | 2.32 | 2.42 |
|
Information |
2.14 | 1.78 | 1.26 | 1.30 | 3.35 | 3.43 | 1.32 | 8.00 |
|
Financial activities |
1.31 | 1.28 | 1.47 | 1.55 | 1.39 | 1.17 | 1.10 | 1.19 |
|
Professional and business services |
2.92 | 2.85 | 2.67 | 2.75 | 2.83 | 3.08 | 3.43 | 4.07 |
|
Education and health services |
1.29 | 1.29 | 1.35 | 1.50 | 1.44 | 1.56 | 2.24 | 2.50 |
|
Leisure and hospitality |
0.67 | 0.67 | 0.67 | 1.33 | 1.33 | 2.50 | 2.33 | 2.67 |
|
Other services |
1.88 | 2.44 | 2.70 | 2.50 | 4.67 | 5.89 | 7.63 | 6.67 |
|
Source: U.S. Bureau of Labor Statistics, National Compensation Survey and author’s own calculations. |
||||||||
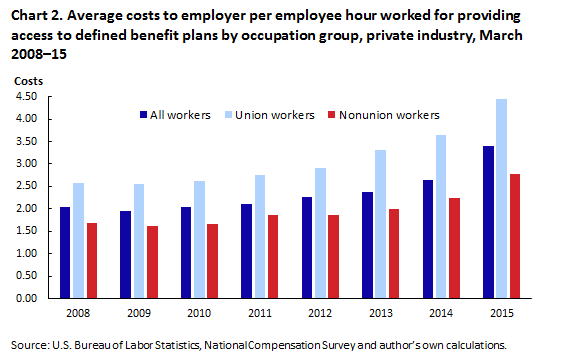
Employees covered by unions tend to have greater access to employee benefits, including retirement plans. Therefore, unionization may affect an employer’s costs for defined benefit plans. Higher unionization increases the likelihood that employees will have access to benefits such as defined benefit plans. Data show that 72 percent of union workers had access to defined benefit plans in March 2015, compared with 13 percent of nonunion workers with access. (See chart 1.) However, the access costs for union workers were $4.44 in March 2015, compared with $2.77 for nonunion workers. For all workers combined, employer costs for employees with access to defined benefit plans were $3.39 in March 2015, which is an increase from $2.05 in March 2008. (See chart 2.) This indicates that other factors, such as the differences in the generosity of the plan and funding, may contribute to increased costs.
Among the industry sectors with a union presence in 2015, higher levels of representation were found within transportation and utilities (20 percent), construction (14 percent), and manufacturing (10 percent).4 However, only 7 percent of the private industry as a whole had union representation in 2015. From the higher unionized industries in 2015, transportation and utilities employed 5.7 million workers, construction employed 7.1 million, and manufacturing employed 14.5 million workers.5 The breakdown of the trade, transportation, and utilities sector shows a strong union presence in transportation and utilities, and a smaller union presence in retail and wholesale trade. However, more people are employed in retail and wholesale trade and therefore it represents a larger portion of the trade, transportation, and utilities sector. (See table 2.)
| Industry | Total number of employed people | Percentage of the employed represented by unions |
|---|---|---|
|
Private industry |
113,152,000 | 7 |
|
Transportation and utilities |
5,722,000 | 20 |
|
Transportation and warehousing |
4,765,000 | 20 |
|
Utilities |
957,000 | 22 |
|
Construction |
7,109,000 | 14 |
|
Manufacturing |
14,547,000 | 10 |
|
Wholesale and retail trade |
18,798,000 | 5 |
|
Wholesale trade |
3,346,000 | 4 |
|
Retail trade |
15,452,000 | 5 |
|
Source: U.S. Bureau of Labor Statistics. |
||
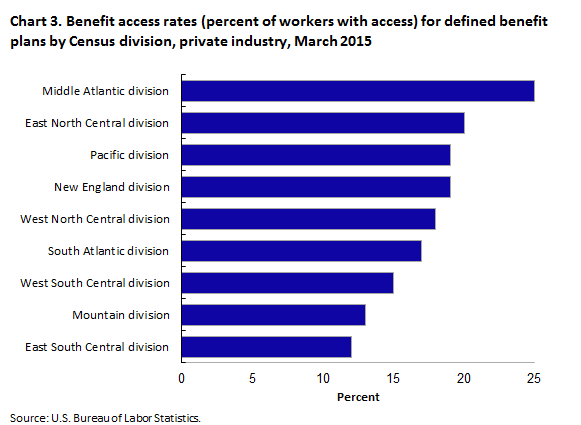
States in the Middle Atlantic and Pacific census divisions had union membership rates that were higher than the national average (11.1 percent) in 2015.6 States in the East and West South Central divisions had rates lower than the national average. The states with the largest numbers of union members were California (2.5 million) and New York (2 million).7 Data show that 25 percent of workers in the Middle Atlantic had access to defined benefit plans in March 2015, compared with 13 percent of workers who had access in the Mountain division. The South region, which consists of the South Atlantic, West South Central, and East South Central divisions, had relatively low levels of access to pension plans despite being the most populated region in the country. (See chart 3.)
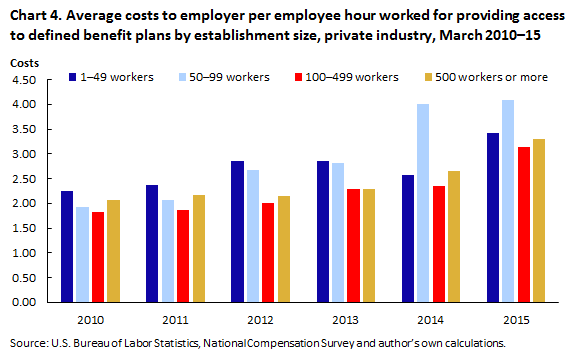
The costs for providing access to defined benefit plans do not necessarily increase as employer’s establishment size increases. Chart 4 shows that costs were at $4.08 for establishments with 50 to 99 workers in March 2015, compared with $3.14 for establishments with 100 to 499 workers. This is an increase from $1.93 for establishments with 50 to 99 workers and an increase from $1.83 for establishments with 100 to 499 workers in March 2010. Data show relative stability in the change in costs for establishments with 500 or more workers.
As mentioned earlier, the Middle Atlantic census division has above-average unionization rates and high levels of access to defined benefit plans. Substantial changes in access costs have been recorded for establishments with 50 to 99 workers and goods-producing industries. In addition, goods-producing industries have been shown to account for higher levels of unionization in 2014, even though unionization rates were on the decline.8
Employers typically pay monthly premiums for benefits such as health insurance, but defined benefit plans are different. Employers have some latitude in deciding when to make payments, although they still must follow legal and accounting guidelines and requirements. Required employer contributions for defined benefit pension plans may fluctuate depending on a company’s investment returns. In defined benefit plans, those responsible for managing the plan must act in the interest of plan participants. Therefore, certain investments are restricted by regulation.9 For example, a large percentage of funds cannot be invested in a company’s own stock. The investment performance of the pension fund plays a role in determining the amount and frequency of employer contributions, data about which are collected through the National Compensation Survey. When plans are underfunded, employers have to catch up and may make additional contributions. When plans are overfunded, employers might not make regular contributions. If a plan earns a rate of return that is equal to or greater than the rate of return promised to retirees, then the plan may become fully funded without additional contributions made by the employer.10
More generous plans have higher associated costs. Employers may offer both a defined benefit plan and a defined contribution savings and thrift plan to provide more generous retirement benefit to their employees. For defined contribution plans, an employee usually contributes a percentage of his or her salary to an individual account with a savings and thrift plan, and employers may offer to match an employee’s contribution up to a set maximum amount. These activities promote retirement saving as employees increase their retirement savings with additional funds from their employer. More generous plans contribute larger amounts in relation to employee contributions. Other factors that may influence employer contributions include how long an employee has worked for the company and whether the employer chooses a flat rate or a variable rate when matching the employee’s contribution.
Traditional defined benefit plan types use different formulas to calculate the annuity payment. One formula plan type provides retirees with an annuity based on a predetermined percentage of their final earnings. Another formula uses a percentage of wages earned throughout an employee’s entire career at the establishment. A final formula calculates an annuity payment by multiplying the years of service by a specified dollar amount. In addition, employer-contribution formula plans vary based on the policy set forth by employers regarding their specified contribution within the formula.
Nontraditional defined benefit plan types include cash-balance and pension-equity plans. Cash-balance plans promise an employer contribution equal to a percentage of each year’s earnings and a rate of return on that contribution, whereas the traditional defined benefit plans typically promise a flat dollar amount.11 A pension-equity plan provides an annuity benefit in terms of a current lump-sum value determined by providing a schedule of percentages that are accumulated throughout the career of the retiree. Accrual rates may vary based on the employee’s age and length of service.12
The costs for defined benefit plans of union workers tend to be higher than those for nonunion workers. In March 2014, data show that 91 percent of union workers participated in a traditional pension plan, compared with 52 percent of nonunion workers. In contrast, 48 percent of nonunion workers participated in a nontraditional plan, compared with 9 percent of union workers. Both union and nonunion workers participate in plans with a formula that calculates annuities using the percentage of final earnings; however, plans using a formula that multiplies years of service by a specified dollar amount are shown to have 51 percent of union workers participating, compared with 21 percent of all workers combined. (See table 3.)
| Type of plan | All workers | Union workers | Nonunion workers |
|---|---|---|---|
|
Traditional defined benefit plan |
67 | 91 | 52 |
|
Percent-of-final-earnings formula |
34 | 27 | 39 |
|
Percent-of-career-earnings formula |
8 | – | 10 |
|
Dollars-times-year formula |
21 | 51 | – |
|
Employer-contribution formula |
4 | – | – |
|
Nontraditional defined benefit plan |
33 | 9 | 48 |
|
Cash balance plan |
30 | 8 | 43 |
|
Pension equity plan |
3 | – | 5 |
|
Note: Dash indicates data not available or not applicable. Source: U.S. Bureau of Labor Statistics. |
|||
Eligibility and features of a plan also affect participation and therefore costs. For example, an employee cannot participate in a defined benefit plan if it is frozen to particular employees, making them ineligible for the benefit. Frozen defined benefit plans are closed to employees not previously participating, or limits are placed on future benefits for some or all active participants. Some frozen plans may no longer allow participants to accrue benefits. Others may change the prospective benefit formula to limit future accruals.13 A soft freeze means that a plan is closed to new entrants, but benefit accruals continue for current participants. A hard freeze indicates that a plan is closed to new entrants, and benefits are no longer being accrued for current participants.14 To reduce costs, employers may freeze plans and provide less generous plan provisions, benefits, and features.
Many factors influence costs to employers that provide access to a defined benefit plan to employees. Administrative aspects, such as policies surrounding a specific plan (generosity, investment, eligibility, etc.), greatly influence the price employers pay for these plans. Such information is employer-specific and may be difficult to collect. Unionization is a useful way to look at the trends in pension costs and access. Data show that lower unionization levels decrease relative access to defined benefit plans, and as the percentage of workers with access decrease, the costs to employers for these plans increase moderately.
This Beyond the Numbers article was prepared by Richard Works, economist in the Office of Compensation and Working Conditions, Bureau of Labor Statistics. Email: works.richard@bls.gov, telephone: (202) 691-6282.
Richard Works , “Trends in employer costs for defined benefit plans,” Beyond the Numbers: Pay & Benefits, vol. 5, no. 2 (U.S. Bureau of Labor Statistics, February 2016), https://www.bls.gov/opub/btn/volume-5/trends-in-employer-costs-for-defined-benefit-plans.htm
1 “Retirement costs for defined benefit plans higher than for defined contribution plans,” Beyond the Numbers: Pay and Benefits (U.S. Bureau of Labor Statistics, December 2012), www.bls.gov/opub/btn/volume-1/pdf/retirement-costs-for-defined-benefit-plans-higher-than-for-defined-contribution-plans.pdf.
2 Thomas G. Moehrle, John L. Bishow, and Anthony J. Barkume, “Benefit Cost Concepts and the Limitations of ECEC Measurement,” Monthly Labor Review (U.S. Bureau of Labor Statistics, July 2012), www.bls.gov/opub/mlr/cwc/benefit-cost-concepts-and-the-limitations-of-ecec-measurement.pdf.
3 Significance testing for access costs was unable to be conducted for this paper as relative standard errors specifically for access costs are not available. The National Compensation Survey provides relative standard errors for cost estimates, as well as for incidence rates. However, relative standard errors are not provided for the calculated estimate of access costs as used in the following comparisons.
4 “Union affiliation,” U.S. Bureau of Labor Statistics, https://www.bls.gov/news.release/union2.t03.htm.
5 “Industries at a glance,” U.S. Bureau of Labor Statistics, www.bls.gov/iag/home.htm.
6 The Middle Atlantic division consists of New Jersey, New York, and Pennsylvania. East North Central division consists of Illinois, Indiana, Michigan, Ohio, and Wisconsin. Pacific division consists of Alaska, California, Hawaii, Oregon, and Washington. New England division consists of Connecticut, Maine, Massachusetts, New Hampshire, Rhode Island, and Vermont. West North Central division consists of Iowa, Kansas, Minnesota, Missouri, Nebraska, North Dakota, and South Dakota. South Atlantic division consists of Delaware, Florida, Georgia, Maryland, North Carolina, South Carolina, Virginia, Washington DC, and West Virginia. West South Central division consists of Arkansas, Louisiana, Oklahoma, and Texas. Mountain division consists of Arizona, Colorado, Idaho, Montana, Nevada, New Mexico, Utah, and Wyoming. East South Central division consist of Alabama, Kentucky, Mississippi, and Tennessee.
7 “Union Members Summary,” U.S. Bureau of Labor Statistics, www.bls.gov/news.release/union2.nr0.htm.
8 “Union membership rate in private industry was 6.6 percent in 2014,” U.S. Bureau of Labor Statistics, www.bls.gov/opub/ted/2015/union-membership-rate-in-private-industry-and-public-sector-in-2014.htm.
9 William Wiatrowski, “Changing landscape of employment-based retirement benefits,” Monthly Labor Review (U.S. Bureau of Labor Statistics, September 2011), www.bls.gov/opub/mlr/cwc/changing-landscape-of-emplo yment-based-retirement-benefits.pdf.
10 Kenneth R. Elliott and James H. Moore, Jr., “Cash Balance Pension Plans: The New Wage,” Compensation and Working Conditions (U.S. Bureau of Labor Statistics, Summer 2000), www.bls.gov/opub/mlr/cwc/cash-balance-pension-plans-the-new-wave.pdf.
11 Ibid.
12 L. Bernard Green, “What is a Pension Equity Plan,” Compensation and Working Conditions (U.S. Bureau of Labor Statistics, October 2003), www.bls.gov/opub/mlr/cwc/what-is-a-pension-equity-plan.pdf.
13 “‘Frozen’ defined-benefit plans,” Program Perspectives (U.S. Bureau of Labor Statistics, April 2010), www.bls.gov/opub/btn/archive/program-perspectives-on-frozen-defined-benefit-plans-pdf.pdf.
14 Scott F. Curtin, “Alternatives to frozen defined benefit pension plans,” Monthly Labor Review (U.S. Bureau of Labor Statistics, August 2009), www.bls.gov/opub/mlr/cwc/alternatives-to-frozen-defined-benefit-pension-plans.pdf.
Publish Date: Friday, February 19, 2016