An official website of the United States government
An official website of the United States government
The .gov means it's official.
Federal government websites often end in .gov or .mil. Before sharing sensitive information,
make sure you're on a federal government site.
The site is secure.
The
https:// ensures that you are connecting to the official website and that any
information you provide is encrypted and transmitted securely.

High-tech industries are an important part of the U.S. economy, employing nearly 17 million workers in 2014. While this accounted for about 12 percent of total employment, the high-tech sector contributed almost 23 percent of output. According to a study funded by the Workforce Information Council, the high-tech sector can be defined as industries having high concentrations of workers in STEM (Science, Technology, Engineering, and Mathematics) occupations.1 Although the term high-tech has been notoriously difficult to define, as technology changes all the time, this analysis provides an approach to defining jobs that are in in this sector.
This issue of Beyond the Numbers applies the approach used by WIC to Bureau of Labor Statistics (BLS) data on industry employment and output. It provides an overview of which industries make up the high-tech sector and analyzes historical and projected industry employment and output data from the BLS Employment Projections program. This article offers insights on the performance and composition of the high-tech sector and its significance to the U.S. economy.
Although the North American Industry Classification System (NAICS), the government’s official industry classification, does not define high-tech industries, the 2010 Standard Occupational Classification (SOC) system defines certain occupations as STEM occupations. To identify high-tech industries, we use data from the Occupational Employment Statistics survey and the Current Population Survey to determine the share of jobs in each industry that were held by STEM workers.2 These include various types of engineers, IT workers, scientists, postsecondary teachers, and managers of these workers.
STEM occupations account for 5.8 percent of all jobs in the U.S. economy. To begin this analysis, we identify the industries that had a share that was two and a half times the national average (industries in which at least 14.5 percent of jobs were in STEM occupations) as high-tech industries.3 Then, we separate the industries into two groups: high-tech manufacturing industries, a subset of the goods-producing industry, and high-tech service industries. (This analysis focuses on manufacturing and services even though there are other high-tech industry groups under goods producing.) Once we can identify which industries are high-tech, we can explore characteristics of the high-tech industry, such as the number of wage and salary jobs, and the dollar value of output that the high-tech sector contributes to the U.S. economy. For those characteristics, we use employment data to measure the amount of high-tech wage-and-salary jobs and output data to measure the dollar value of goods and services produced by an industry.
This analysis uses the industry sectors for which BLS produces projections of industry output and employment. Using this set of industries allows for analysis of both historical and projected employment and output data. All output figures are measured in nominal dollars to allow for accurate comparisons of output shares.
BLS produces employment and output data for 206 industry sectors. Table 1 contains a list of the 33 industries identified as high-tech industries for this analysis. Sixteen are manufacturing industries, which are classified as high-tech because of the large concentration of engineers working in them. Twelve are services industries, which tend to have higher concentrations of scientists and computer and mathematical occupations. The first analysis section focuses on the group of all high-tech industries, the second section focuses on the differences in performance of high-tech manufacturing industries compared with high-tech services industries.
| Industry title | 2014 Employment (in thousands) | 2014 Output (in billions) |
|---|---|---|
|
High-tech manufacturing industries |
||
|
Petroleum and coal products |
110.7 | $817.9 |
|
Basic chemical |
147.1 | 276.0 |
|
Resin, synthetic rubber, and artificial synthetic fibers and filaments |
93.1 | 111.6 |
|
Pharmaceutical and medicine |
279.5 | 244.3 |
|
Industrial machinery |
108.1 | 49.1 |
|
Commercial and service industry machinery manufacturing, including digital camera |
87.5 | 29.9 |
|
Engine, turbine, and power transmission equipment |
102.9 | 52.0 |
|
Other general purpose machinery |
264.7 | 109.8 |
|
Computer and peripheral equipment manufacturing, excluding digital camera |
162.8 | 62.6 |
|
Communications equipment |
93.5 | 60.0 |
|
Audio and video equipment |
18.9 | 7.0 |
|
Semiconductor and other electronic component |
367.8 | 123.0 |
|
Navigational, measuring, electromedical, and control instruments |
388.3 | 158.4 |
|
Manufacturing and reproducing magnetic and optical media |
18.9 | 6.1 |
|
Electrical equipment manufacturing |
143.7 | 39.9 |
|
Aerospace product and parts |
488.4 | 258.0 |
|
High tech services industries |
||
|
Pipeline transportation |
47 | 30.4 |
|
Software publishers |
312.5 | 192.4 |
|
Wired telecommunications carriers |
607 | 390.4 |
|
Wireless telecommunications carriers (except satellite) |
155.3 | 245.1 |
|
Satellite, telecommunications resellers, and all other telecommunications |
93.5 | 41.9 |
|
Data processing, hosting, and related services |
279.4 | 133.3 |
|
Other information services |
217.8 | 76.4 |
|
Architectural, engineering, and related services |
1,380.40 | 322.8 |
|
Computer systems design and related services |
1,777.70 | 351.5 |
|
Management, scientific, and technical consulting services |
1,244.40 | 214.2 |
|
Scientific research and development services |
634.7 | 239.6 |
|
Management of companies and enterprises |
2,169.40 | 574.9 |
|
Other high tech industries |
||
|
Forestry |
15.8 | 6.9 |
|
Oil and gas extraction |
197.9 | 410.4 |
|
Electric power generation, transmission and distribution |
392.1 | 291.3 |
|
State government education |
2,409.20 | 147.0 |
|
Federal government |
2,136 | 1,062.0 |
|
Source: U.S. Bureau of Labor Statistics. |
||
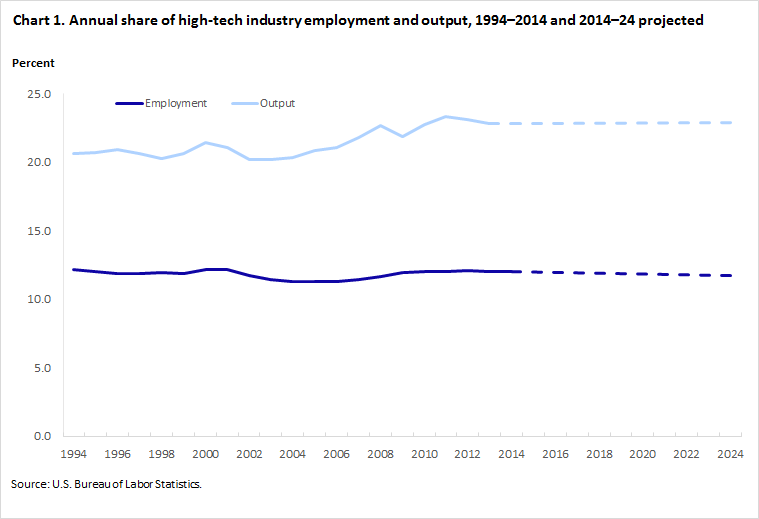
High-tech industries accounted for 16.9 million jobs in 2014, or 12.0 percent of total employment. (See chart 1.) From 1994 to 2024, the share of employment in high-tech industries has stayed within a narrow range of 11.3 percent to 12.1 percent. Notable during this period was the impact of the two recessions, the dot-com bubble recession of 2001, and the Great Recession of 2007–09.4 High-tech employment fell from 12.1 percent of all jobs in 2001 to 11.3 percent in 2004, a decline of 1.1 million jobs, as the high-tech sector was harder hit by the bursting of the dot-com bubble and its aftermath than other sectors of the economy. Non-high-tech industries lost 689,000 jobs between 2001 and 2002, but recovered the lost jobs by 2004. During the Great Recession, however, the opposite trends played out: the high-tech sector share of total employment grew from 11.4 percent in 2007 to 12.0 percent in 2010 as that sector lost just 64,000 jobs while the rest of the economy lost 7.6 million jobs.
In terms of output, high-tech industries contributed $7.1 trillion in 2014, accounting for 22.8 percent of total output, down slightly from an all-time high of 23.3 percent in 2011. The high-tech share of output remained relatively constant between 20 percent and 21 percent from 1994–2006, aside from a slight increase right before the dot-com recession of 2001. However, the high-tech share of output has been at a higher level since the Great Recession, remaining close to 23 percent since 2010.
From 2014 to 2024, the high-tech sector is projected to gain 691,000 jobs as it grows at a slightly lower than average rate, resulting in an 11.7-percent share of total employment in 2024. Output is projected to grow by $2.4 trillion, in line with the overall economy, as the high-tech sector maintains its share of output at 22.9 percent.
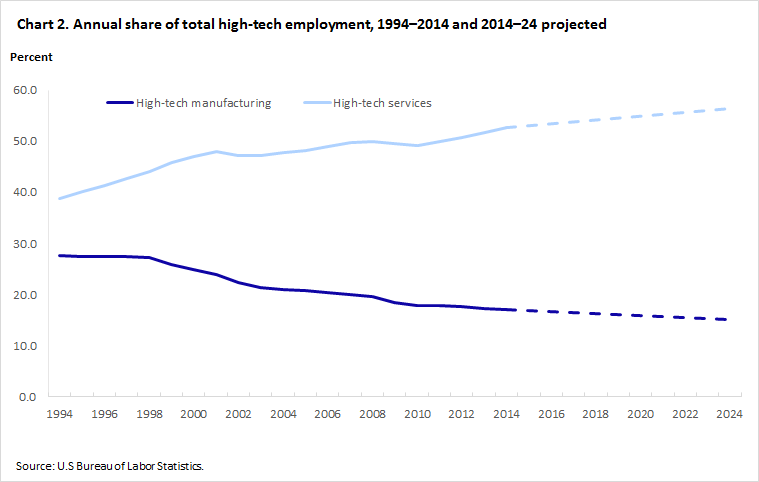
In 2014, high-tech services industries accounted for 52.6 percent of high-tech employment, compared with just 17.0 percent in high-tech manufacturing industries. (See chart 2.)5 The dominance of high-tech services industries is a relatively recent phenomenon: in 1994, high-tech services were only slightly larger than high-tech manufacturing industries. However, over the past 20 years, high-tech services industries grew by 3.4 million jobs, while high tech manufacturing industries declined by 1.0 million jobs. In projections to 2024, this trend is expected to continue, with high-tech services industries adding 1.0 million jobs and high-tech manufacturing losing 212,000. This growth will take the high-tech services share of all high-tech employment up to 56.4 percent.
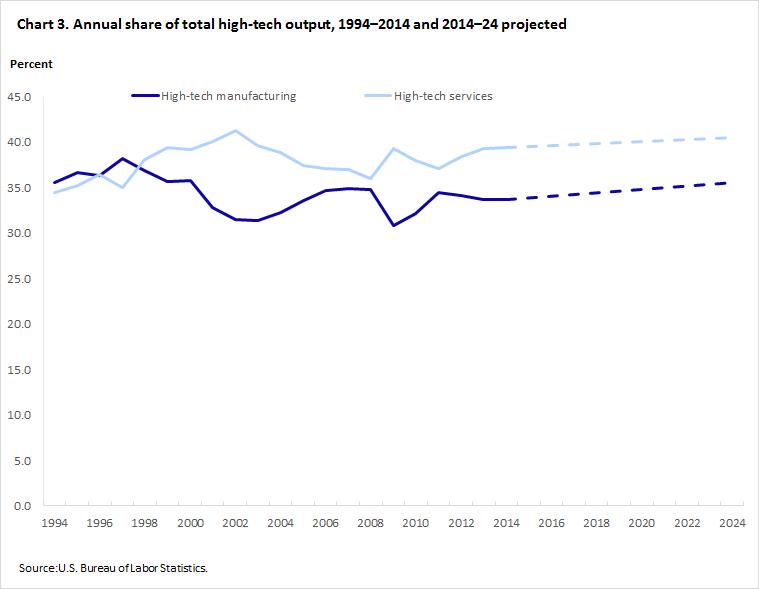
As chart 3 shows, however, high-tech manufacturing output has seen only a slight decline in share, accounting for 33.7 percent of total high-tech output in 2014, little changed from its 35.5-percent share in 1994. In 2024, high-tech manufacturing is projected to account for 35.5 percent of high-tech output.
High-tech industries are an essential part of the U.S. economy, providing about 12 percent of all jobs but producing almost 23 percent of output. Although they were hit harder by the 2000–01 recession, they were largely insulated from the effects of the 2007‒09 recession. While overall high-tech employment has remained relatively stable as a share of total employment, the high-tech sector has seen dramatic shifts from manufacturing to services, which now account for 52.6 percent of all high-tech employment, and is projected to increase to 56.4 percent by 2024.
This Beyond the Numbers article was prepared by Michael Wolf, Economist, and Dalton Terrell, former Economist, in the Division of Occupational Employment Projections, Office of Employment and Unemployment Statistics, Email: wolf.michael@bls.gov, Telephone: (202) 691-5714.
Upon request, the information in this article will be made available to individuals who are sensory impaired. Voice phone: (202) 691-5200. Federal Relay Service: 1-800-877-8339. This article is in the public domain and may be reproduced without permission.
Michael Wolf and Dalton Terrell, “The high-tech industry, what is it and why it matters to our economic future,” Beyond the Numbers: Employment & Unemployment, vol. 5, no. 8 (U.S. Bureau of Labor Statistics, May 2016), https://www.bls.gov/opub/btn/volume-5/the-high-tech-industry-what-is-it-and-why-it-matters-to-our-economic-future.htm
1 For more information about the Workforce Information Council (WIC) study, see http://www.labor.idaho.gov/publications/Exploring_High-Tech_Industry.pdf
2 This study uses sub-domain 1 of the STEM classification: https://www.bls.gov/soc/Attachment_C_STEM.pdf
3 A similar approach to defining high-tech industries is used in Daniel Hecker, “High-tech employment: a NAICS-based update,” Monthly Labor Review, July 2005, https://www.bls.gov/opub/mlr/2005/07/art6full.pdf
4 Recessions are identified by the National Bureau of Economic Research (NBER). According to the NBER, the most recent recession began in December 2007 and ended in June 2009. The dot-com recession began in March 2001 and ended in November 2001.
5 The remainder of high-tech employment was in agriculture, mining, utilities, and government industries.
Publish Date: Tuesday, May 17, 2016