
An official website of the United States government
An official website of the United States government
The .gov means it's official.
Federal government websites often end in .gov or .mil. Before sharing sensitive information,
make sure you're on a federal government site.
The site is secure.
The
https:// ensures that you are connecting to the official website and that any
information you provide is encrypted and transmitted securely.

The 2015 Hollywood blockbuster movie “San Andreas” portrayed a doomsday scenario whereby virtually all of California was devastated by a major earthquake. Although the movie version is almost certainly different from a likely major earthquake scenario in California, the threat of a major and damaging earthquake in Northern California, and especially the San Francisco Bay Area is real, imminent and would be disruptive to businesses and the regional economy. Major earthquakes of magnitude 7.0 or greater can devastate public infrastructure, rendering transportation and public utilities such as gas, electricity and water out of service for days, weeks, and longer. Human lives are at risk when there are damaged residences, businesses and public transportation and utility systems. Business losses can mount in proportion to the size of the earthquake event, through direct property damage and business interruption. Aside from physical losses and disruption, business losses may also manifest in a longer term loss of customers, the means to supply customer needs, and the effects of financial stress on the community or region. Major earthquakes are destructive and are highly likely in Northern California.
According to the U.S. Geological Survey (USGS), there is a 72-percent chance of a magnitude-6.7 or greater earthquake hitting the San Francisco Bay Area region from 2014 to 2043. There is also a 98-percent chance of a magnitude 6.0 or greater earthquake during the same period. The Hayward Fault, which runs through the East Bay of the San Francisco Bay Region, is the most likely source of a large earthquake striking Northern California with a 33-percent probability over a 30-year period.1
Various estimates of economic loss have been prepared by the U.S. Geological Survey, the California Geological Survey, and private insurance risk estimators. Some estimates are based on the loss of physical capital, although more recent studies have tried to account for the business interruption losses to firms. Economic activity losses vary depending on the size of the scenario earthquake and the type (physical capital or business interruption) of losses estimated. Accordingly, losses from a magnitude-6.9 Hayward earthquake vary widely, ranging from $23 billion for building-related losses to $210‒$235 billion in insured and uninsured economic damages.2 These estimates are informative in painting a picture of the various potential losses from a Hayward scenario event.
This Beyond the Numbers article updates a previous BLS Regional Report, “Labor market risks of a magnitude 6.9 earthquake in Alameda County,” that provided estimates of potential exposure to San Francisco Bay Area businesses and employees. This article analyzes the most damaged areas anticipated for that event—those areas with very strong to severe shaking on the Modified Mercalli Index (MMI VII or greater).3 We identify the businesses in these probable shaking zones and quantify the businesses, employees, and wages that are at risk.
Like the 2007 Regional Report, this article presents an exposure analysis. It provides a perspective of damage assessment by summing the exposure to businesses in areas damaged by a scenario earthquake in the San Francisco Bay Area. If a business’ activities are disrupted by a major earthquake, there will likely be an associated loss of wages and employment. This geographic analysis is more specific than many other types of analyses in that the locations, wages, and employment of businesses are well represented in the Bureau of Labor Statistics Quarterly Census of Employment and Wages (QCEW) files, and these locations can be mapped in detail against scientific estimates of the expected range and area of damage, given a scenario earthquake.
However, these estimates are not as precise as the actual losses because not all businesses in damaged areas will experience physical loss or business interruption—the actual effect on individual businesses is too specific to be captured based on relative damage areas. These estimates do, however, represent the exposure of private businesses to a given magnitude scenario earthquake, namely a magnitude 6.8-earthquake on the Hayward Fault.
The Hayward Fault runs directly through the heavily populated Alameda, Contra Costa, and Santa Clara counties. These three counties and nearby San Francisco county are the four most exposed counties in the region in terms of potential damage from earthquakes occurring on the Hayward Fault. Two other counties—Marin and San Mateo are further from the Hayward Fault. These six counties make up a population of 6.5 million inhabitants over a 3,700 square mile area, with most of the population and businesses located in northern Santa Clara County and the western parts of Alameda and Contra Costa counties. There is a total of 244,000 businesses or establishments and 3.0 million jobs in the six counties.
As reported in a previous Regional Report, the Hayward Fault is known to generate a damaging earthquake every 150 years. The last event, occurring in 1868, is now known as the “Hayward Earthquake.” This earthquake was known as “The Great San Francisco Earthquake” until 1906 when a larger earthquake caused by a rupture in the San Andreas Fault assumed that eponymous name. The Hayward Fault underlies a populous urban area principally in Alameda County, and extends 74 miles along the eastern San Francisco Bay adjacent to and within Contra Costa and Santa Clara counties. The Hayward Fault runs south through densely populated areas, including the cities of Richmond, El Cerrito, Berkeley, Oakland, San Leandro, Hayward, Union city, Fremont, and San Jose.
The magnitude-6.8 earthquake event used in this analysis is a slightly different scenario for a Hayward earthquake than the magnitude-6.9 event analyzed in 2007. It is lesser in magnitude than the earthquake analyzed in the previous Regional Report and much less damaging than the potential effects from a Hayward-Rodgers Creek earthquake of magnitude 7.2 or greater. Such an event could occur if the Hayward Fault interacted with the Rodgers Creek Fault to generate a much larger event over an expanded area.4 Therefore, as disclaimers on financial statements often advise, “actual results may vary.” So it is with earthquake damage estimation—the actual losses of the Hayward Fault earthquake may be less or greater than estimated.
Two datasets were merged to prepare for the analysis: a geographic file with shaking intensities from the USGS and an establishment-level micro dataset containing employment and wages from QCEW. The geographic file of intensities, which uses MMI scale measurements, gauges the effects of an earthquake at various distances from the fault rupture. The MMI scale ranges from I (not felt) to XII (total damage). The analysis in this article focuses on those areas with estimated shaking intensities of VII and higher on the MMI scale, that is, areas of very strong shaking and moderate damage to areas with severe shaking and moderate to heavy damage.
The QCEW microdata contain geocoded establishment data, including the employment and wages associated with individual business firms as of the third quarter of 2014. This dataset is then overlaid with the U.S. Geological Survey shaking intensity file to tabulate the exposures to establishments and the employment and wages attributed to those firms. When employment and wages data from the QCEW are spatially integrated with the shaking intensity zones provided by the shaking intensity file, we are able to tabulate the potential business and labor market losses from a major earthquake. Our analysis includes both the exposure across the six Bay Area counties and the impact on major industrial sectors.
Our analysis of business exposures attributable to earthquakes has certain limitations. The MMI values describe damage levels ranging from predominately light damage to widespread heavy damage. Even in the most damaged area, not all businesses will sustain damage that will curtail their activities, and some businesses that lose capability will return soon to normal operations. Thus, gauging economic impact by projected MMI levels may overstate the business interruption or losses that will occur.
However, direct damage to a region’s businesses understates the interactional effects on customers or suppliers inside and outside of the damaged areas. Some businesses cluster in regions to be near their customers and suppliers. If this relationship is interrupted by an earthquake, both customers and suppliers could be severely affected, or even put out of business. The expected loss of life and damage to infrastructure and utilities may also interrupt the flow of goods and services in Northern California and the United States as a whole because the area is a vital transportation hub for shipments by air, water, rail and truck.
The Hayward magnitude-6.8 earthquake is likely to have broad impacts beyond the labor market, creating greater losses inside and outside the region than can be estimated using only MMI scales and damage zones. In addition, as mentioned earlier, businesses that were not geocoded in the QCEW database were excluded from this analysis, so the results presented here represent a slightly lower bound estimate of the at-risk labor market.
Based on the geographic overlap of businesses and shaking intensity zones, figure 1 depicts the dispersion of shaking intensity of business establishments. Areas of red designate those business locations with severe shaking and moderate to heavy damage (MMI VIII or greater). Orange colored business locations represent MMI VII intensity as those in very strong shaking areas with moderate damage.
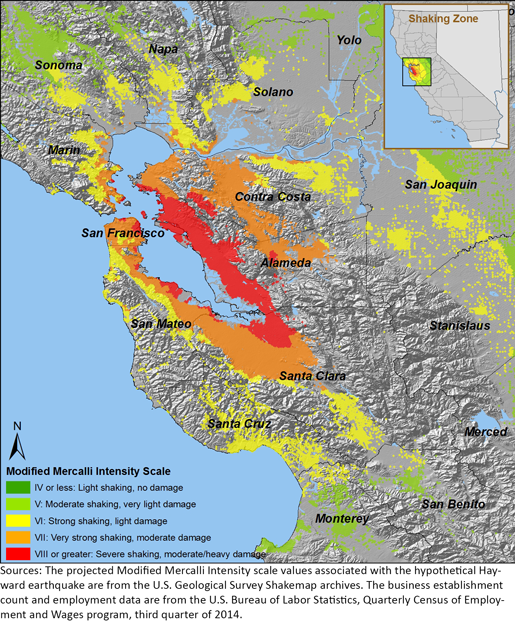
The inset of figure 1 delineates the shaking intensities that could occur as the result of a magnitude 6.8 earthquake on the Hayward Fault without respect to business locations. It is apparent from these overlaid data that although most of severely affected businesses are in Alameda County, there are clusters in Contra Costa, Santa Clara, and San Mateo counties. The business effects in the two shaking zones with most intensity (MMI VII and MMI VIII+) are summed in table 1.
| County | Employers | Employment | Quarterly wages (millions of dollars) |
|---|---|---|---|
|
Total |
101,300 | 1,537,000 | 37,500 |
|
Alameda |
51,400 | 587,000 | 9,600 |
|
Contra Costa |
4,200 | 64,000 | 1,200 |
|
Marin |
600 | 8,000 | 100 |
|
San Francisco |
14,700 | 292,000 | 8,100 |
|
San Mateo |
4,100 | 115,000 | 4,500 |
|
Santa Clara |
26,400 | 471,000 | 14,100 |
|
1 Table includes estimates based on intensities MMI VII or greater: very strong to severe shaking, moderate to heavy damage. Source: U.S. Bureau of Labor Statistics and U.S. Geological Survey. |
|||
Total exposures for the six counties in the San Francisco Bay Area that are in the very strong shaking zone (MMI VII) and destructive shaking zone (MMI VIII or higher) include 101,300 employers, 1.54 million jobs and quarterly wages of $37.5 billion. This compares with 84,400 employers, 1.48 million jobs and quarterly wages of $24.4 billion for the comparable six counties in the previous Regional Report. Even though this event is slightly less powerful than the previous scenario earthquake, the exposure has risen due to more businesses in the most risky areas. As a result, the exposure to the number of employers, employment, and wages are greater by 20 percent, 4 percent, and 54 percent, respectively. In the wide area circumscribed by both zones, the business, employment, and earnings exposures would fall primarily upon the counties of Alameda, Contra Costa, Marin, San Francisco, San Mateo, and Santa Clara; with Alameda County most affected and Marin County, the least. Alameda and Santa Clara counties account for three quarters of the businesses and 69 percent of the employment in the six counties. In addition, 25 percent of the total quarterly wages are attributed to Alameda County alone.
As shown in table 2, the percentage of each county’s employment base that is considered to be at risk during an earthquake varies greatly; even so, at least 40 percent of all businesses, employment, and wages across the six-county areas are exposed to moderate to heavy damage. Alameda County has the greatest estimated exposure to employers, employment, and wages, with at least 87 percent of each category affected. The counties of Santa Clara and San Francisco are the next most exposed counties, with 41 and 26 percent, respectively, of their businesses in the very strong to severe shaking zone. San Mateo and Contra Costa counties also have significant percentages of their businesses, employment, and wages affected. Further away and less-dense Marin county is affected the least by the Hayward scenario earthquake.
| County | Employers affected | Employment affected | Wages affected |
|---|---|---|---|
|
Total |
42 | 51 | 58 |
|
Alameda |
91 | 87 | 88 |
|
Contra Costa |
14 | 19 | 24 |
|
Marin |
5 | 8 | 8 |
|
San Francisco |
26 | 47 | 59 |
|
San Mateo |
16 | 31 | 51 |
|
Santa Clara |
41 | 50 | 57 |
|
1 Intensities of MMI VII or greater include very strong to severe shaking, moderate to heavy damage. Source: U.S. Bureau of Labor Statistics and U.S. Geological Survey. |
|||
Just as the exposure to various counties ranges widely, the exposure for San Francisco Bay Area industries varies across the board as shown in table 3. The earthquake would affect a large number of jobs in healthcare (152,000); professional, scientific, and technical services (222,000); manufacturing (195,000); and retail trade (110,000). Although California has a hospital seismic safety program, some hospitals are still vulnerable to strong shaking.5 The shaking zone map tabulations show that 41 percent of hospitals and medical facilities and 38 percent of healthcare workers are located in the shaking zones that are expected to experience the most damage.
With the exception of the agriculture, forestry, fishing and hunting industries, every industry within the six-county area could have one-third or more of their total employment located in the very strong to severe shaking zones. The potential economic consequences to employers and workers in the San Francisco Bay Area are widespread and are likely to have an effect on the state economy, and in turn, the national economy because of the far-reaching economic ties between firms and industries in California and beyond. This level of exposure to strong to severe shaking could adversely affect every stage of recovery. First response efforts to a 6.8-magnitude earthquake may be hampered by the extent of the damage to the healthcare and social assistance sectors. Longer term recovery may also be delayed due to the impacts on manufacturing and retail. Even in the San Francisco Bay Area industries, with fewer establishments and lower rates of employment such as information and enterprise management, the effects on high-wage jobs may depress recovery by reducing demand for consumer goods and services.
| Industry | Business establishments | Employment | Quarterly wages (millions of dollars) | Percentage of industry establishments | Percentage of industry employment |
|---|---|---|---|---|---|
|
Total |
101,600 | 1,537,000 | $37,520 | 42 | 51 |
|
Manufacturing |
3,900 | 195,000 | 6,720 | 59 | 71 |
|
Wholesale trade |
4,500 | 71,000 | 1,690 | 55 | 65 |
|
Management of companies and enterprises |
500 | 45,000 | 1,640 | 51 | 65 |
|
Transportation and warehousing |
1,500 | 57,000 | 820 | 50 | 58 |
|
Information |
1,800 | 106,000 | 6,730 | 49 | 71 |
|
Mining, quarrying, and oil and gas extraction |
(1) | 1,000 | 20 | 48 | 62 |
|
Professional, scientific, and technical services |
13,600 | 222,000 | 7,750 | 45 | 57 |
|
Public administration |
500 | 33,000 | 800 | 42 | 44 |
|
Unclassified |
2,100 | 4,000 | 50 | 41 | 44 |
|
Health care and social assistance |
35,400 | 152,000 | 2,090 | 41 | 38 |
|
Administrative and support and waste management and remediation services |
3,400 | 107,000 | 1,490 | 41 | 58 |
|
Educational services |
2,300 | 84,000 | 1,190 | 40 | 38 |
|
Arts, entertainment, and recreation |
6,300 | 117,000 | 720 | 40 | 40 |
|
Finance and insurance |
3,500 | 53,000 | 1,700 | 39 | 48 |
|
Retail trade |
6,500 | 110,000 | 1,030 | 38 | 38 |
|
Real Estate and rental and leasing |
3,300 | 26,000 | 440 | 38 | 49 |
|
Accommodation and food services |
900 | 26,000 | 440 | 37 | 44 |
|
Other services (except public administration) |
7,300 | 47,000 | 530 | 35 | 44 |
|
Construction |
4,200 | 73,000 | 1,440 | 35 | 51 |
|
Utilities |
(1) | 8,000 | 220 | 30 | 69 |
|
Agriculture, forestry, fishing and hunting |
100 | 1,000 | 10 | 17 | 12 |
|
1 Data not shown where there are less than 100 establishments. Source: U.S. Bureau of Labor Statistics and U.S. Geological Survey. |
|||||
As the number of workers has grown in the San Francisco Bay Area, the potential losses from a large earthquake on the Hayward Fault have increased for comparable counties since our previous estimate in 2007. Nearly half of the workforce in the six most affected counties will be directly exposed to the shaking effects of a magnitude-6.8-East Bay Earthquake. These direct effects will vary by business and location, but will also be accompanied by the increased effects from disruptions to infrastructure such as transportation and public utilities. The magnitude-6.8 Hayward earthquake suggested by U.S. Geological Survey intensity maps will likely produce a devastating shock to the Bay Area economy. The potential labor market risks to the region identified in this report provide greater focus on specific industries exposed to damaging economic effects due to their location. In this way, it provides a specific urgency to accompany the general urgency that residents and businesses of the San Francisco Bay Area should have in preparing for an earthquake on the Hayward Fault.
Disclaimer:
BLS is not making a specific earthquake prediction. The purpose of this article is to describe the labor market at risk in the event of one possible earthquake scenario. An article analyzing the risk of an earthquake occurring along the Hayward Fault was published by the U.S. Geological Survey Working Group on California Earthquake probabilities in a 2003 report and updated in 2008. The working group was composed of scientists from the federal and state governments, private industry, consulting firms, and academia. The projected Modified Mercalli Intensity scale values associated with the hypothetical Hayward earthquake are from the U.S. Geological Survey Shakemap archives.
This Beyond the Numbers article was prepared by Richard J. Holden, Tian Luo, Anne Heidl, and Amar Mann economists of the Bureau of Labor Statistics. Email: holden.richard@bls, telephone: (415) 625-2245.
Upon request, the information in this article will be made available to individuals who are sensory impaired. Voice phone: (202) 691-5200. Federal Relay Service: 1-800-877-8339. This article is in the public domain and may be reproduced without permission.
Richard J. Holden, Tian Luo, Anne Heidl, and Amar Mann, “Labor market risks of a magnitude-6.8 Hayward Fault earthquake in the San Francisco Bay Area: an update,” Beyond the Numbers: Regional Economies, vol. 5, no. 15 (U.S. Bureau of Labor Statistics, October 2016), https://www.bls.gov/opub/btn/volume-5/labor-market-risks-of-a-magnitude-6-8-hayward-fault-earthquake-in-the-san-francisco-bay-area-an-update.htm
1 Brad T. Aagaard, James Luke Blair, John Boatwright, Susan H. Garcia, Ruth A. Harris, Andrew J. Michael, David P. Schawartz, and Jeanne S. DiLeo “2016, Earthquake outlook for the San Francisco Bay region 2014–2043: U.S. Geological Survey Fact Sheet 2016–3020,” U.S. Geological Survey, http://pubs.usgs.gov/fs/2016/3020/fs20163020.pdf. Also, one simulation created by the USGS ShakeOut Scenario examined the implications of a magnitude-7.3 earthquake involving a rupture of both the Hayward and Rodgers Creek Faults. In this scenario, the rupture begins beneath the San Pablo Bay and simultaneously proceeds south to the city of Fremont on the Hayward Fault and north to the city of Santa Rosa on the Rodgers Creek Fault. The Hayward and Rodgers Creek Faults underlie the most heavily populated parts of Alameda, Contra Costa, and Sonoma counties. The magnitude-7.3 earthquake modeled by the USGS would create very strong to severe shaking and cause moderate to heavy damage not only across these three counties, but also across six other northern California counties. The nine northern California counties which would be most affected by the earthquake are home to more than 270,000 employers, 3.9 million employees, and an annual payroll of $265 billion, according to data from the Quarterly Census of Employment and Wages (QCEW) published by the U.S. Bureau of Labor Statistics (BLS) in 2014.
2 Rui Chen, David Branum, and Chris J. Wills., “HAZUS Loss Estimation for California Scenario Earthquakes,” California Geological Survey, June 2009, https://www.conservation.ca.gov/cgs/Pages/Program-SHP/2009_analysis.aspx. Also see, Risk Management Solutions press release, November 8, 2008, concerning a study with losses from a magnitude-7.0 Hayward earthquake.
3 Seismic intensity is a measure of the effects of an earthquake at different sites. Intensity differs from magnitude in that the effects of any one earthquake vary greatly from place to place, so there may be many intensity values measured from one earthquake. Each earthquake, on the other hand, should have just one magnitude (often measured by the moment magnitude scale or by the Richter scale). The Modified Mercalli Intensity (MMI) Scale is commonly used to gauge the severity of earthquake effects. Intensity ratings are expressed as Roman numerals between I at the least destructive and XII at the most destructive. At MMI-VII, while damage may be slight in specially designed structures, there is often considerable damage and partial collapse even in substantial ordinary buildings.
4 The U.S. Geological Survey has published maps with a variety of Hayward earthquake scenarios, including a Hayward-Rogers Creek magnitude-7.3 earthquake. This is much recent scientific evidence that suggests that some events may trigger activity on near by Faults. When a magnitude-7.3 event is mapped against business locations, the exposure is several times greater than the more likely magnitude-6.8 earthquake chosen for this analysis. In addition, the magnitude-6.8 event is more comparable in destructive power to the magnitude-6.9 event analyzed in 2007, which provides a comparison of exposure from 2007 to present.
5 “California has failed to identify thousands of buildings vulnerable to quakes,” Los Angeles Times, March 17, 2011. http://articles.latimes.com/2011/mar/17/local/la-me-quake-buildings-20110317.
Publish Date: Thursday, October 13, 2016