An official website of the United States government
An official website of the United States government
The .gov means it's official.
Federal government websites often end in .gov or .mil. Before sharing sensitive information,
make sure you're on a federal government site.
The site is secure.
The
https:// ensures that you are connecting to the official website and that any
information you provide is encrypted and transmitted securely.

U.S. export prices experienced a major decline in 2015, as evidenced by the Bureau of Labor Statistics (BLS) export price index. Prices for U.S. exports, published in dollar terms, decreased 6.6 percent in 2015, the largest calendar-year decline since the index was first published in 1983. However, the large decline in the U.S. dollar export price index did not tell the entire story. When measured in foreign currency terms, export prices were actually higher because of the strong dollar. The value of the dollar strengthened against the euro, Japanese yen, Chinese yuan, and Canadian dollar. Continued slow global economic and trade growth dampened demand for U.S. exports and influenced U.S. export price trends. The meeting of the strong dollar and lackluster demand for U.S. exports was particularly challenging for the U.S. agricultural industry. This Beyond the Numbers article analyzes what impact the strengthening dollar had on certain agricultural commodities.
In 2015, the U.S. dollar rose nearly 12 percent over the currencies of the nation’s major global trading partners.1 From the perspective of foreign importers, the dollar’s appreciation increased the relative price of U.S. goods. For foreign buyers, the local-currency price of a U.S. product was more expensive.
As seen in chart 1, the U.S. dollar export price index diverges from the foreign currency export price index. U.S. export prices in dollar terms fell 6.6 percent from December 2014 to December 2015 while the price index for U.S. exports in foreign currency terms rose 4.2 percent. This divergence is explained by the trade-weighted U.S. dollar index. The trade-weighted U.S. dollar index is a weighted average of the foreign exchange value of the U.S. dollar against the currencies of the group of major U.S. trading partners. The foreign currency-based export price index is derived by multiplying the U.S. dollar-base price index by the trade weighted U.S. dollar index and dividing by 100. Even though export prices fell in U.S. dollar terms, they rose in foreign currency terms because the value of the U.S. dollar advanced 11.6 percent against the currencies of its main trading partners. Faced with the prospect of lower demand, and their unwillingness to jeopardize competitiveness and market share, many U.S. exporters lowered the price of their products to minimize the impact of the stronger U.S. dollar.
An example of how the stronger dollar affects the purchase price in a foreign market follows. Table 1 presents a hypothetical scenario in which the U.S. dollar price falls, but the stronger U.S. dollar—shown as the increasing number of Canadian dollars needed to purchase one U.S. dollar—increases the Canadian dollar price in subsequent periods. A buyer in Canada looking to import a U.S. refrigerator that sold for $1,000 U.S. dollars would pay C$1,150 Canadian dollars for a U.S. refrigerator in January 2015. Mid-year, the U.S. exporter reduced the sales price to $990, but the refrigerator continued to cost more in Canadian dollars ($1,227.60). By the end of the year, the U.S. dollar’s continued appreciation further increased the price in Canadian dollars—even in the face of an additional cut in the U.S. dollar price to $980. If the U.S. export price were not lowered to improve price competitiveness, the steadily appreciating U.S. dollar would have led to a 19.1-percent increase in the Canadian dollar price by the end of the year rather than a 16.7-percent advance.2 This simple example demonstrates how an appreciation of the U.S. dollar makes U.S. goods less competitive in foreign markets and influences U.S. exporters to adjust their prices.
| Date | U.S. dollar price | Exchange rate: Canadian dollar per U.S. dollar | Canadian dollar price |
|---|---|---|---|
|
Dec-14 |
$1,000.00 | 1.15 | $1,150.00 |
|
Jun-15 |
990.00 | 1.24 | 1,227.60 |
|
Dec-15 |
980.00 | 1.37 | 1,342.60 |
The continued slowdown of global trade also affected U.S. exports in 2015. Nominal exports of goods and services actually decreased and real export growth (i.e., adjusted for inflation) rose, but by less than real exports increased in 2014.3 The strong dollar contributed to the weak export outlook as U.S. goods abroad were less competitive; this impact was particularly large in agricultural commodities. The remainder of this article focuses on how these economic conditions affected U.S. agricultural export prices in 2015. For a discussion on 2015 import price trends of raw material and finished goods please see, “Impact of the strengthening dollar on U.S. import prices in 2015.”
Agricultural commodities are primary food products grown and raised on our nation’s farms, ranches and orchards. Agricultural exports decreased in value from $150 billion in 2014 to $133 billion dollars in 2015—a decline of 9 percent. Because most primary agricultural commodities are traded in U.S. dollars the world demand for agricultural products are constrained by the value of the dollar. In 2015, a dollar-driven drop in demand for U.S. agricultural goods was compounded by some commodities markets being flush with excess world supply that also put downward pressure on prices. These market conditions pushed the export price index of agricultural commodities down 12.9 percent in 2015. Grains and legumes (beans) and meat (beef, pork, and poultry) provide some of the key price stories of the year.4
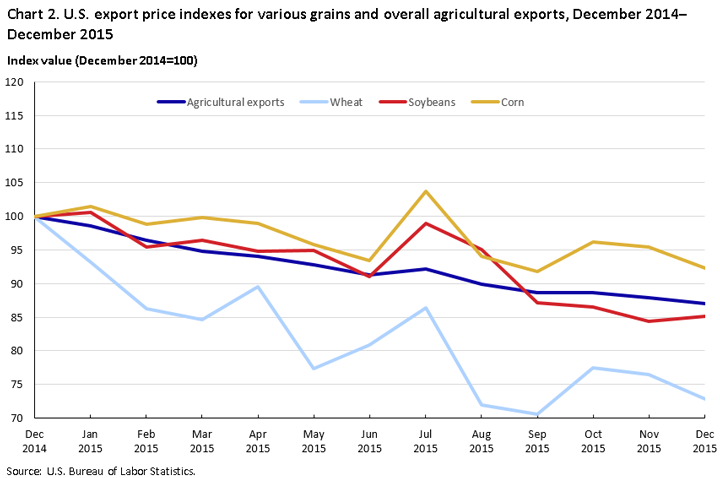
Prices for wheat, soybeans, corn, and other cereal grains responded to the coinciding plentiful harvests of 2015 and the increase in the relative strength of the dollar. As seen in chart 2, 2015 U.S. dollar export prices for wheat decreased 27.2 percent, soybean prices fell 14.9 percent, and corn prices declined 7.7 percent. In 2015, wheat production increased worldwide, but U.S. export volumes fell nearly 11 percent. The U.S. share of global wheat exports decreased from 14.3 percent in 2014 to 12.3 percent in 2015, in part because other grain exporting countries, such as Russia, Brazil, and Canada, also had successful harvests.5
Those surpluses, combined with devalued currencies, led producers in those countries to sell at lower prices than U.S. producers. Russia, in particular, took advantage of the weak ruble to overtake Canada’s position as the world’s largest exporter of wheat.6 On the demand side, China and Southeast Asia have been among the fastest growing markets for U.S. grains. However, the value of U.S. wheat exports to China decreased 17.3 percent from 2014 levels, according to data from the U.S. Census Foreign Trade Division.7 U.S. soybean and corn farmers faced similar challenges, as better-than-projected harvests competed with lower priced crops from producers in Argentina, Brazil, and Ukraine. In 2015, U.S. exporters found maintaining competitive pricing difficult in the face of saturated markets and declining foreign currencies that nudged U.S. export prices out of reach for the usual buyers.
Meat (beef, pork, and poultry) is an agricultural commodity that also had a rebound in supply just as the U.S. dollar rose in value. The export price index for meat, poultry, and other edible animal products was volatile throughout 2014 and 2015, as the livestock industry responded to waves of shortages and excess supply. By August 2014, prices for meat, poultry, and other edible animal products were 18.2 percent higher than December 2013 levels. (See chart 3.) Prices then began to fall and, by the end of 2015, were 13.0 percent below December 2013 levels. Meanwhile, the strengthening U.S. dollar put the United States at a price disadvantage on the global market and, again, U.S. exporters struggled to remain competitive. The volume of total beef exports declined 11 percent in 2015, while the value of total beef exports declined 12.0 percent.8 More starkly, exports to Japan decreased 15 percent by volume and 19 percent by value when an advantageous trade agreement between Japan and Australia pushed the United States out of a valuable beef market.9 Pork and chicken supply fluctuated in the last 2 years because of disease-related shortages. The pork industry was devastated by the porcine epidemic diarrhea virus (PEDV) in 2013–14, causing stock to fall and prices to rise. By 2015, the impact of the virus largely came to an end as sow immunity increased and herd management and virus prevention techniques were put in place. As herds recovered in 2015, supply increased and drove prices back down.10 In the poultry industry, one of the worst outbreaks of avian flu in American history hit chicken and turkey production in 2015. Demand fell as many countries banned U.S. imports of poultry, leaving a glut of chickens and a steep decline in prices.11
The U.S. dollar turned around in early 2016 as the economies of other major trading currencies improved. The 2015 decline in the U.S. dollar export index was less pronounced in the first quarter of 2016. Throughout the second quarter, the overall export price index rose as did the agricultural products price index. At the same time, the trade-weighted U.S. dollar index fell 1.4 percent below December 2015 levels by June 2016.
The agricultural export price index is more volatile than the overall export price index. Agricultural export prices see-sawed in the first quarter of 2016—decreasing 1.3 percent in January then increasing 0.7 percent in February, followed by a decrease of 2.1 percent in March. The downturn in the value of the dollar, low oil prices, and recovering global demand created an opportunity for agricultural prices to recover in the second quarter of 2016. The 3.0-percent increase of the export price index for agricultural goods in May, which was followed by a 2.5-percent rise in June, was the largest monthly advance for the index since a 4.8-percent increase in August 2012 during the heart of the drought in the United States. The trend in the third quarter of 2016 reversed; July and August export prices of agricultural goods fell 0.3 and 3.4 percent respectively. The U.S. Department of Agriculture anticipates a decline in agricultural trade export values in 2016. A combination of an uptick in the U.S. dollar and international oil prices, along with abundant global supplies of many commodities is forecast to result in more competitive prices for U.S. agricultural exports.12
This Beyond the Numbers article was prepared by Tamar Rosenstein, economist in the Division of International Prices, Office of Prices and Living Conditions, Email: Rosenstein.tamar@bls.gov, Telephone: (360)-988-2171
Upon request, the information in this article will be made available to individuals who are sensory impaired. Voice phone: (202) 691-5200. Federal Relay Service: 1-800-877-8339. This article is in the public domain and may be reproduced without permission.
Tamar Rosenstein, “Impact of the 2015 U.S. dollar rise on export prices and on the agricultural industry,” Beyond the Numbers: Global Economy, vol. 5, no. 18 (U.S. Bureau of Labor Statistics, December 2016), https://www.bls.gov/opub/btn/volume-5/impact-of-the-2015-us-dollar-rise-on-export-prices-and-on-the-agricultural-industry.htm
1 “Real trade weighted U.S. dollar index: major currencies,” Federal Reserve Bank of St. Louis, https://fred.stlouisfed.org/series/TWEXMMTH.
2 “Canada/U.S. foreign exchange rate,” Federal Reserve Bank of St. Louis, https://research.stlouisfed.org/fred2/series/EXCAUS.
3 “U.S. international trade in goods and services January 2016,” U.S. Census Bureau, March 4, 2016, https://www.census.gov/foreign-trade/Press-Release/2016pr/01/ft900.pdf.
See also, “Real exports of goods and services,” Federal Reserve Bank of St. Louis, https://fred.stlouisfed.org/series/A020RL1A158NBEA.
4 Nuts were also a major story with export agricultural prices in 2015, but that will be covered in a forthcoming article on that specific industry.
5 “Wheat data,”- World Production, Supply and Disappearance, USDA Economic Research Service, http://www.ers.usda.gov/data-products/wheat-data.aspx.
6 Georgi Kantchev and Ed Ballard, “Ground shifts under wheat export market,” The Wall Street Journal, February 7, 2016, http://www.wsj.com/articles/ground-shifts-under-wheat-export-market-1454754785.
7 “U.S. Exports to China by 5-digit end-use Code 2006-2015,” U.S. Census Bureau, https://www.census.gov/foreign-trade/statistics/product/enduse/exports/c5700.html.
See also, Gale, F., Hansen, J., and Jewison, M., “China’s growing demand for agricultural imports,” USDA Economic Research Service, June 2016, U.S. Dept. of Agriculture, http://www.ers.usda.gov/media/1784488/eib136.pdf, and “Grain: world markets and trade,” USDA Foreign Agricultural Service, https://www.fas.usda.gov/data/grain-world-markets-and-trade.
8 “U.S. pork exports solid in December; beef exports trend lower,” U.S. Meat Export Federation, http://www.usmef.org/news-statistics/press-releases/u-s-pork-exports-solid-in-December-beef-exports-trend-lower/.
9 “U.S. Exports to Japan by 5-digit End-Use Code 2006-2015,” U.S. Census Bureau, https://www.census.gov/foreign-trade/statistics/product/enduse/exports/c5880.html.
10 “PED impact on pig prices and supply – A look at 2015, 2016,” The Poultry Site Digital, January 2016, https://thepigsite.com/articles/pedv-impact-on-pig-prices-and-supply-a-look-at-2015-2016.
11 Erika Fry, “What the worst bird flu outbreak in U.S. history means for farms,” Fortune, June 25, 2015, http://fortune.com/2015/06/25/bird-flu-outbreak-farms/.
12 Jiang, H., Cooke, B., and Heerman, K., “Outlook for U.S. agricultural trade: May 2016,” USDA Economic Research Service and Foreign Agricultural Service, May 2016, http://www.ers.usda.gov/media/2093596/us-trade-outlook-aes92.pdf.
Publish Date: Tuesday, December 20, 2016