An official website of the United States government
An official website of the United States government
The .gov means it's official.
Federal government websites often end in .gov or .mil. Before sharing sensitive information,
make sure you're on a federal government site.
The site is secure.
The
https:// ensures that you are connecting to the official website and that any
information you provide is encrypted and transmitted securely.
More BLS articles about consumer expenditures are available online at the following links:
High-income household spending and the economic recovery
Spending on pets: "Tails" from the Consumer Expenditure Survey
Entertainment has long been a household budget staple. Consumer Expenditure Survey (CE) data from 1934–1936 show that, even during the Great Depression, spending on entertainment accounted for 5.4 percent of the household budget.1 In 2008, during the last recession, entertainment spending had reached an average of $2,835 per year or 5.6 percent of total household expenditures. The last recession officially ended in June 2009, and by 2013, income and spending had recovered. However, entertainment spending never returned to prerecession highs; in 2013, the average was $2,482 or 4.9 percent of total household spending.2
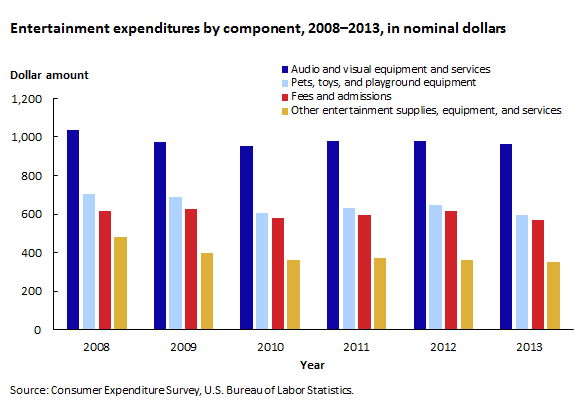
This Beyond the Numbers article examines entertainment spending from 2008 to 2013 and breaks the spending down into its four parts: fees and admissions; audio and visual equipment and services; pets, toys, hobbies, and playground equipment; and other entertainment supplies, equipment, and services.3 This article also analyzes the relationships between entertainment spending and 1) income, 2) education, and 3) age.4
Data show that
In 2008, household entertainment spending had reached a high of $2,835 (5.6 percent of total expenditures) in nominal (not adjusted for inflation) terms, before falling to $2,504 (5.2 percent of total expenditures) in 2010. Although nominal spending had increased to $2,604 (5.1 percent of total expenditures) by 2012, it declined to $2,482 (4.9 percent of total expenditures) in 2013. The components of entertainment spending also followed this pattern. The only exception was spending on fees and admissions, such as tickets to sporting events and movies, which peaked in 2009 ($628 or 1.3 percent of total expenditures). (See chart 1.)
Income is positively associated with most household expenditures. In other words, the higher the household income, the greater the dollar amount spent on goods and services in general. However, the percentage of income that a household spends on a particular category depends on the item. For example, households spend more money on food as income increases, but food makes up a smaller percentage of the household budget as income rises. In contrast, both the dollar amount and the percentage of household income spent on pensions and Social Security increase with household income. Although spending on apparel and services also increases with income, nearly all income groups spend the same percentage of their budget on this category.6
Table 1 shows spending on entertainment and its components by quintiles of pretax income (five categories of household income from the 20 percent with the lowest income to the 20 percent with the highest). The amount spent on entertainment and its components increased as income increased.7 The percentage of the household budget spent, however, varied by category. With one exception (the second 20-percent income quintile), the share of the budget spent on total entertainment increased with each income quintile. Those in the lowest income quintile spent 4.5 percent, on average, while those in the highest spent 5.2 percent. Fees and admissions and other entertainment supplies, equipment, and services increased with income quintile. The share spent on audio and visual equipment and services declined with each income quintile, from 2.4 percent among households in the lowest income quintile to 1.5 percent among households in the highest. The reason is that, while the dollar amount spent on this category increased with income quintile, total expenditures also increased so that spending represented a smaller share of the household budget.
| Item | All | Lowest 20 percent | Second 20 percent | Third 20 percent | Fourth 20 percent | Highest 20 percent |
|---|---|---|---|---|---|---|
|
Number of consumer units (in thousands) |
125,670 | 25,090 | 25,219 | 25,082 | 25,178 | 25,101 |
|
Percent of consumer units |
100.0 | 20.0 | 20.0 | 20.0 | 20.0 | 20.0 |
|
Mean pretax income |
$63,784 | $9,658 | $26,275 | $45,826 | $74,546 | $162,720 |
|
|
||||||
|
Total annual expenditures |
||||||
|
Mean |
$51,100 | $22,393 | $32,559 | $42,495 | $58,842 | $99,237 |
|
Share |
100.0 | 100.0 | 100.0 | 100.0 | 100.0 | 100.0 |
|
Total entertainment |
||||||
|
Mean |
2,482 | 1,002 | 1,416 | 1,997 | 2,866 | 5,133 |
|
Share |
4.9 | 4.5 | 4.3 | 4.7 | 4.9 | 5.2 |
|
Fees and admissions |
||||||
|
Mean |
569 | 112 | 198 | 349 | 563 | 1,625 |
|
Share |
1.1 | .5 | .6 | .8 | 1.0 | 1.6 |
|
Audio and visual equipment and services |
||||||
|
Mean |
964 | 548 | 750 | 885 | 1,149 | 1,489 |
|
Share |
1.9 | 2.4 | 2.3 | 2.1 | 2.0 | 1.5 |
|
Pets, toys, and playground equipment |
||||||
|
Mean |
596 | 286 | 367 | 527 | 777 | 1,022 |
|
Share |
1.2 | 1.3 | 1.1 | 1.2 | 1.3 | 1.0 |
|
Other entertainment supplies, equipment, and services |
||||||
|
Mean |
353 | 55 | 101 | 236 | 377 | 996 |
|
Share |
.7 | .2 | .3 | .6 | .6 | 1.0 |
|
|
||||||
|
Source: U.S. Bureau of Labor Statistics. |
||||||
Since the release of the 2012 CE data, expenditures have been classified by the highest level of education of any household member instead of the education of the reference person.8 Total annual spending on entertainment and its components rose with increasing levels of education, in large part because income generally increases with education level. (See table 2.) (The only exception was other entertainment supplies, equipment, and services; households in the bachelor’s degree category averaged $407, compared with $511 for households in the associate’s degree category.) The budget shares accounted for by entertainment and its components, however, varied by educational level. For example, the share accounted for by fees and admissions went from 0.2 percent for those with less than a high school diploma to 1.8 percent for those in the master’s, professional, doctoral degree category. The share of the household budget spent on audio and visual equipment and services declined as education increased. Other entertainment supplies, equipment, and services claimed an increasing share of the budget for those with less than a college education; spending decreased for those with a college degree. There was no discernable pattern for spending on pets, toys, and playground equipment. The share of spending on total entertainment went from 4.1 percent for those with less than a high school education to 5.2 percent for those with an associate’s degree; it was 4.9 percent and 5.1 percent, respectively, for those with a bachelor’s degree and those in the master’s, professional, doctoral degree category.
| Item | All | Less than college graduate | College graduate | ||||||
|---|---|---|---|---|---|---|---|---|---|
| Total | Less than high school graduate | High school graduate | High school graduate with some college | Associate's degree | Total | Bachelor's degree | Master's, professional, doctoral degree | ||
|
Number of consumer units (in thousands) |
123,286 | 76,861 | 10,807 | 26,368 | 25,685 | 14,002 | 46,425 | 27,901 | 18,523 |
|
Percent of consumer units |
100.0 | 62.3 | 8.8 | 21.4 | 20.8 | 11.4 | 37.7 | 22.6 | 15.0 |
|
Mean pretax income |
$63,784 | $43,135 | $24,078 | $38,064 | $45,440 | $61,369 | $96,564 | $80,844 | $118,987 |
|
|
|||||||||
|
Total annual expenditures |
|||||||||
|
Mean |
$51,100 | $38,630 | $25,971 | $34,385 | $41,203 | $50,842 | $70,774 | $63,165 | $81,645 |
|
Share |
100.0 | 100.0 | 100.0 | 100.0 | 100.0 | 100.0 | 100.0 | 100.0 | 100.0 |
|
Total entertainment |
|||||||||
|
Mean |
2,482 | 1,817 | 1,065 | 1,530 | 1,965 | 2,636 | 3,528 | 3,089 | 4,158 |
|
Share |
4.9 | 4.7 | 4.1 | 4.4 | 4.8 | 5.2 | 5.0 | 4.9 | 5.1 |
|
Fees and admissions |
|||||||||
|
Mean |
569 | 247 | 61 | 168 | 305 | 419 | 1,078 | 802 | 1,472 |
|
Share |
1.1 | .6 | .2 | .5 | .7 | .8 | 1.5 | 1.3 | 1.8 |
|
Audio and visual equipment and services |
|||||||||
|
Mean |
964 | 837 | 560 | 821 | 850 | 1,037 | 1,165 | 1,106 | 1,251 |
|
Share |
1.9 | 2.2 | 2.2 | 2.4 | 2.1 | 2.0 | 1.6 | 1.8 | 1.5 |
|
Pets, toys, and playground equipment |
|||||||||
|
Mean |
596 | 459 | 352 | 403 | 457 | 669 | 807 | 774 | 855 |
|
Share |
1.2 | 1.2 | 1.4 | 1.2 | 1.1 | 1.3 | 1.1 | 1.2 | 1.0 |
|
Other entertainment supplies, equipment, and services |
|||||||||
|
Mean |
353 | 273 | 92 | 138 | 352 | 511 | 478 | 407 | 580 |
|
Share |
.7 | .7 | .4 | .4 | .9 | 1.0 | .7 | .6 | .7 |
|
Source: U.S. Bureau of Labor Statistics. |
|||||||||
Other researchers using CE data have found a positive association between education and entertainment spending, even after the effects of income and other factors have been taken into account.9 The analysis in this article did not examine whether education exerts a separate effect on spending when income and other factors have been taken into account.
Household pretax income and total spending increased with each age category, from those under 25 years old to those in the 45–54 years category, and then declined for those 55 and older. This pattern also existed for expenditures on total entertainment and for audio and visual equipment and services. For fees and admissions and for other entertainment supplies, equipment, and services, spending increased with age up to the 45–54 years category and declined with the 55–64 years category. Spending rose again with the 65–74 years category, before declining with the 75 years and older category. Spending on audio and visual equipment and services peaked at the 35–44 years category.
The shares of the household budget spent on entertainment and its components followed no consistent pattern. For example, the share of spending on total entertainment was highest (5.3 percent) for those 65–74 years old and lowest (4.1 percent) for those under 25 years and older than 75 years. For audio and visual equipment and services, budget shares varied little (1.8 to 2.1 percent) with age category. (See table 3.)
| Item | All | Under 25 years | 25–34 years | 35–44 years | 45–54 years | 55–64 years | 65–74 years | 75 years and older |
|---|---|---|---|---|---|---|---|---|
|
Number of consumer units (in thousands) |
125,670 | 8,275 | 20,707 | 21,257 | 24,501 | 22,887 | 16,024 | 12,018 |
|
Percent of consumer units |
100.0 | 6.6 | 16.5 | 16.9 | 19.5 | 18.2 | 12.8 | 9.6 |
|
Mean age of reference person |
50.1 | 21.6 | 29.8 | 39.7 | 49.7 | 59.2 | 68.8 | 81.6 |
|
Mean pretax income |
$63,784 | $27,914 | $59,002 | $78,385 | $78,879 | $74,182 | $53,451 | $34,097 |
|
|
||||||||
|
Total annual expenditures |
||||||||
|
Mean |
$51,100 | $30,373 | $48,087 | $58,784 | $60,524 | $55,892 | $46,757 | $34,382 |
|
Share |
100.0 | 100.0 | 100.0 | 100.0 | 100.0 | 100.0 | 100.0 | 100.0 |
|
Total entertainment |
||||||||
|
Mean |
2,482 | 1,243 | 2,214 | 2,958 | 3,070 | 2,651 | 2,488 | 1,422 |
|
Share |
4.9 | 4.1 | 4.6 | 5.0 | 5.1 | 4.7 | 5.3 | 4.1 |
|
Fees and admissions |
||||||||
|
Mean |
569 | 245 | 498 | 736 | 747 | 551 | 579 | 276 |
|
Share |
1.1 | .8 | 1.0 | 1.3 | 1.2 | 1.0 | 1.2 | .8 |
|
Audio and visual equipment and services |
||||||||
|
Mean |
964 | 576 | 899 | 1,139 | 1,064 | 1,021 | 961 | 723 |
|
Share |
1.9 | 1.9 | 1.9 | 1.9 | 1.8 | 1.8 | 2.1 | 2.1 |
|
Pets, toys, and playground equipment |
||||||||
|
Mean |
596 | 243 | 533 | 638 | 728 | 780 | 580 | 282 |
|
Share |
1.2 | .8 | 1.1 | 1.1 | 1.2 | 1.4 | 1.2 | .8 |
|
Other entertainment supplies, equipment, and services |
||||||||
|
Mean |
353 | 179 | 284 | 446 | 531 | 299 | 369 | 141 |
|
Share |
.7 | .6 | .6 | .8 | .9 | .5 | .8 | .4 |
|
Source: U.S. Bureau of Labor Statistics. |
||||||||
Existing studies using CE data suggest that as age increases, spending on entertainment decreases, other factors being equal. One reason is that limited mobility among members of older households would likely reduce spending on activities such as live sporting events and theater performances. Another reason is that older households would be more likely than young households to own items such as boats, radios, and hobby equipment.10
The dollar amount spent on entertainment and its components increased with both household pretax income and the highest education level attained by any household member.
The dollar amount spent on entertainment and its components generally increased with age up to 45–54 and then declined, mirroring the pattern of pretax income associated with the age categories.
CE data show that household pretax income and total expenditures were higher in 2013, in nominal terms, than those at the start of the last recession. Entertainment spending, however, was lower: $2,482 in 2013 compared with $2,835 in 2008. Households may have cut back on entertainment spending to pay for increased costs for items such as healthcare and transportation.11 Declining entertainment spending might reflect the aging of the population; in 2011, the oldest of the baby-boom generation turned 66, the full retirement age for Social Security.
This Beyond the Numbers article was prepared by Ann C. Foster, economist in the Office of Prices and Living Conditions, Bureau of Labor Statistics. Email: foster.ann@bls.gov, telephone: (202) 691-5174.
Information in this article will be made available to sensory-impaired individuals upon request. Voice phone: (202) 691-5200. Federal Relay Service: 1-800-877-8339. This article is in the public domain and may be reproduced without permission.
Ann C. Foster, “Movies, music, and sports: U.S. entertainment spending, 2008–2013,” Beyond the Numbers: Prices & Spending, vol. 4, no. 6 (U.S. Bureau of Labor Statistics, March 2015), https://www.bls.gov/opub/btn/volume-4/movies-music-sports-entertainment-spending.htm
1 See 100 Years of Consumer Spending: Data for the Nation, New York City, and Boston (May 2006, U.S. Bureau of Labor Statistics), https://www.bls.gov/opub/uscs/report991.pdf.
2 On September 20, 2010, the National Bureau of Economic Research determined that a trough in business activity occurred in the U.S. economy in June 2009, marking the end of the recession that began in December 2007 and the beginning of an expansion. For more information, see “U.S. Business Cycle Expansions and Contractions,” (April 2012, National Bureau of Economic Research), http://www.nber.org/cycles/cyclesmain.html.
3 For a more detailed description of these components, see the Consumer Expenditure Survey Glossary (October 2014, U.S. Bureau of Labor Statistics), www.bls.gov/cex/csxgloss.htm. Spending on reading materials such as newspapers, books, and magazines is a separate CE category and is not included in this analysis.
4 Data from the 2000 CE were used in an earlier study of entertainment spending by consumer units classified by income, age, and education. Both average and aggregate data were examined. For more information, see Neil Tseng, “Expenditures on Entertainment,” Consumer Expenditure Survey Anthology, 2003 (September 2003, U.S. Bureau of Labor Statistics), pp. 73–77, https://www.bls.gov/cex/anthology/csxanth10.pdf.
5 The reference person is the first household member mentioned by the CE respondent when asked to “Start with the name of the person, or one of the persons, who owns or rents the home.” It is with respect to this person that the relationship of the other consumer unit members is determined. For more information, see BLS Handbook of Methods, Chapter 16,” Consumer Expenditures and Income,” https://www.bls.gov/opub/hom/pdf/homch16.pdf.
6 See table 1101, Quintiles of income before taxes: Annual expenditure means, shares, standard errors, and coefficient of variation, Consumer Expenditure Survey, 2013, https://www.bls.gov/cex/2013/combined/quintile.pdf.
7 Other studies using CE data have found a positive association between income and entertainment expenditures, even after the effects of other factors have been taken into consideration. See Gao Liping, Hyeongwoo Kim, and Yaoqi Zhang, “On the Effect of the Great Recession on U.S. Household Expenditures for Entertainment,” Auburn University Department of Economics Working Paper Series (AUWP 2013-09), August 2013, http://cla.auburn.edu/econwp/Archives/2013/2013-09.pdf and Rachel Dardis, Horacio Soberon-Ferrer, and Dilip Patro, “Analysis of Leisure Expenditures in the United States,” Journal of Leisure Research, vol. 26, no.4, October 1994, pp. 309–321.
8 For a more detailed explanation of this classification change, see Ann C. Foster, “ New education classification better reflects income and spending patterns in the Consumer Expenditure Survey,” Beyond the Numbers: Prices and Spending, vol. 3, no. 1 (Bureau of Labor Statistics, January 2014), https://www.bls.gov/opub/btn/volume-3/pdf/education-classification-and-income-and-spending-patterns.pdf.
9 See Robert O. Weagley and Eunjeong Huh, “The Impact of Retirement on Household Leisure Expenditures,” Journal of Consumer Affairs, vol. 38, no. 2, Winter 2004, pp. 262–281, http://pfp.missouri.edu/documents/research/weagley_theimpact.pdf, and Rachel Dardis, Horacio Soberon-Ferrer, and Dilip Patro, “Analysis of Leisure Expenditures in the United States,” Journal of Leisure Research, vol. 26, no. 4, October 1994, pp. 309–321.
10 See Rachel Dardis, Horacio Soberon-Ferrer, and Dilip Patro, “Analysis of Leisure Expenditures in the United States,” Journal of Leisure Research, vol. 26, no. 4, October 1994, pp. 309–321, and Sheila Mammen and Ann C. Foster, “Factors Affecting Household Expenditures for Entertainment Services,” Consumer Interests Annual, 1992, pp. 96–97, http://www.consumerinterests.org/cia1992.
11 In 2013, the average household spent $3,631 on healthcare (7.1 percent of total expenditures) compared with $2,976 (5.9 percent of total expenditures) in 2008. Similarly, transportation spending was $9,004 (17.6 percent of total expenditures) in 2013, compared with $8,604 (17 percent of total expenditures) in 2008. For more information, see Annual Calendar Year Tables, https://www.bls.gov/cex/#tables.
Publish Date: Wednesday, March 25, 2015