An official website of the United States government
An official website of the United States government
The .gov means it's official.
Federal government websites often end in .gov or .mil. Before sharing sensitive information,
make sure you're on a federal government site.
The site is secure.
The
https:// ensures that you are connecting to the official website and that any
information you provide is encrypted and transmitted securely.

More BLS information about age and spending:
Consumer spending by age group in 2013
Movies, Music, And Sports: U.S. Entertainment Spending, 2008–2013
The Consumer Expenditure Survey (CE) publishes information classified by characteristics such as income, household size, and age of the reference person.1 This article uses 2013 CE data to examine the relationship between age and consumer expenditures. This relationship is important because the aging of the baby-boom generation will influence the overall level and composition of consumer spending in the years to come.2
Data show that:
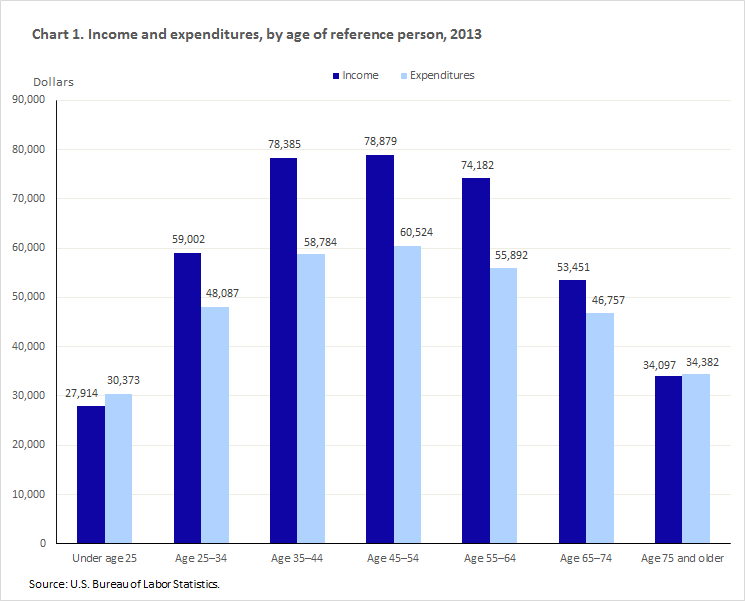
In 2013, pretax household income rose from $27,914 for the under-25 age group to $78,385 for the 35–44 age group and $78,879 for the 45–54 age group and then steadily declined to $34,097 for the 75-and-older group. Total annual expenditures followed the same pattern, increasing from $30,373 for the under-25 group to $58,784 for the 35–44 age group and $60,524 for the 45–54 age group and then declining to $34,382 for the 75-and-over group. The differences in pretax income and in total expenditures were not statistically significant between the 35–44 group and the 45–54 group.
When examining major consumption categories, however, not all follow the life cycle pattern mentioned above.
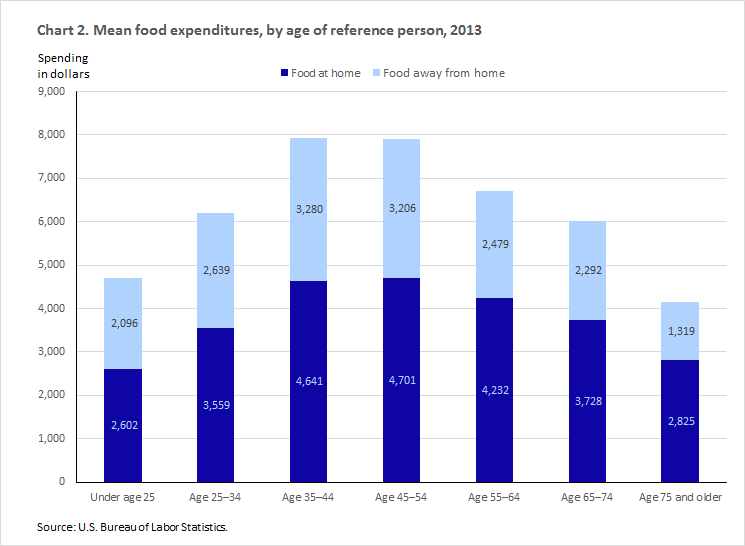
Food spending went from $4,698 for the under-25 group to about $7,900 for both the 35–44 and 45–54 years groups and then declined to $4,144 for the 75 years and older group (see table 2). The components of food spending (food at home and food away from home) also followed a similar pattern. For the 35–44 years and 45–54 years groups, however, the difference in the amounts spent for total food, food at home, and food away from home was not statistically significant.
The share of the food dollar spent on food at home increased with the age of the reference person, from 55.4 percent for the under-25 age group to 68.2 percent for the 75-and-older group, while the share devoted to food away from home decreased from 44.6 percent for the under-25 group to 31.8 percent for the 75-and-older group. The only exception was the 65–74 age group, where the share of the food dollar devoted to food at home was slightly lower and the share of the food dollar devoted to food away from home was slightly higher than those for the 55–64 years group. (See chart 2).
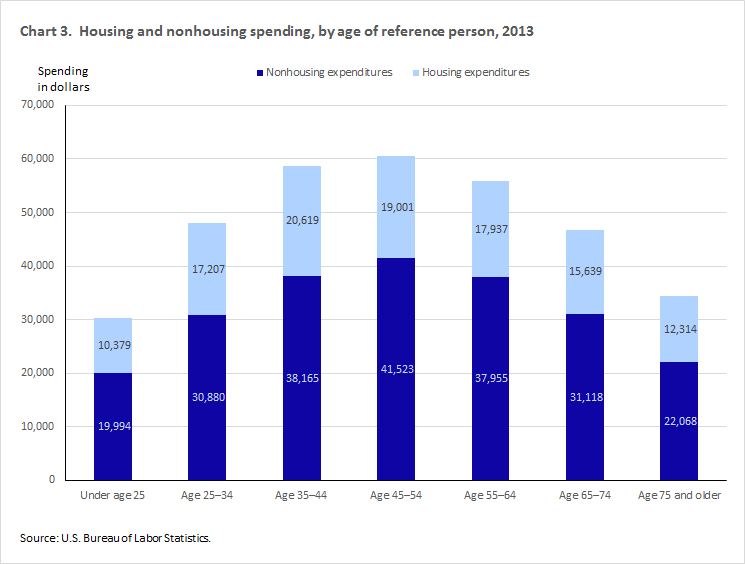
Housing outlays did not strictly follow the hump-shaped pattern previously described. Spending increased from $10,379 for the under-25 age group and peaked earlier in the life cycle at $20,619 for the 35–44 age group, and then became rather flat until it reached $12,314 for the 75-and-older group. Nonhousing outlays (total expenditures less housing expenditures) did follow the hump-shaped pattern. Previous research using CE data also found this pattern, even after the effects of other factors were taken into account (See chart 3).4
For the under-25 age group, the average amount spent on clothing was not statistically different from the amount spent by the 25–34 age group—$1,513 and $1,832, respectively. While the greatest amount spent on clothing was $1,960 for the 35–44 age group, this amount was not statistically different from the $1,832 for the 25–34 age group and the $1,826 for the 45–54 age group. Spending, however, declined to $1,563 for the 55–64 years group to $1,222 for the 65–74 years group to $768 for the 75 years and older group. These differences were statistically different.
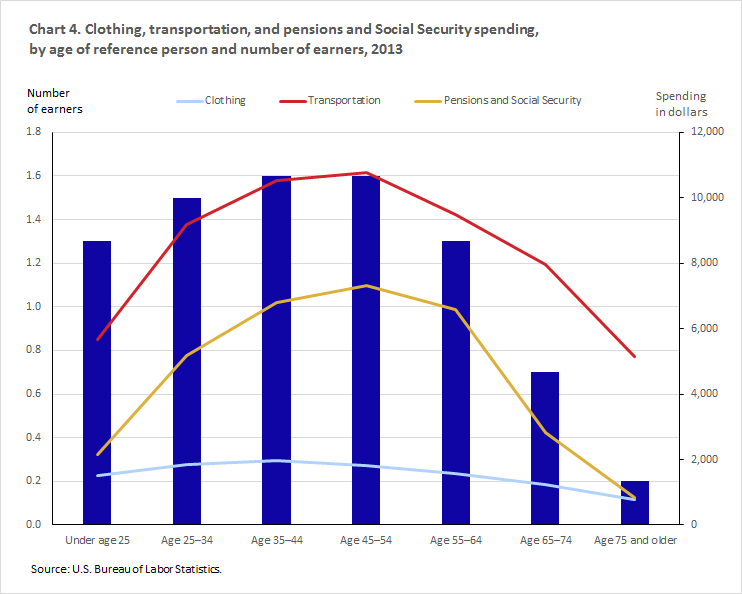
Clothing is often considered a work-related expense that should decrease when household members retire. Households with a reference person 65–74 years and 75 years and older had the fewest earners (0.7 and 0.2, respectively). This could be one reason why they spent the least on clothing ($1,222 and $768) and why clothing accounted for the lowest share of the budget (2.6 percent and 2.2 percent) of all groups (See table 2 and chart 4). Previous research using CE data has found that even after controlling for the effects of income, family size, and other factors, age was negatively associated with spending on clothing. Being retired exerted a negative effect on clothing expenditures distinct from age.5
In 2013, transportation spending averaged $5,672 for the under-25 age group. Spending increased to $10,519 for the 35–54 age group, an amount not statistically different from the $10,782 spent by the 45-54 age group. Spending declined from $9,482 for the 55–64 age group to $5,149 for the 75-and-older group. Although 87 percent of all households owned at least one vehicle, only 67 percent of the under-25 group owned at least one vehicle, compared with 78 percent of the 75-and-older age group. Vehicle ownership among the remaining groups narrowly ranged from 88 percent to 91 percent. Transportation’s share of the household budget was lowest (15 percent) for the 75-and-older group and ranged from 17 percent to 19 percent for the remaining groups. Because transportation, like clothing, is considered a work-related expense, spending should be expected to decrease with age of the reference person and the accompanying decline in number of earners per household. This pattern may be seen in chart 4.6
Out-of-pocket healthcare spending increased with the age of the reference person from $943 for the under-25 age group to $5,188 for the 65–74 age group. The $4,910 spent by the 75-and-older group was not statistically different from the amount spent by the 65–74 group. Healthcare’s share of the household budget increased with age from 3.1 percent for the under-25 group to 14.3 percent for the 75-and-older group. Previous research using CE data from the 1998, 2003, and 2008 Interview Surveys also found a positive association between healthcare spending and age among households with healthcare expenses.7
Because the CE does not sample the institutionalized population, most household spending on nursing home care is not included. Data from the National Health Expenditure Accounts (NHEA), which include the institutionalized population, show that in 2013, household out-of- pocket spending accounted for 29.4 percent ($45.8 billion) of the $155.8 billion spent on nursing home care. If the institutionalized population were included in the CE, it is likely that healthcare spending for the 65–74 and 75-and-older age groups would be much higher and claim a greater share of the budget compared with younger age groups.8
Entertainment spending averaged $1,243 for the under-25 age group. Spending increased to $2,958 for the 35–44 age group, an amount not statistically different from the $3,070 spent by the 45–54 age group. Spending declined to $2,651 for the 55–64 age group, an amount not statistically different from the $2,488 spent by the 65–74 age group. The $1,422 spent by the 75-and-older group was statistically different from the amounts spent by the other age groups. The share of the household budget accounted for by entertainment spending followed no consistent pattern. The budget share claimed by entertainment was highest (5.3 percent) for the 65–74 age category and lowest (4.1 percent) for the under-25 and the 75-and-older categories.9 Existing studies using CE data indicate that the age of the reference person, other factors being equal, is negatively associated with entertainment spending.10
Outlays on pensions and Social Security steadily increased in dollar amount and as a share of total expenditures from the under-25 age group ($2,153 and 7.1 percent) to the 45–54 group ($7,305 and 12.1 percent), gradually declining to ($6,593 and 11.8 percent) for the 55–64 age group. This was followed by a sharp declines for the 65–74 group ($2,833 and 6.1 percent) and 75-and-older group, ($832 and 2.4 percent). These findings mirror the number of earners per household in each age group, which went from 1.1 in the under-25 age category to 1.6 in the 35–44 and 45–54 age categories, before declining from 1.3 for the 55–64 age category to .7 and .2 for the 65–74 and 75-and-older categories, respectively. Households with a reference person 65–74 and 75 and older are more likely to have retired members who are collecting pension and Social Security benefits rather than making contributions. (See chart 4).11
The amount spent on other expenses12 followed the typical hump-shaped pattern, increasing from $3,371 for the under-25 age group to $6,833 for the 45–54 group and then declining to $4,844 for the 75-and-older group. The share of the budget accounted for by this category followed no distinct pattern.
Total annual average household expenditures and associated income increased with the age of the reference person from the under-25 age group to the 35–44 group, which was not statistically different from the 45–54 group. Annual spending and income then declined with age of the reference person for the remaining groups. Household size also increased with age of the reference person from 2.0 persons for the under-25 age group to 3.4 for the 35–44 age group and then declined to 1.6 persons for the 75-and-older group. Larger households, other factors being equal, would need to spend more for most goods and services compared with smaller households.
With one exception, the share of the food budget devoted to food at home increased with age while the share devoted to food away from home declined.
Spending on clothing, transportation, and pensions and Social Security was lower in dollar amount and as a share of the household budget, for households with a reference person 65–74 years and 75 years and older compared with the sample as a whole. Older households had the fewest earners (0.7 for those with a reference person 65–74 years old and 0.2 for households with a reference person 75 and older, compared with 1.3 for the sample as a whole), indicating that spending on the three categories are largely work-related and decreases when household members retire.
Healthcare was the only expenditure that increased, in both dollar amount and as a share of the household budget, with the age of the reference person.
| Item | All | Age | ||||||
|---|---|---|---|---|---|---|---|---|
| Under 25 | 25–34 | 35–44 | 45–54 | 55–64 | 65–74 | 75 and older | ||
|
Number of consumer units (in thousands) |
125,670 | 8,275 | 20,707 | 21,257 | 24,501 | 22,887 | 16,024 | 12,018 |
|
Percent of consumer units |
100.0 | 6.6 | 16.5 | 16.9 | 19.5 | 18.2 | 12.8 | 9.6 |
|
Consumer unit characteristics: |
||||||||
|
Pretax income |
$63,784 | $27,914 | $59,002 | $78,385 | $78,879 | $74,182 | $53,451 | $34,097 |
|
Age of reference person |
50.1 | 21.6 | 29.8 | 39.7 | 49.7 | 59.2 | 68.8 | 81.6 |
|
Average number in consumer unit: |
||||||||
|
Persons |
2.5 | 2.0 | 2.8 | 3.4 | 2.7 | 2.1 | 1.9 | 1.6 |
|
Children under 18 |
.6 | .4 | 1.1 | 1.4 | .6 | .2 | .1 | (a) |
|
Persons 65 and older |
.3 | (a) | (a) | (a) | .1 | .1 | 1.4 | 1.3 |
|
Earners |
1.3 | 1.3 | 1.5 | 1.6 | 1.6 | 1.3 | .7 | .2 |
|
Vehicles |
1.9 | 1.1 | 1.6 | 2.0 | 2.2 | 2.2 | 1.9 | 1.3 |
|
Percent distribution: |
||||||||
|
Sex of reference person: |
||||||||
|
Male |
47 | 53 | 47 | 45 | 48 | 50 | 50 | 39 |
|
Female |
53 | 47 | 53 | 55 | 52 | 50 | 50 | 61 |
|
Race of reference person: |
||||||||
|
Black or African American |
13 | 13 | 13 | 14 | 14 | 12 | 10 | 8 |
|
White, Asian, and all other races |
87 | 87 | 87 | 86 | 86 | 88 | 90 | 92 |
|
Hispanic or Latino origin of reference person: |
||||||||
|
Hispanic or Latino |
13 | 17 | 19 | 19 | 12 | 8 | 7 | 5 |
|
Not Hispanic or Latino |
87 | 83 | 81 | 81 | 88 | 92 | 93 | 95 |
|
Education of reference person: |
||||||||
|
Elementary (1-8) |
7 | 3 | 5 | 6 | 6 | 6 | 7 | 14 |
|
High school (9-12) |
30 | 30 | 25 | 28 | 31 | 29 | 35 | 39 |
|
College |
63 | 67 | 70 | 66 | 63 | 64 | 58 | 46 |
|
Never attended and other |
(a) | (a) | (a) | (a) | (a) | (a) | (a) | (a) |
|
Housing tenure: |
||||||||
|
Homeowner |
64 | 14 | 40 | 62 | 69 | 79 | 82 | 79 |
|
With mortgage |
37 | 7 | 33 | 51 | 50 | 43 | 32 | 12 |
|
Without mortgage |
26 | 7 | 7 | 11 | 19 | 36 | 50 | 67 |
|
Renter |
36 | 86 | 60 | 38 | 31 | 21 | 18 | 21 |
|
At least one vehicle owned or leased |
87 | 67 | 88 | 91 | 89 | 91 | 90 | 78 |
|
(a) Value is too small to display. Source: U.S. Bureau of Labor Statistics. |
||||||||
| Item | All | Age | |||||||
|---|---|---|---|---|---|---|---|---|---|
| Under 25 | 25–34 | 35–44 | 45–54 | 55–64 | 65–74 | 75 and older | |||
|
Total annual expenditures |
$51,100 | $30,373 | $48,087 | $58,784 | $60,524 | $55,892 | $46,757 | $34,382 | |
|
Food |
|||||||||
|
Mean |
6,602 | 4,698 | 6,197 | 7,920 | 7,907 | 6,711 | 6,020 | 4,144 | |
|
Share |
12.9 | 15.5 | 12.9 | 13.5 | 13.1 | 12.0 | 12.9 | 12.1 | |
|
Food at home |
|||||||||
|
Mean |
3,977 | 2,602 | 3,559 | 4,641 | 4,701 | 4,232 | 3,728 | 2,825 | |
|
Share |
7.8 | 8.6 | 7.4 | 7.9 | 7.8 | 7.6 | 8.0 | 8.2 | |
|
Food away from home |
|||||||||
|
Mean |
2,625 | 2,096 | 2,639 | 3,280 | 3,206 | 2,479 | 2,292 | 1,319 | |
|
Share |
5.1 | 6.9 | 5.5 | 5.6 | 5.3 | 4.4 | 4.9 | 3.8 | |
|
Housing |
|||||||||
|
Mean |
17,148 | 10,379 | 17,207 | 20,619 | 19,001 | 17,937 | 15,639 | 12,314 | |
|
Share |
33.6 | 34.2 | 35.8 | 35.1 | 31.4 | 32.1 | 33.4 | 35.9 | |
|
Clothing |
|||||||||
|
Mean |
1,604 | 1,513 | 1,832 | 1,960 | 1,826 | 1,563 | 1,222 | 768 | |
|
Share |
3.1 | 5.0 | 3.8 | 3.3 | 3.0 | 2.8 | 2.6 | 2.2 | |
|
Transportation |
|||||||||
|
Mean |
9,004 | 5,672 | 9,183 | 10,519 | 10,782 | 9,482 | 7,972 | 5,149 | |
|
Share |
17.6 | 18.7 | 19.1 | 17.9 | 17.8 | 17.0 | 17.0 | 15.0 | |
|
Healthcare |
|||||||||
|
Mean |
3,631 | 943 | 2,189 | 3,188 | 3,801 | 4,378 | 5,188 | 4,910 | |
|
Share |
7.1 | 3.1 | 4.6 | 5.4 | 6.3 | 7.8 | 11.1 | 14.3 | |
|
Entertainment |
|||||||||
|
Mean |
2,482 | 1,243 | 2,214 | 2,958 | 3,070 | 2,651 | 2,488 | 1,422 | |
|
Share |
4.9 | 4.1 | 4.6 | 5.0 | 5.1 | 4.7 | 5.3 | 4.1 | |
|
Pensions and Social Security |
|||||||||
|
Mean |
5,209 | 2,153 | 5,178 | 6,791 | 7,305 | 6,593 | 2,833 | 832 | |
|
Share |
10.2 | 7.1 | 10.8 | 11.6 | 12.1 | 11.8 | 6.1 | 2.4 | |
|
Other1 |
|||||||||
|
Mean |
5,421 | 3,771 | 4,087 | 4,827 | 6,833 | 6,577 | 5,394 | 4,844 | |
|
Share |
10.6 | 12.4 | 8.5 | 8.2 | 11.3 | 11.8 | 11.5 | 14.1 | |
|
1Includes cash contributions, alcohol, tobacco, personal care products and services, reading, education, life and personal insurance, and miscellaneous expenses. Source: U.S. Bureau of Labor Statistics. |
|||||||||
This Beyond the Numbers article was prepared by Ann C. Foster, an economist in the Office of Prices and Living Conditions, Bureau of Labor Statistics. Email: foster.ann@bls.gov, telephone: (202) 691-5174.
Information in this article will be made available to sensory-impaired individuals upon request. Voice phone: (202) 691-5200. Federal Relay Service: 1-800-877-8339. This article is in the public domain and may be reproduced without permission.
Ann C. Foster, “Consumer expenditures vary by age ,” Beyond the Numbers: Prices & Spending, vol. 4, no. 14 (U.S. Bureau of Labor Statistics, December 2015), https://www.bls.gov/opub/btn/volume-4/consumer-expenditures-vary-by-age.htm
1In the Consumer Expenditure Survey (CE), the consumer unit is the entity on which expenditure reports are collected. Consumer units include families, single persons living alone or sharing a household with others but who are financially independent, or two or more persons living together who share expenses. While "consumer unit" is the proper technical term for the purposes of the CE, it is often used interchangeably with "household" or "family" for convenience. This article will use "household" instead of "consumer unit." The reference person is the first household member mentioned by the CE respondent when asked to “Start with the name of the person, or one of the persons, who owns or rents the home.” It is with respect to this person that the relationship of the other consumer unit members is determined. For more information, see BLS Handbook of Methods, Chapter 16, ”Consumer Expenditures and Income,” https://www.bls.gov/opub/hom/pdf/homch16.pdf.
2The Census Bureau projects that the share of the U.S. resident population 65 years and over will grow from 14.88 percent in 2015 to 20.62 percent in 2030 to 23.55 percent in 2060. For more information, see table 6 of Percent Distribution of the Projected Population by Sex and Selected Age Groups for the United States: 2015 to 2060, U.S. Census Bureau, “2014 National Population Projections,” December 18, 2014, https://www.census.gov/population/projections/data/national/2014.html. The resident population includes all persons, both military and civilian, living in the United States. The CE is designed to represent the slightly smaller U.S. civilian noninstitutional population and excludes those living in an institution, such as a nursing home or prison, and active-duty members of the U.S. Armed Forces living on base. For more information, see “Population Estimates Terms and Definitions,” U.S. Census Bureau, https://www.census.gov/popest/about/terms.html
3 Expenditures were greater than pretax income for the under-25 and 75-and-older groups, which is not uncommon for lower-income groups. CE data show that in 2013, expenditures exceeded pretax income for households with average pretax income of less than $35,000. Many households in the under-25 age group probably have one or more students who use loans to help pay expenses while they are in school. The 75-and-older group have the fewest earners (0.2 compared with 1.3 for households of all ages) and may be liquidating savings and investments to pay for consumption expenditures. For more information, see Frequently Asked Questions (FAQs), https://www.bls.gov/cex/csxfaqs.htm#q21 and Table 1202. Income before taxes: Annual expenditure means, shares, standard errors, and coefficient of variation, Consumer Expenditure Survey, 2013, https://www.bls.gov/cex/2013/combined/income.pdf
4See Fang Yang, “Consumption over the Life Cycle: How Different is Housing?,” Working Paper 635 (Revised August 2006), Federal Reserve Bank of Minneapolis, https://www.minneapolisfed.org/research/wp/wp635.pdf The non-hump-shaped housing expenditure pattern is the result of several factors. The under-25 age group has the lowest housing expenditures, reflecting the fact that most households (86 percent) in this group rent their dwellings. The incidence of homeownership and housing costs increase rapidly for the 25–34 and the 35-44 age groups before reaching a plateau at the 45–54 age group. The increasing housing outlays reflect furnishing and appliance costs as well as mortgage and increased utility costs. These groups have the largest number of persons per household which also adds to housing costs. For the 65–74 and 75-and-older age groups, housing expenditures remain high because around 82 percent and 79 percent, respectively, are homeowners. Although the majority of homeowners in these groups are without a mortgage, 39 percent of homeowners in the 65–74 age group and 15 percent of homeowners in the 75-and-older group are still making mortgage payments. It is also possible that many homeowners in these groups are in the dwellings occupied when their household size was larger, adding to maintenance, utility, and property tax costs relative to current income and household size.
5Research using the 1972–73 CE found that age of the household head (the husband in husband-wife families) was negatively associated with clothing expenditures, once the effects of income and other factors were taken into account. Households where the head was retired spent less on clothing compared with households where the head was in the craftsmen category, even after the effects of income and other factors were taken into account. For more information, see Rachel Dardis, Frederick Derrick, and Alane Lehfeld, “Clothing Demand in the United States: A Cross-Sectional Analysis,” Home Economics Research Journal, December, 1981, vol. 10, no. 2, pp. 212–222.
6Previous research using CE data and American Time Use Survey (ATUS) data found that, after controlling for the effects of other factors, both time spent traveling to and from work and transportation costs began to decline when individuals were in their early 50s. See Mark Aguiar and Erik Hurst, “Deconstructing Life Cycle Expenditure,” February 2013, https://scholar.princeton.edu/sites/default/files/670740_0.pdf.
7See Ann C. Foster and Craig J. Kreisler, "Health care spending patterns of U.S. consumers, by age, 1998, 2003, and 2008,” Consumer Expenditure Survey Anthology, 2011, July 2011, pp. 22–28, https://www.bls.gov/cex/anthology11/csxanth4.pdf. NHEA data, disaggregated by age, also found that average healthcare spending increased with age. For more information, see David Lassman, Micah Hartman, Benjamin Washington, Kimberly Andrews, and Aaron Catlin, “U.S. Health Spending Trends by Age and Gender: Selected Years, 2002-10,” Health Affairs, vol. 33, no. 35, May 2014, pp. 815–822.
8For more information, see Centers for Medicare & Medicaid Services, Table 15 Nursing Care Facilities and Continuing Care Retirement Communities Expenditures; Levels, Percent Change, and Percent Distribution, by Source of Funds: Selected Calendar Years 1970–2013, NHE Tables, http://www.cms.gov/Research-Statistics-Data-and-Systems/Statistics-Trends-and-Reports/NationalHealthExpendData/NationalHealthAccountsHistorical.html. When the Centers for Medicare & Medicaid Services publish NHEA data for subsequent years, data from previous years are often revised. The NHEA data cited in this endnote are those released with the 2013 estimates on December 9, 2014. Unpublished CE data for 2013 show that CE respondents spent 2.2 billion on nursing home care. Spending by households with a reference person 65 and older averaged $15.08 compared with $17.26 for the sample as a whole and $17.89 for households with a reference person younger than 65.
9For a more detailed analysis of entertainment expenditures in 2013, see Ann C. Foster, Movies, music, and sports: U.S. entertainment spending, 2008–2013,” Beyond the Numbers: Prices and Spending, vol. 4, no. 6 (U.S. Bureau of Labor Statistics, March 2015), https://www.bls.gov/opub/btn/volume-4/movies-music-sports-entertainment-spending.htm.
10One explanation is that older households are less apt than younger households to participate in activities that require physical effort, such as cycling, jogging, and camping. Also, limited mobility among members of older households would likely reduce spending on attendance at sporting events and theater performances. For more information, see Rachel Dardis, Horacio Soberon-Ferrer, and Dilip Patro, “Analysis of Leisure Expenditures in the United States,” Journal of Leisure Research, vol. 26, no. 4, October 1994, pp. 309–321, and Sheila Mammen and Ann C. Foster, “Factors Affecting Household Expenditures for Entertainment Services,” Consumer Interests Annual, 1992, pp. 96–97, http://www.consumerinterests.org/cia1992. Research using the American Time Use Survey (ATUS) indicates that retirees, other factors being equal, spent 153 minutes (2.8 hours) more per day than full-time workers on inexpensive leisure activities, such as socializing and communicating with others, reading, watching television and movies, and attending religious services. Retirees only spent about a quarter of an hour (14 minutes) more per day on expensive leisure activities, such as golfing, than full-time workers. For more information, see Charlene M. Kalenoski and Eakamon Oumtrakool, “How Retirees Spend Their Time: Helping Clients Set Realistic Income Goals,” Journal of Financial Planning, October 2014, vol. 27, no. 10, pp. 48–53.
11In 2013, Social Security, private and government retirement benefits accounted for 45.8 percent of pretax income of the 65–74 years group and 69.1 percent of pretax income of the 75 years and over group. In contrast Social Security, private and government retirement benefits made up 0.9 percent to 10.2 percent of pretax income of the household groups with a younger reference person.
12 The other expenses category is composed of cash contributions, alcohol, tobacco, personal care products and services, reading, education, life and personal insurance, and miscellaneous expenses.
Publish Date: Thursday, December 10, 2015