An official website of the United States government
An official website of the United States government
The .gov means it's official.
Federal government websites often end in .gov or .mil. Before sharing sensitive information,
make sure you're on a federal government site.
The site is secure.
The
https:// ensures that you are connecting to the official website and that any
information you provide is encrypted and transmitted securely.

More BLS articles and information on employment and unemployment are available online at the following links:
In deciding whether to take a new job, there are many factors to consider. Traditional matters of concern include job location, employer characteristics, and work-life balance. For many, one of the most important considerations is pay.
In examining pay, it is important to consider wage differentials—the ratio of occupational wages to average pay earned by all workers in a specific area. Because the cost of living in the United States fluctuates from region to region, earnings by occupation tend to vary accordingly. Here, wage differentials may offer further insight into the value that specific communities place on certain occupations and the standard of living enjoyed by workers in these occupations.
This Beyond the Numbers article discusses how wage differentials provide a different perspective for evaluating pay.1 The article uses May 2013 data from the Bureau of Labor Statistics Occupational Employment Statistics (OES) program. Three occupations—registered nurses, secondary school teachers, and securities, commodities, and financial services sales agents are highlighted to show how different the average pay can be by U.S. area.
For many occupations, pay, both in terms of total earnings and wage differentials, varies widely across the country. For example, in May 2013, registered nurses (RNs) in San Jose-Sunnyvale—Santa Clara, CA earned an average of $123,190 per year, while RNs in Brownsville—Harlingen, TX earned $66,480 per year. However, according to the measure of wage differentials, Brownsville—Harlingen RNs actually earned more of a wage premium than San Jose—Sunnyvale—Santa Clara RNs. That is, relative to average pay for all workers in their respective regions, RNs in the Brownsville area earned more than their counterparts in the San-Jose area
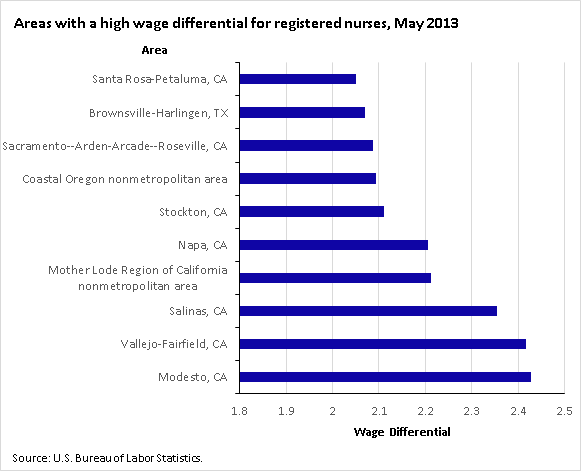
During the same period, average pay for all RNs in the United States was $68,910, or 1.5 times the average pay for all occupations in the nation. But in some areas of the country, RNs earned more than twice the average pay earned by all other workers in their area. (See chart 1.)
Although the average RN earned $123,190 per year in San Jose-Sunnyvale—Santa Clara, CA, the average worker across all occupations in that area earned $71,650. The result is a wage differential of 1.7 ($123,190/$71,650); RNs earned about 1.7 times the amount earned by the average worker in San Jose-Sunnyvale-Santa Clara, CA. In Brownsville—Harlingen, TX, where the average RN earned $66,480, the average worker among all occupations earned $32,130. Accordingly, the Brownsville RNs earned about 2.1 times the average amount earned by all workers in the area, a wage differential of 2.1.
In many cases, the areas with the highest average pay for a specific occupation are different from the areas with the highest wage differential. Table 1 shows the areas with the highest average earnings for secondary school teachers, excluding special and career/technical education, in May 2013.
The areas listed in table 1 are among the areas with the highest average earnings in the United States for most occupations, so the fact that these areas also were among those with the highest pay for secondary school teachers is not surprising. But as the data reveal, a high rate of pay does not necessarily correlate to a high wage differential.
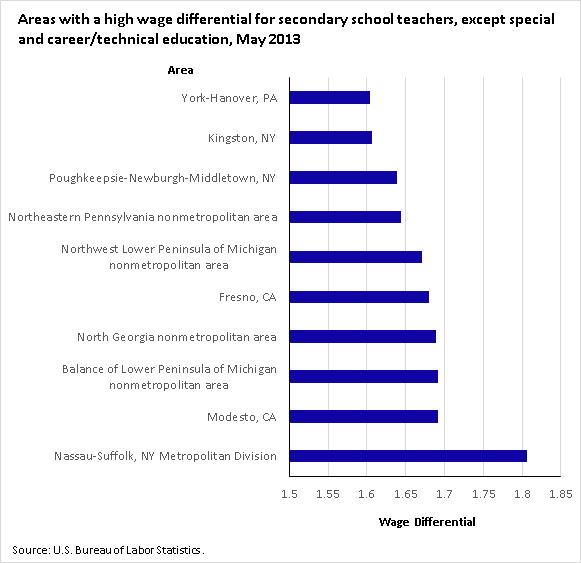
Chart 2 shows the areas with a high wage differential for the secondary school teachers.
Only two of the areas with the highest wage differential for the teachers were among the areas with the highest average pay for this group. Lower average earnings among all occupations in other areas gave the secondary school teachers a higher wage differential in those areas. For example, average pay for these teachers in the North Georgia nonmetropolitan area was $57,840, which seems low compared with the high wages present in table 1. (See table 1.) However, because the average occupation in the North Georgia nonmetropolitan area earned workers $34,240, the wage differential for secondary school teachers was 1.7.
| Area | Mean Wage | Wage Differential |
|---|---|---|
| United States | $58,260 | 1.3 |
| Nassau-Suffolk, NY Metropolitan Division | $96,250 | 1.8 |
| New York-White Plains-Wayne, NY-NJ Metropolitan Division | $77,750 | 1.3 |
| Poughkeepsie-Newburgh-Middletown, NY | $77,500 | 1.6 |
| Santa Ana-Anaheim-Irvine, CA Metropolitan Division | $76,230 | 1.5 |
| Chicago-Joliet-Naperville, IL Metropolitan Division | $74,430 | 1.5 |
| Modesto, CA | $73,160 | 1.7 |
| Boston-Cambridge-Quincy, MA NECTA Division | $73,090 | 1.2 |
| San Jose-Sunnyvale-Santa Clara, CA | $72,600 | 1.0 |
| Bridgeport-Stamford-Norwalk, CT | $72,340 | 1.2 |
| Newark-Union, NJ-PA Metropolitan Division | $71,480 | 1.3 |
| Source: U.S. Bureau of Labor Statistics. | ||
RNs and secondary school teachers are not the only occupations where there exist variances between the areas with high rates of pay and areas with high wage differentials. As the data illustrate, this incongruity is found in the financial sector as well. Chart 3 shows selected areas with a high wage differential for securities, commodities, and financial services sales agents in May 2013.
About half of those areas were among the ones with the highest average earnings for securities, commodities, and financial services sales agents. In both Bridgeport—Stamford—Norwalk, CT and Wilmington, NC, securities, commodities, and financial services sales agents earned about 2.7 times the average wage for all occupations in their respective areas, even though the actual pay earned in these two areas was vastly different. In Bridgeport—Stamford—Norwalk, CT, these workers earned $169,270, and in Wilmington, NC, they earned $109,870. But because average earnings across the board were so much lower in Wilmington, the wage differential for both remained the same—namely 2.7. In both areas, securities, commodities, and financial services sales agents earned similar wage premiums.
Wage differentials can be a powerful tool for jobseekers. They show how much workers in a given occupation earn relative to the average earnings of all workers in a particular area. In many cases, the occupations with the highest wage differential are not necessarily the occupations with the highest average wage.
This Beyond the Numbers summary was prepared by Ben Cover, economist in the office of Occupational Employment Statistics, U.S. Bureau of Labor Statistics. Email: cover.benjamin@bls.gov. Telephone: 202-691-5178.
Information in this article will be made available to sensory-impaired individuals upon request. Voice phone: (202) 691-5200. Federal Relay Service: 1-800-877-8339. This article is in the public domain and may be reproduced without permission.
Benjamin Cover, “Wage differentials: how jobseekers can use them to analyze occupational wage and cost of living data by U.S. area ,” Beyond the Numbers: Employment & Unemployment, vol. 3, no. 20 (U.S. Bureau of Labor Statistics, September 2014), https://www.bls.gov/opub/btn/volume-3/wage-differentials-for-jobseekers.htm
1 Several examples from the Occupational Employment Statistics Program are used. Data for all occupations and areas can
be found at https://www.bls.gov/oes/tables.htm.
Publish Date: Tuesday, September 16, 2014