An official website of the United States government
An official website of the United States government
The .gov means it's official.
Federal government websites often end in .gov or .mil. Before sharing sensitive information,
make sure you're on a federal government site.
The site is secure.
The
https:// ensures that you are connecting to the official website and that any
information you provide is encrypted and transmitted securely.

More BLS articles and information related to Production Price Index are available at the following links:
"New wherever-provided services and construction indexes for PPI (August 2009)"
"Wholesale and retail Producer Price Indexes: margin prices (2Q 2012)"
"PPI Industry or Commodity Data: Which Better Suits Your Needs? (2Q 2010)"
Electronic retailing, or e-commerce, is becoming an increasingly important activity within the U.S. economy. As a component of the retail trade index within the Bureau of Labor Statistics Producer Price Index (PPI) program, the electronic retailing index measures changes in margins received by retailers who conduct sales transactions online.1 (See accompanying box.)
In contrast to all goods-producing industries and most service-providing industries, establishments engaged in wholesale and retail trade purchase goods primarily for direct resale to other businesses and consumers. The PPI views wholesalers and retailers as suppliers of distributive services (rather than goods), because little, if any, transformation of these goods takes place. This approach implies that the output of a wholesale or retail trade establishment is represented by the difference between its selling price of a good and the acquisition price for that same item. As a result, for the trade sector the PPI tracks the average changes in gross margins received by wholesalers and retailers. Gross margin prices reflect the value added by the establishment for services such as marketing, storing, and displaying goods in convenient locations and making the goods easily available for customers to purchase. Margin is defined as the price at which a retailer sells a good, less the current acquisition price of that same good. For more on margin prices in the PPI, see “Wholesale and retail Producer Price Indexes: margin prices,” Beyond the numbers: prices & spending (U.S. Bureau of Labor Statistics, August 2012), https://www.bls.gov/opub/btn/volume-1/wholesale-and-retail-producer-price-indexes-margin-prices.htm.
In the first quarter of 2004, the incidence of retailers conducting electronic retailing was considered minor, making up only 2 percent of total U.S. retail sales. But from 2003 to 2006, electronic retail sales increased an average of 28 percent annually.2 Then, by the first quarter of 2014, e-commerce grew to about 6 percent of total retail sales in the United States. Between 2009 and 2014, e-commerce sales increased at an average annual rate of 16 percent, compared with a 5-percent growth rate in total retail sales.3
This Beyond the Numbers article describes the electronic shopping and mail-order houses industry group within the North American Industry Classification System (NAICS) and compares the factors affecting changes in margins for brick-and-mortar establishments and e-commerce establishments. The article compares changes in margins between the two types of establishments for three specific stores: furniture, clothing, and electronics.
In July 2006, the Bureau of Labor Statistics Producer Price Index (PPI) program initiated coverage of the electronic commerce (e-commerce) industry group, which included electronic shopping (NAICS 454111) and electronic auctions (NAICS 454112); the data for these industries were added to the existing PPI for mail-order houses (NAICS 454113) to form the electronic and mail-order shopping index. In July 2013, the PPI introduced indexes for detailed categories of goods within the electronic shopping and mail-order houses industry group (NAICS 45411). These new indexes allow for the comparison of changes in margins for certain categories of goods between brick-and-mortar and e-commerce retailers.4 The PPIs currently available include the following:
PCU454110454110 Electronic and mail-order shopping
PCU454110454110P Primary services
PCU4541104541101 Electronic and mail-order shopping services
PCU45411045411011 Electronic and mail-order drugs, health aids, and cosmetics
PCU45411045411012 Electronic and mail-order apparel and footwear
PCU45411045411013 Electronic and mail-order electronic goods, including appliances
PCU45411045411014 Electronic and mail-order home furnishings, hardware, and related goods
PCU45411045411015 Electronic and mail-order services for all other goods
Retail trade PPIs measure changes in margins received by retailers. The output measured is the “provision of the marketing functions necessary to allow consumers access to purchase various goods.”5 The PPI quantifies this output by tracking the value added by the retailer, measured as the difference between the retail price to the consumer and the price paid by the retailer to acquire the good.
Among the most apparent factors that may move margins differently for brick-and-mortar stores versus e-commerce retailers are the input costs incurred to resell goods. If the transactions measured by the PPI were the retail price of goods to the consumer, as it is in the CPI, then acquisition costs would be considered the main input costs to retailers. However, because the PPI measures the services provided between buying and reselling goods as the output of retailers, it follows that operating expenses, such as expenses for supplies, rent, wages, and marketing, are more relevant to consider as input costs for providing those retailing services. Establishments seek to make enough margin revenue to cover their operating expenses, even though they are not directly related to the selling and acquisition price of each individual sale. Changes in such costs require retailers to either renegotiate with suppliers or adjust their selling prices to cover their expenses in order to remain profitable. Therefore, the comparison of fluctuations in these costs between store and nonstore retailers can help explain differences in margin PPIs.
One of the factors affecting prices is overhead costs. E-commerce retailers typically maintain lower margins than brick-and-mortar stores, in part because they tend to experience lower overhead costs, given that they do not have to incur the expenses associated with preserving store appearance for customers. Store retailers require wider margins to cover costs for décor and store maintenance. In addition, since 2009, rental expenses for retail properties have grown 6.5 percent while those for industrial buildings have declined 10.5 percent. The rise in commercial rents over time likely influenced stores to increase margins by raising prices, with the aim of covering these rising expenses. Stores often justify their higher prices by offering convenience and store experience. Shoppers frequently are willing to pay for the convenience of seeing a demonstration of their desired products and receiving their purchases immediately, rather than viewing them online and waiting for delivery.6
Compensation of employees is another input cost to consider. In general, changes in wages are gradual and seasonal, affecting all types of retailers evenly. However, brick-and-mortar retail stores typically maintain a larger number of employees and employees with specialized skills for their in-store services; therefore, wider margins are more crucial for these retailers than for e-commerce retailers. In 2011, about a third of all retail stores had more than 500 employees, compared with 5 percent of those in the electronic shopping and mail-order houses industry. In addition, 87 percent of online establishments had fewer than 20 employees, compared with about 56 percent of store retail establishments.7
Marketing costs are an overhead expense that can differ between brick-and-mortar stores and online retailers because of different advertising needs. With more visibility to customers, retailers with storefronts in well-frequented shopping areas are typically less affected than e-commerce retailers by changes in marketing costs. By contrast, online retailers may be more dependent on advertising to direct customers to their “electronic storefront.” In 2012, on average, electronic and mail-order shopping retailers spent 3 times that of store retailers on advertising and promotions per dollar of sales.8
Last, the number and size of competitors in a market may influence margins. Widespread access to technology in the United States makes it relatively easy to enter the e-commerce market, whereas the startup capital and rent required to open a brick-and-mortar shop make that more difficult to do. Margins often fall as new competitors enter the e-commerce market and retailers compete on selling price in an effort to gain or maintain market share.9
In 2012, e-commerce accounted for about 60 percent of sales ($192 billion out of $323 billion) within the electronic shopping and mail-order houses industry group, a group that made up more than 7 percent of total U.S. retail sales.10 Margins for electronic and mail-order shopping have declined since 2009, whereas those for the retail sector overall have risen. As shown in chart 1, the average monthly change in margins for total retail trade was +0.153 percent, while the average change in margins for electronic shopping and mail order houses was –0.023 percent.
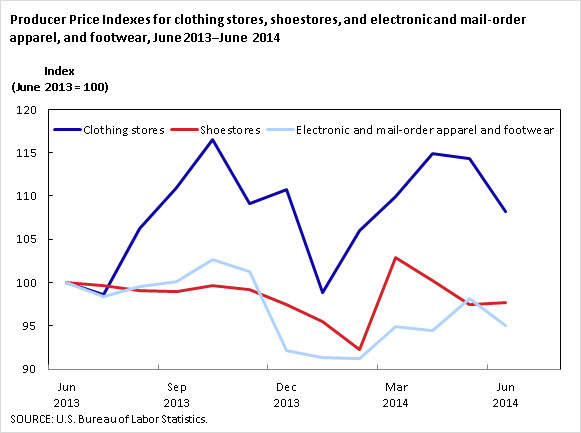
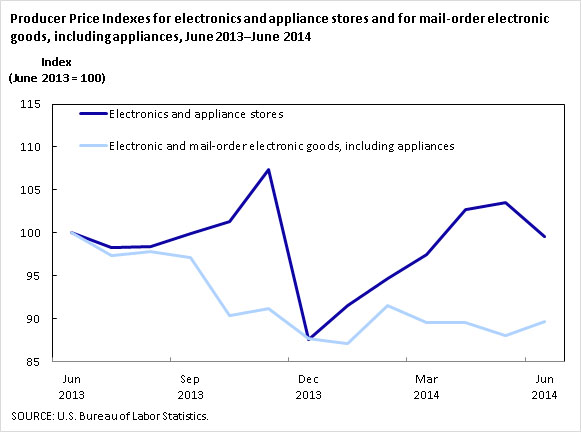
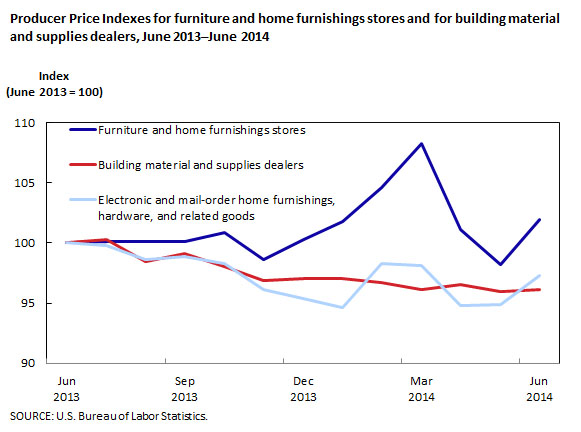
Increasing competition among e-commerce retailers likely contributed to the decrease in the PPI for electronic and mail-order shopping by putting downward pressure on selling prices. In addition, e-commerce retailers have been trying to gain market share by charging lower prices than store retailers charge. The average number of U.S. establishments in the electronic and mail-order shopping industry group increased 31 percent from 2009 to 2013, compared with a 0.3-percent decline in the number of store retail establishments.11 In support of this phenomenon, the PPI measures of margins for the specific categories of furniture, clothing, and electronics stores also have diverged since the publication of detailed electronic and mail-order shopping indexes began in June 2013. (See charts 2, 3, and 4.) For each product area, e-commerce margins consistently have moved lower while brick-and-mortar margins have expanded.
In sum, margins for the electronic and mail-order shopping industry group have been shrinking, likely because of increased competition in the e-commerce market. Brick-and-mortar retailers, by contrast, have broadened their margins to cover their rising rent and marketing expenses. Many justify this premium by providing the in-store experience and the convenience of immediate accessibility to their goods. As the structure of the industry for electronic and mail-order houses continues to mature and change in other ways, additional data will reveal whether the current divergent trend in margins between brick-and-mortar stores and e-commerce retailers continues.
This Beyond the Numbers summary was prepared by Lana Borgie, economist in the Producer Price Index, Office of Prices and Living Conditions, U.S. Bureau of Labor Statistics. Email: borgie.lana@bls.gov, telephone: (202) 691-7719.
Information in this article will be made available upon request to individuals with sensory impairments. Voice phone: (202) 691-5200. Federal Relay Service: 1-800-877-8339. This article is in the public domain and may be reproduced without permission.
Lana Borgie, “Trends in producer prices between e-commerce and brick-and-mortar retail trade establishments ,” Beyond the Numbers: Prices & Spending, vol. 3, no. 18 (U.S. Bureau of Labor Statistics, August 2014), https://www.bls.gov/opub/btn/volume-3/trends-in-producer-prices-between-e-commerce-and-brick-and-mortar-retail-trade-establishments.htm
1 Retail trade indexes were first introduced into the Producer Price Index (PPI) in July 2000. These first retail trade PPIs, for food stores and new car dealers, were followed by indexes for additional industries, until near-complete coverage of the retail sector was reached in January 2004. One area of retail trade that was not initially covered was electronic retailing. This industry was added to the PPI in June 2006. (See Producer Price Indexes: additional retail trade indexes in the PPI (U.S. Bureau of Labor Statistics, February 16, 2012), https://www.bls.gov/ppi/ppiaddretail.htm; and Producer Price Indexes: PPI introduces industries to complete coverage of the retail trade sector (U.S. Bureau of Labor Statistics, February 16, 2012), https://www.bls.gov/ppi/ppiretailtrade.htm.)
2 Estimated quarterly U.S. retail sales (not adjusted): total and e-commerce (U.S. Census Bureau, Retail Indicators Branch, May 15, 2013), https://www.census.gov/retail/mrts/www/data/excel/tsnotadjustedsales.xls.
3Monthly & annual retail trade (U.S. Census Bureau, May 15, 2014), https://www.census.gov/retail. Data are provided under the section titled “Latest quarterly e-commerce report” and were extracted from the Times Series Excel file.
4 It is important to note that PPIs track changes in margins on a percentage basis. PPI data cannot be used to compare differences in the absolute size of margins received between store and nonstore retailers.
5 Roslyn Swick, Deanna Bathgate, and Michael Horrigan, “Services Producer Price Indices: past, present, and future,” draft paper (U.S. Bureau of Labor Statistics, May 26, 2009; presented at the Federal Economic Statistics Advisory Committee, June 9, 2006), https://www.bls.gov/advisory/fesacp1060906.pdf.
6 William L. McComb, “Clicks and mortar: why in-store experience matters (now more than ever),” Forbes, June 11, 2012, http://www.forbes.com/sites/onmarketing/2012/06/11/clicks-and-mortar-why-in-store-experience-matters-now-more-than-ever/.
7 Statistics of U.S. businesses (U.S. Census Bureau, December 2013), http://www2.census.gov/econ/susb/data/2011/us_6digitnaics_2011.xls. Data are provided under the section titled “Latest SUSB annual data” and were extracted from the U.S. All Industries Excel file. Data on store retailers were calculated by subtracting nonstore retailer subsector data from total retail trade.
8 Monthly & annual retail trade (U.S. Census Bureau, March 31, 2014), https://www.census.gov/retail. Data are provided under the section titled “Latest Annual Retail Trade Report” and were extracted from the Detailed Operating Expenses Excel file and Sales (1992–2012) Excel file. Data for store retailers were calculated by subtracting nonstore retailer subsector data from total retail trade.
9 Andrew Tonner, “In defense of Amazon,” The Motley Fool, July 25, 2104, http://www.fool.com/investing/general/2014/07/25/in-defense-of-amazon.aspx.
10 Monthly & annual retail trade (U.S. Census Bureau, March 31, 2014), https://www.census.gov/retail. Data are provided under the section titled “Latest annual Retail trade report” and were extracted from the U.S. Retail Trade Sales—Total and E-commerce Excel file and the U.S. Electronic Shopping and Mail-Order Houses (NAICS 4541)—Total and E-commerce Sales by Merchandise Line Excel file.
11 Databases, tables & calculators by subject: Quarterly Census of Employment and Wages (U.S. Bureau of Labor Statistics), https://data.bls.gov/timeseries/ENUUS00020545411&series_id=ENUUS00020544-45&series_id=ENUUS000205454&years_option=specific_years&from_year=2009. The values presented in this article were downloaded June 18, 2014. Over time, BLS makes revisions to the Quarterly Census of Employment and Wages; therefore, final values may differ from those referenced in the article.
Publish Date: Monday, August 18, 2014