An official website of the United States government
An official website of the United States government
The .gov means it's official.
Federal government websites often end in .gov or .mil. Before sharing sensitive information,
make sure you're on a federal government site.
The site is secure.
The
https:// ensures that you are connecting to the official website and that any
information you provide is encrypted and transmitted securely.

“The Impact of the Earthquake in Japan on U.S. Imports,” Focus on Prices and Spending
“Forty Years of the BLS Export and Import Price Indexes: trends and competition,” Beyond the Numbers
In the fall of 2012, Japan set forth economic policies aimed at turning around the country’s historic deflationary slide that began in the 1990s. These policies led the Japanese yen to fall dramatically in value relative to the U.S. dollar, reversing what was a long upward trend of strength against the dollar. From September 2012 to May 2013, the yen–dollar exchange rate plummeted 22.5 percent. Although the rate of decline decelerated considerably over the remainder of the year, the yen fell an additional 2.4 percent against the U.S. dollar between May and December. A falling yen means the purchasing power of the U.S. dollar increases for goods imported from Japan. Parallel to the drop in the value of the yen, import prices of Japanese goods fell 3.5 percent from September 2012 to December 2013. The drop in the value of the yen particularly influenced prices in major product areas such as nonelectrical machinery, computers and electronic products, and chemicals, which combined make up nearly 40 percent of U.S. imports from Japan. The industry that is most affected by Japanese import prices is the transportation vehicles industry, which alone represents 42 percent of U.S. imports from Japan.
A deflationary cycle over much of the past two decades has led the Japanese economy to stagnate, as domestic demand remained weak. In the short run, falling prices generally led to an increase in quantity demanded, but long‑term deflation had the opposite effect. Continued falling prices led to a drop in domestic demand over time as consumers and businesses held off on making purchases in expectation of lower prices in the future.1
In December 2012, Japan instituted a set of monetary and fiscal policies to reach the intended goal of a 2‑percent inflation rate within 2 years. On the monetary side, the Bank of Japan began buying government bonds at the rate of 7 trillion yen a month to spur demand and, ultimately, prices. Fiscal policy changes centered on corporate tax breaks for companies that increased wages.2
In terms of turning price levels around in Japan, the policies seem to be working. In July 2013, Japan’s inflation rate rose 0.7 percent, the largest monthly advance in almost 5 years, and by November, core inflation rose 1.2 percent on a year‑over‑year basis, more than halfway towards the stated goal of a 2‑percent inflation rate by the beginning of 2015.3 In addition to the advance in prices, wage rates rose following 17 consecutive months of decline, with production output and retail sales increasing as well.4
Japan’s recent economic policies have also had an impact on the value of the yen. With few interruptions, the yen has trended upward against the U.S. dollar since 1971, when the world’s currencies began to float (meaning that a currency's value fluctuates according to the foreign‑exchange market). Historically, the yen has been a good store of value because Japan has had low inflation relative to other countries and has maintained a trade surplus, which creates a high demand for yen from people buying Japanese exports. More recently, following a brief downturn, the yen rose 57.0 percent in the roughly 5‑year period from June 2007 to September 2012. Japan experienced a devastating natural disaster during this time, when an earthquake and tsunami struck the northeast section of the country in March 2011. In the days following the disaster, the yen initially fell in value against the U.S. dollar, declining 0.8 percent between March and April. However, that proved short‑lived as the yen rebounded. This rebound resulted from a quick return to the yen by investors who anticipated insurance companies purchasing yen to pay for damages.5 From April to October 2011, the yen jumped 8.5 percent against the U.S. dollar, putting pressure on Japanese companies trying to compete in foreign markets.
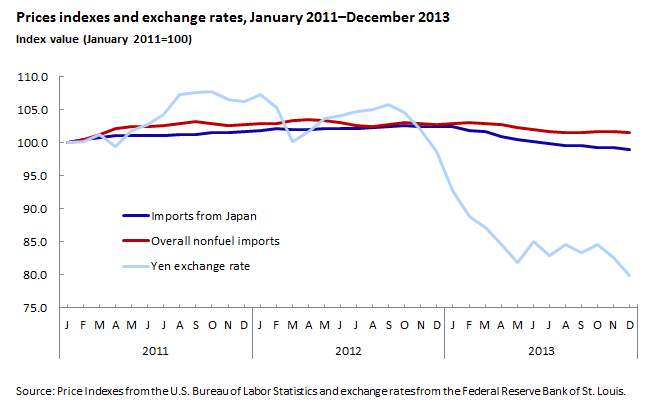
One of the consequences of the government buying bonds is the increased availability of yen for purchase in the exchange market, making yen cheaper in the short run. Even though the value of the yen was already falling prior to the introduction of the actual policy changes, falling 3.5 percent from September to December 2012, the rate of decrease accelerated as the yen plunged 19.7 percent over the first 5 months of 2013.
The precipitous drop in the value of the yen relative to the U.S. dollar has affected prices for imports from Japan. As seen in chart 1, import prices from Japan rose throughout 2011 and 2012, peaking in October 2012; one month after the value of the yen began to fall relative to the U.S. dollar. From the beginning of 2011 to October 2012, prices of imports from Japan rose 2.6 percent, similar to the rise in all U.S. nonfuel imports, which advanced 3.0 percent over the same period.6 Since October 2012, the price index of imports from Japan decreased in reaction to the drop in the value of the yen, both in absolute terms and relative to overall nonfuel import prices. From October 2012 through December 2013, import prices from Japan fell 3.6 percent, compared with overall nonfuel prices, which declined 1.5 percent over the same period. On a year‑over‑year basis, prices for imports from Japan decreased 3.4 percent in December 2013, the largest 12‑month drop in the index since a 3.8‑percent decline between March 2001 and March 2002—a period largely affected by the September 11, 2001, attacks on the United States.
The fall in the value of the yen also affected import prices from Japan for specific industries. As seen in table 1, 80.4 percent of Japanese imports into the United States are in four broadly defined industries: transportation equipment, nonelectrical machinery, computers and electrical equipment, and chemicals.
| Product area | 2013 dollar value of trade, in billions | Percent of total imports from Japan |
|---|---|---|
|
All commodities |
138.5 | |
|
Transportation equipment (NAICS 336) |
58.8 | 42.5 |
|
Nonelectrical machinery (NAICS 333) |
23.4 | 16.9 |
|
Computers and electrical equipment (NAICS 334) |
17.5 | 12.6 |
|
Chemicals (NAICS 325) |
11.6 | 8.4 |
|
All other imports from Japan |
27.2 | 19.6 |
|
Source: U.S. Census Bureau. |
||
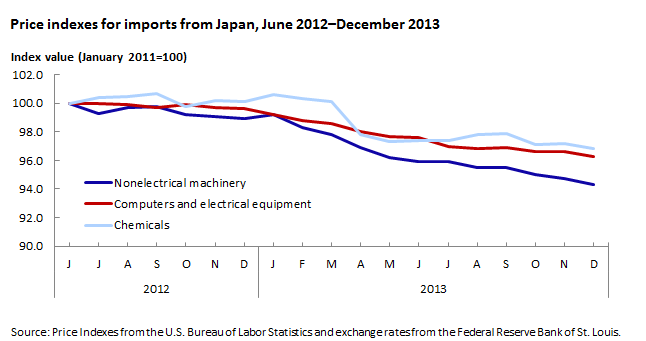
Beginning in June 2012, the Bureau of Labor Statistics (BLS) began publishing import price indexes by locality of origin for select product areas. For Japan, indexes are currently published for the nonelectrical machinery, computers and electrical equipment, and chemicals industries, as seen in chart 2. In February 2014, BLS introduced a new index for import transportation equipment from Japan, with the series beginning in December 2013.
Just as overall import prices from Japan fell, the price index for chemical imports from Japan began to fall in October 2012, while prices for nonelectrical machinery imports and computer and electrical equipment imports from Japan began to decline even before the drop in the value of the yen. Between October 2012 and December 2013, import prices for nonelectrical machinery decreased 4.9 percent, compared with a 0.7‑percent drop for all import prices for nonelectrical machinery. Prices for computers and electrical machinery from Japan declined 3.6 percent compared with a 2.2‑percent drop for all computer and electrical machinery import prices. Chemical prices from Japan fell 3.0 percent compared to overall import chemical prices, which edged down 0.7 percent. For all three industries, import prices from Japan fell at a faster rate than import prices from the rest of the world, putting downward pressure on overall import prices.
The value of the falling yen has more influence on the automotive industry than on any other industry. Japanese imports made up 17.6 percent of all imports, ranking third behind Mexico and Canada among U.S. trade partners. In terms of U.S. imports of passenger cars, Japan ranks second only to Canada, as the majority of imports from Mexico are automotive parts and engines.
| Product area | 2013 dollar value of trade, in billions | Percent of total imports by country |
|---|---|---|
|
All commodities |
311.2 | |
|
Mexico |
86.2 | 27.7 |
|
Canada |
61.9 | 19.9 |
|
Japan |
54.9 | 17.6 |
|
Germany |
16.2 | 5.2 |
|
All other imports |
92 | 29.6 |
|
Source: U.S. Census Bureau. |
||
The overall import price index for automotive vehicles, parts, and engines, shows that prices decreased 1.5 percent between October 2012 and December 2013, the same decline as recently recorded for the year ended in October 2013. That year‑over‑year decline was the largest 12‑month drop for automotive vehicles, parts, and engine prices since BLS first published the index in June 1981. In addition, other than a brief 0.1‑percent uptick in April 2009, the 0.2‑percent decline for the year ended in May 2013 was the first time the index decreased on a 12‑month basis since 2002.
Even though the rate of decline of the yen relative to the U.S. dollar decreased in the second half of 2013, the Japanese government remained committed to reaching a 2‑percent level of inflation by 2015. The impact of the changing yen will continue to be relevant, so BLS expanded its coverage in December 2013 with a price index for transportation equipment imported from Japan. With the onset of that index, the BLS will now produce price indexes for the four most important import industries from Japan. Going forward, this will contribute to a more comprehensive picture of the changing value of the yen and the resulting effect on the United States.
Led by lower prices for both fuel and nonfuel imports, as seen in table 3, the price index for overall imports fell for the second consecutive year in 2013, decreasing 1.3 percent after declining 2.0 percent in 2012. The largest drops for overall import prices happened during the second and final quarters of 2013, falling 1.7 percent and 1.6 percent, respectively.
| Index | Summary of December-to-December percent changes | |||||||||
|---|---|---|---|---|---|---|---|---|---|---|
| 2004 | 2005 | 2006 | 2007 | 2008 | 2009 | 2010 | 2011 | 2012 | 2013 | |
|
All-commodity imports |
6.7 | 8.0 | 2.5 | 10.6 | -10.1 | 8.6 | 5.3 | 8.5 | -2.0 | -1.3 |
|
Excluding fuels |
3.0 | 1.1 | 2.9 | 3.1 | 1.2 | 0.3 | 3.0 | 3.4 | 0.0 | -1.2 |
|
Fuels |
31.5 | 43.5 | 0.9 | 42.1 | -47.0 | 62.2 | 14.2 | 24.9 | -7.9 | -1.7 |
|
All-commodity exports |
4.0 | 2.8 | 4.5 | 6.0 | -2.9 | 3.4 | 6.5 | 3.6 | -1.0 | 1.1 |
|
Excluding agriculture |
5.0 | 2.6 | 3.7 | 4.5 | -2.2 | 2.9 | 5.1 | 4.0 | -0.3 | -0.5 |
|
Agricultural |
-5.9 | 4.9 | 13.5 | 23.3 | -10.9 | 9.2 | 20.5 | 1.0 | 13.4 | -6.3 |
|
Source: U.S. Bureau of Labor Statistics. |
||||||||||
Fuel imports. Prices for fuel imports declined 1.7 percent in 2013, the second consecutive year the index has decreased. In 2012, import fuel prices fell 7.9 percent, the largest calendar‑year decrease since a 47.0‑percent drop in 2008. The decrease in 2013 was primarily due to a 7.1‑percent decline in the last quarter.
The price index for imported petroleum declined 1.5 percent in 2013, driving the overall decrease in fuel prices. Following an 8.7‑percent decrease in 2012, petroleum prices have declined for the second consecutive year after increasing 27.1 percent in 2011. Strong oil production in the United States contributed to a surge in the global supply of petroleum, causing prices to fall.7 Moreover, domestic demand for petroleum has stalled as vehicles become more efficient.8
Following a 17.6‑percent upturn in 2012, the price index for natural gas fell in 2013, dropping 3.7 percent. However, the price index for natural gas increased 35.5 percent during the final quarter of 2013, after recording monthly advances in each of the last 3 months of the year. Colder‑than‑normal weather in the central and eastern United States drove domestic demands up, causing higher prices.9
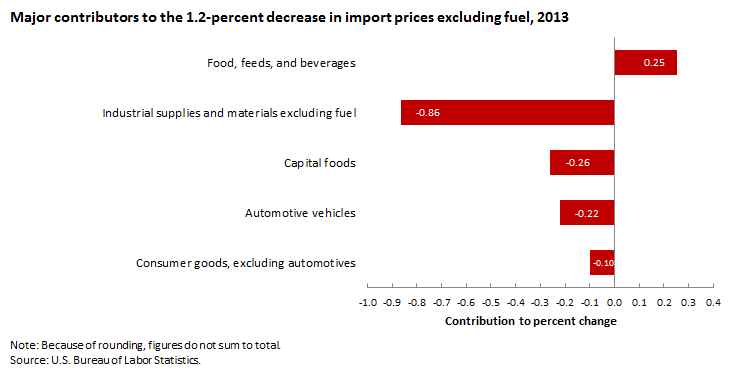
Nonfuel imports. Import prices excluding fuel also declined overall in 2013, decreasing 1.2 percent for the year after recording no change in 2012 and a 3.4‑percent increase in 2011. The 2013 decrease was the first calendar‑year drop since BLS first published the index in December 2001. As shown in chart 3, lower prices for nonfuel industrial supplies and materials had the largest contribution to the overall decline in nonfuel prices. Falling prices for capital goods, automotive vehicles, and consumer goods also drove the index down overall.
Prices for industrial supplies and materials excluding fuels decreased 5.0 percent in 2013, the largest calendar‑year decline since the index’s first publication in December 2001. As was the case in 2012, lower prices for unfinished metals led to the overall decline of the index in 2013, falling 10.7 percent.
The prices for finished goods decreased in all categories in the fourth quarter, although these decreases made much less of an impact on the overall movement of imports excluding fuel. Capital goods prices dropped 0.9 percent. The price index for automotive vehicles fell 1.4 percent. Prices for parts, engines, bodies, and chassis drove the index down overall, declining 2.4 percent in 2013. Consumer goods prices decreased 0.4 percent in 2013.
In contrast, the price index for foods, feeds, and beverages rose 4.1 percent in 2013, after a 1.9‑percent decline the previous year. Prices for vegetables, up 10.4 percent, drove the increase in 2013.
U.S. export prices declined 1.0 percent in 2013, after rising 1.1 percent the previous year. The decrease in 2013 was the largest calendar-year drop since a 2.9‑percent decline in 2008. The decline took place between March and August, when export prices dropped 1.9 percent. The price indexes for nonagricultural commodities and agricultural commodities both contributed to the overall decrease in export prices for 2013, though the drop in nonagricultural prices was more pronounced.
Agricultural exports. Prices for agricultural exports fell 6.3 percent over the past 12 months, following a 13.4‑percent increase in 2012. Lower prices for soybeans, vegetables, and wheat, down 8.9 percent, 2.7 percent, and 19.3 percent, respectively, all contributed to the overall drop in agricultural export prices. Favorable weather conditions throughout much of the Midwest during the second half of the year resulted in abundant crop yields.10 Between July 2013 and December 2013, soybean prices fell 12.8 percent, compared with an 8.3‑percent increase during the first half of 2013. According to a report from the U.S. Department of Agriculture, global soybean production increased in 2013 because of larger crops in the United States and Brazil. Soybean exports are up 544,000 tons from 2012 levels to 40.7 million tons in 2013, in part because of continued strong demand from China.11
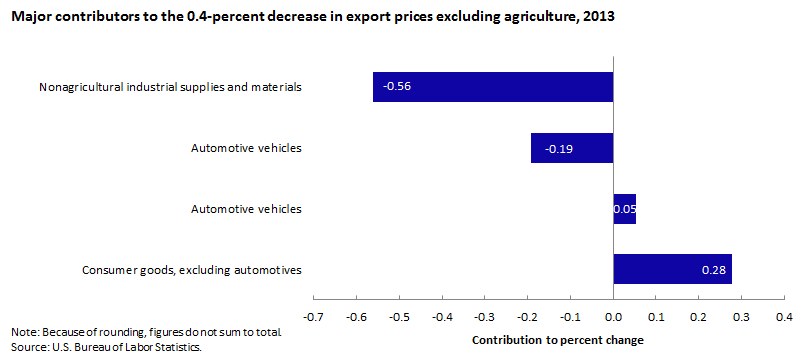
Nonagricultural exports. The price index for nonagricultural exports decreased for the second consecutive year, falling 0.4 percent in 2013, after a 0.3‑percent decline in 2012. Nonagricultural prices trended mostly down between February 2013 and October 2013, decreasing 1.9 percent. As seen in chart 4, a 1.6‑percent drop in nonagricultural industrial supplies and materials drove the decrease. This decline in prices for nonagricultural industrial supplies and materials more than offset rising prices for capital goods and automotive vehicles.
The 2013 decline in nonagricultural industrial supplies and materials prices followed a 2.2‑percent decrease in 2012, driven by a 4.3‑percent fall between February 2013 and July 2013. Lower prices for nonmonetary gold and other precious metals led the drop in the price index for export nonagricultural industrial supplies and materials.
Consumer goods prices fell 1.4 percent in 2013. The decline was the largest calendar‑year drop since BLS first published the index in September 1983. Falling prices for medicinal, dental, and pharmaceutical preparatory materials were the major contributors to the decrease. The price indexes for export automotive vehicles and capital goods both increased in 2013, rising 0.5 percent and 0.7 percent, respectively.
This Beyond the Numbers summary was prepared by David Mead and Sharon Royales, economists in the Office of Prices and Living Conditions, U.S. Bureau of Labor Statistics. Email: MXPinfo@bls.gov. Telephone: 202-691-7101.
Information in this article will be made available to sensory-impaired individuals upon request. Voice phone: (202) 691-5200. Federal Relay Service: 1-800-877-8339. This article is in the public domain and may be reproduced without permission
David Mead and Sharon Royales, “The impact of the falling yen on U.S. import prices,” Beyond the Numbers: Global Economy, vol. 3, no. 7 (U.S. Bureau of Labor Statistics, April 2014), https://www.bls.gov/opub/btn/volume-3/the-impact-of-the-falling-yen-on-us-import-prices.htm
1 “Yen Breaches 100 Threshold Mark Against US Dollar,” BBC News Business, May 10, 2013, http://www.bbc.com/news/business-22279105?print=true.
2 Heather Stewart, “Japan Aims to Jump-start Economy with 1.4tn of Quantitative Easing,” The Guardian, April 4, 2013, http://www.theguardian.com/business/2013/apr/04/japan-quantitative-easing-70bn.
3 Ibid.
4 “Japan Moves Close to Beating 15 Years of Falling Prices,” BBC News Business, December 27, 2013, http://www.bbc.com/news/business-25524429?print=true.
5 Ezekiel Chew, “Record Gain for the Forex Trading Pair Yen in Six Months after Earthquake Propels Demand for the Currency,” Asia Forex Mentor, http://www.asiaforexmentor.com/impact-of-japan-major-earthquake-to-forex-trading-pair-yen/.
6 Nonfuel import prices are a better comparison to import prices from Japan because fuel imports from Japan are trivial relative to the rest of the world and the fuel sector is traditionally volatile relative to other prices.
7 Edwin Bennion and David Mead, “The reemergence of the United States as a global petroleum producer,” Beyond the Numbers: Global Economy, vol. 2, no. 19 (U.S. Bureau of Labor Statistics, August 2013), https://www.bls.gov/opub/btn/volume-2/reemergence-of-the-united-states-as-a-global-petroleum-producer.htm.
8 Daniel Gilbert and Ben Lefebvre, “U.S. Oil Boom Changes Trade Trends,” The Wall Street Journal, January 7, 2014, https://www.wsj.com/articles/us-oil-boom-changes-trade-trends-1389122739.
9 Nicole Friedman, “Frigid Temperatures Fuel Natural-Gas Prices,” The Wall Street Journal, December 30, 2013, http://online.wsj.com/news/articles/SB10001424052702304137304579290802048720912?KEYWORDS=natural+gas+prices.
10 Jeff Wilson and Whitney McFerron, “Corn Extends Drop to 33-Month Low on U.S. Crop; Soybeans Decline” Bloomberg, July 29, 2013, http://www.bloomberg.com/news/2013-07-29/corn-declines-to-33-month-low-on-record-u-s-crop-soybeans-drop.html.
11 Foreign Agricultural Service/USDA, Oilseeds: World Markets and Trade, January 2014, https://downloads.usda.library.cornell.edu/usda-esmis/files/tx31qh68h/hd76s0481/st74cq86j/oilseed-trade-01-10-2014.pdf.
Publish Date: Friday, April 25, 2014