An official website of the United States government
An official website of the United States government
The .gov means it's official.
Federal government websites often end in .gov or .mil. Before sharing sensitive information,
make sure you're on a federal government site.
The site is secure.
The
https:// ensures that you are connecting to the official website and that any
information you provide is encrypted and transmitted securely.

Additional articles or information on unemployment in particular U.S. regions are available online at the following links:
Between June 2009, the start of the national recovery according to the National Bureau of Economic Research, and the end of 2012, the national unemployment rate dropped by 1.7 percentage points, to 7.8 percent, while the rate in New York City declined by only 0.6 percentage point, to 8.8 percent.1 This relatively small drop in the New York City rate occurred during a period of robust growth in payroll jobs in the city (up 6.2 percent). Nationally, the unemployment rate has remained high, or even increased, on several occasions during periods of recovery.2 Still, a number of observers of the New York City economy voiced the expectation that, given the size of the growth of nonfarm jobs, the city’s unemployment rate should have dropped further during 2012.3
This article examines the behavior of New York City’s unemployment rate from several perspectives. The analysis begins by placing the unemployment rate and the growth of nonfarm jobs in their historical context. The aim is to identify other periods in which strong job growth coexisted with persistent high unemployment. Then the labor force participation rate and the employment–population ratio are examined to see if they shed light on the inertia in the unemployment rate. The unemployment rate and the count of nonfarm jobs are based on two different surveys, of households and business establishments, respectively. The two surveys have different concepts of employment, making it difficult to infer that increases in nonfarm payroll jobs will translate into proportional increases in the number of employed city residents. However, an analysis of data from another household survey—the American Community Survey (ACS)—makes possible an examination of whether that survey’s patterns are similar to those in the Bureau of Labor Statistics (BLS) household survey. The article concludes with a comparison of movements in data from the two household surveys.
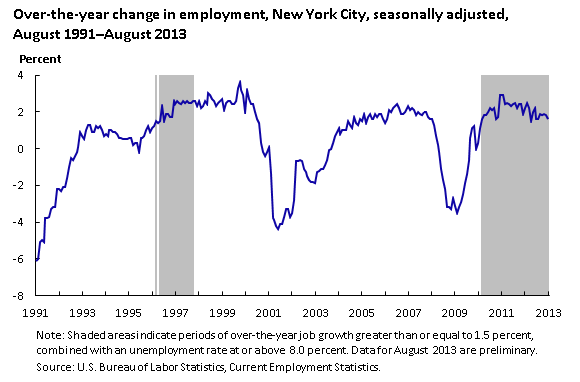
Over the past 22 years, New York City has experienced several large swings in the pace of job growth. Chart 1 presents over-the-year changes in nonfarm employment, beginning with August 1991. The shaded areas indicate periods of over-the-year job growth greater than or equal to 1.5 percent, combined with an unemployment rate at or above 8.0 percent. As the chart shows, the city experienced three periods of sustained job loss, each of which was followed by years-long periods of job gains.4 The most recent upturn in payroll employment began in April 2010, although the initial pace of job growth was relatively modest, remaining below 1.5 percent until October of that year. From October 2010 until August 2013, the over-the-year change in employment ranged from a high of 2.9 percent to a low of 1.5 percent. This pattern of recoveries beginning with modest growth and then strengthening is also seen in the upturns that began in June 1993 and May 2004.
For the purpose of examining the connection between the growth in payroll jobs and changes in the unemployment rate, it is useful to separate periods of modest job growth from periods of strong job growth with a distinguishing value or threshold. This article uses a threshold of 1.5-percent per year.5 Labor force growth in New York City has generally been less than 1.0 percent, so it is plausible to expect job growth rates of 1.5 percent or higher to be associated with falling unemployment. Observers such as the Fiscal Policy Institute and Julie Anna Golebiewski, an economist with the New York City Independent Budget Office, voiced the expectation that the pace of over-the-year job growth in 2012 (which ranged from 2.5 percent to 1.5 percent) could have resulted in a falling unemployment rate.6
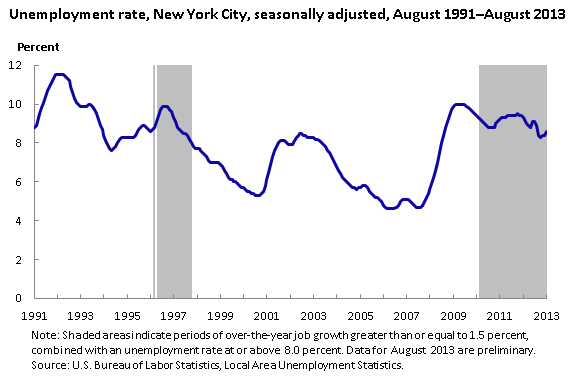
There have been occasions when strong over-the-year job growth was associated with substantial reductions in the unemployment rate. For example, from May 1998 through February 2001 the rate of job growth ranged from 3.6 percent to 1.6 percent. As chart 2 illustrates, the unemployment rate declined from 8.0 percent to 5.3 percent over that same period.7
Chart 2 also shows that strong job growth with persistent high unemployment is not unprecedented. The shaded areas in the chart show periods with job growth of 1.5 percent or higher, combined with an unemployment rate at or above 8.0 percent. The period from October 2010 through August 2013 meets these criteria, with the unemployment rate averaging 9.0 percent. It has not been widely recognized, however, that the period from December 1996 through May 1998 also combined strong job growth with high unemployment. Over that 18-month period, the unemployment rate was 9.1 percent—almost the same as that in the most recent period.
If 9.0 percent were used as a threshold for high unemployment, the two shaded areas would be smaller but still important. The first period would start with December 1996 and last 10 months, and the second would start with June 2011 and last 17 months.
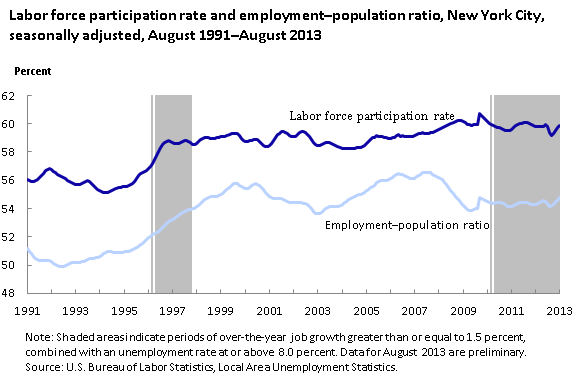
Chart 3 presents seasonally adjusted data from the BLS Local Area Unemployment Statistics (LAUS) program (the program that produces state and area unemployment rates), with the same periods shaded as in chart 2.8 One of the unusual aspects of the labor market in New York City is that the labor force participation rate has trended upward over the past 22 years. As the chart indicates, the rate rose by 3.4 percentage points. Nationally, the rate declined by 2.8 percentage points over the same period.
The chart also shows that the labor force participation rate and the employment–population ratio in New York City both increased from December 1996 to April 1998. During that period, the unemployment rate remained high, in part because of the expansion of the labor force.
The city’s employment–population ratio also trended upward—at least until March 2008, after which it dropped 2.7 percentage points over the next 20 months. Following a low of 53.9 percent reached in November 2009, the ratio rebounded in the spring of 2010. However, since August 2010, the employment–population ratio has fluctuated in a narrow range around 54.3 percent, slightly above its recessionary low. Over this same period, the labor force participation rate has remained within 0.5 percentage point of 59.6. The persistence of high unemployment during that timespan reflects the persistence of the near-recessionary level of the employment–population ratio combined with a relatively high labor force participation rate.
The question thus arises as to why the employment–population ratio in New York City remained little changed despite the increase in nonfarm jobs. A number of observers raised the related question of why large percentage increases in jobs were not resulting in large percentage increases in the count of employed city residents.9
At the national level, although the BLS household and establishment surveys track well over the long run, occasionally they also have reported large differences in changes in employment. One article by BLS economists reviewed efforts to understand why household employment (from the Current Population Survey) increased nationally by 2.3 million from 2001 to 2004 while payroll employment (from the Current Employment Statistics survey of business establishments) shrank by 0.3 million.10 An earlier study, using a slightly different methodology, had looked at the period from 1994 to 2000, when the job count increased by 17.5 million whereas the number of employed people grew by 12.1 million.11 Both of these articles noted that the household survey includes not only wage and salary workers, but also the self-employed, unpaid family workers, people employed by private households, and workers temporarily absent from work without pay. The household and establishment surveys also differ in their reference periods and geographies (place of work versus place of residence), their treatment of multiple jobholding, and the age of workers, among other things.12 Both articles concluded that, although various adjustments for industry, class of worker, and multiple jobholding explain some of the discrepancies, it is not possible to completely reconcile movements in the two national series for the periods in question.
In New York City, the sample sizes are smaller than those on the national level, resulting in larger standard errors. This difference makes it difficult to analyze over-the-year changes for those categories, such as the self-employed, used in attempts at reconciliation. In short, the conceptual differences between the two series are at least partially responsible for some of their substantive differences, but complete reconciliation is not always feasible at the national level, and it is even more difficult with New York City data.
The Census Bureau introduced the American Community Survey (ACS) to replace the long-form questionnaire used in the decennial census. Like the long form, the ACS is designed to be self-administered and collected by mail, although other means of collection are used to follow up with those who do not respond by mail. By contrast, the Current Population Survey (CPS) is conducted by trained interviewers. Like the CPS, the ACS asks questions about the employment and unemployment of household members. These questions differ, however, from those posed in the CPS. In particular, respondents to the ACS are not asked about specific job search activities. The two surveys also have different approaches to defining their reference period and to accounting for the worker’s place of residence.13 Nonetheless, the fact that the ACS counts people (rather than nonfarm jobs) and that it provides estimates by place of residence (as well as place of work) means that that survey offers another tool for examining the effects of the recovery on New York City residents. Both surveys publish data on New York City as annual averages (and not on a monthly basis).
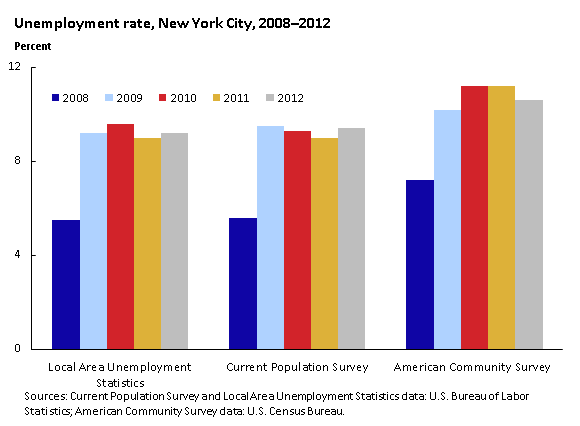
Chart 4 presents annual average unemployment rates from the ACS, along with rates from the LAUS models and the CPS. (The inclusion of both the LAUS and the CPS rates allows us to see the effects of the models on the survey’s annual averages.14) The chart begins with 2008 data because the ACS changed its questionnaire in that year to ask unemployed people if they actively looked for work—a question that is similar to that in the CPS; the chart ends with 2012 because that year’s data are the most current ACS data on unemployment.15 The LAUS unemployment rates differ from the CPS rates by tenths of a percentage point, indicating that the models had relatively small effects on the annual averages. In contrast, during the 2008–2012 period, the ACS measure exceeded the official estimates produced by the LAUS program by an average of 1.6 percentage points, although the difference was as much as 2.2 percentage points in 2011. The fact that the numbers differ is not surprising, given the difference in questions, collection methods, and samples between the ACS and LAUS series. The fact that the ACS numbers are higher than the estimates produced by the LAUS program and the CPS is also not surprising: generally, comparisons of ACS unemployment rates with CPS rates for the nation and for the states have found that the ACS rates were higher.16
For the purposes of this article, chart 4 is valuable because it shows that the ACS measure has followed the same general path as the LAUS and CPS measures. Specifically, the ACS indicates that a high unemployment rate in New York City persisted in 2011 despite the growth in nonfarm jobs. The ACS also indicates that the unemployment rate may have dropped slightly in 2012. However, the broader pattern of persistent high unemployment is still evident: in none of the three series is the unemployment rate for 2012 significantly lower than it was in 2009.
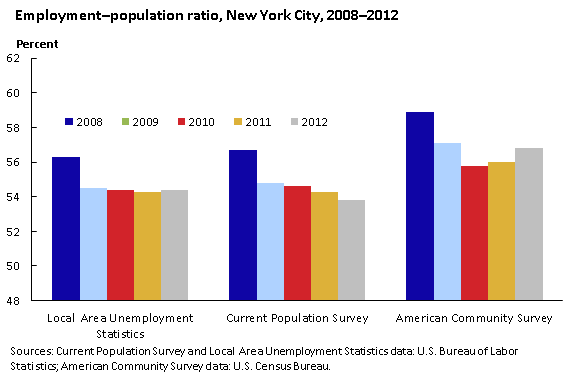
The LAUS measure indicates that the employment–population ratio for New York City residents dropped by 1.8 percentage points from 2008 to 2009 and has remained below 55 percent since then. Chart 5 shows that the comparable ACS measure, despite always being higher than the CPS measure, was little changed in 2011, although it rose slightly in 2012.17
The labor force participation rate, as measured by LAUS, was 59.5 percent in 2008 and has remained within 0.6 percentage point since then. Similarly, the ACS measure of the labor force participation rate has changed relatively little since 2008, remaining within 0.7 percentage point of the 2008 estimate of 63.5 percent.
The recent period of persistent high unemployment combined with strong growth in the number of payroll jobs in New York City (a period that began in October 2010 and extended through August 2013) is not unprecedented. During an earlier period, from December 1996 to May 1998, job growth was also robust and the arithmetic average of the unemployment rate was virtually the same as it has been during the period that started in October 2010. That earlier period was followed by a sustained period of lower unemployment.
Other characteristics of the labor market for these periods were not so similar. During the 1996–1998 period, the labor force participation rate and the employment–population ratio both rose. In contrast, during the most recent period both of these measures have been little changed. The labor force participation rate, for example, has remained within 0.5 percentage point of 59.6 percent during the recent recovery.
By contrast, nationally the labor force participation rate declined from 64.4 percent in October 2010 to 63.2 percent in August 2013. Thus, one of the reasons that the unemployment rate in New York City has remained high relative to the national rate is that New York City’s labor force participation rate, unlike the nation’s, has not declined.
Finally, data from the ACS confirm that the unemployment rate for residents of New York City was little changed in 2011. In that year, the large increase in payroll jobs had little effect on the employment–population ratio, as measured by both the CPS and the ACS, and the continued low level of the ratio is part of the reason that high unemployment has persisted. In 2012, the ACS indicated a slight improvement in the employment–population ratio and a dip in the unemployment rate, but the pattern of high unemployment remained.
This Beyond the Numbers summary was prepared by Martin Kohli, Chief regional economist in the New York Regional Office for Economic Analysis and Information, U.S. Bureau of Labor Statistics. Email: kohli.martin@bls.gov. Telephone: (646) 264-3620.
Information in this article will be made available to individual with sensory impairments upon request. Voice phone: (202) 691-5200. Federal Relay Service: 1-800-877-8339. This article is in the public domain and may be reproduced without permission.
Martin Kohli, “Persistence of a high unemployment rate in New York City during the recent recovery,” Beyond the Numbers: Regional Economies, vol. 3, no. 2 (U.S. Bureau of Labor Statistics, February 2014), https://www.bls.gov/opub/btn/volume-3/persistence-of-a-high-unemployment-rate-in-new-york-city.htm
1 The use of a different start date, October 2009, as designated by the coincident economic indicator of the New York Federal Reserve Bank, leads to similar numbers.
2 See James M. Borbely, “Sizing up the 2007–09 recession: comparing two key labor market indicators with earlier downturns,” Issues in Labor Statistics, Summary 10-11 (U.S. Bureau of Labor Statistics, December 2010), https://www.bls.gov/opub/btn/archive/sizing-up-the-200709-recession-comparing-two-key-labor-market-indicators-with-earlier-downturns-pdf.pdf. The National Bureau of Economic Research (NBER) also has noted that the unemployment rate often continues to rise after economic activity reaches a trough. See The NBER’s business cycle dating procedure: frequently asked questions (Cambridge, MA: National Bureau of Economic Research, updated daily), http://www.nber.org/cycles/recessions_faq.html.
3 See State of Working New York 2012: Disappointingly Weak Recovery (Albany, NY, and New York, NY: Fiscal Policy Institute, September 2, 2012), https://fiscalpolicy.org/wp-content/uploads/2012/09/fpi-SWNY-2012-data-show-a-disappointingly-weak-recovery.pdf; and Julie Anna M. Golebiewski, “Unraveling the discrepancy between city job growth & a high unemployment rate” (New York City Independent Budget Office, February 2013), http://www.ibo.nyc.ny.us/iboreports/febacsemployment2013.html. Both of these reports were issued before the employment and unemployment data for 2012 were benchmarked. The benchmarking produced a revised, lower level of the unemployment rate in New York City during the middle of 2012, but the pattern of strong job growth and a persistently high unemployment rate remained.
4 The periods of job loss and job gain in the city do not coincide neatly with the business cycle dates of the NBER. Because observers of the city’s economy focus on counts of jobs, this article will use periods of local job loss and job gain (rather than the NBER’s dates) as a framework for the analysis presented.
5 BLS does not have a general criterion for distinguishing periods of strong job growth from weak.
6 See State of Working New York and Golebiewski, “Unraveling.”
7 Labor force estimates for New York City are produced by the BLS Local Area Unemployment Statistics (LAUS) program. The models used to estimate employment and unemployment are designed to identify and remove sampling error in monthly data from the Current Population Survey (CPS). For more information on the LAUS estimation methodology, see “Estimation methodology,” Local Area Unemployment Statistics (U. S. Bureau of Labor Statistics, September 11, 2009), https://www.bls.gov/lau/laumthd.htm.
8 Monthly estimates of the labor force participation rate and the employment–population ratio for New York City (and a number of other subnational areas) are given in “Civilian noninstitutional population and associated rate and ratio measures for model-based areas,” Local Area Unemployment Statistics (U. S. Bureau of Labor Statistics, April 19, 2013), https://www.bls.gov/lau/rdscnp16.htm.
9 Golebiewski, “Unraveling.” See also Jason Bram and James Orr, “Good news or bad on New York City jobs?” Liberty Street Economics (New York: Federal Reserve Bank of New York, August 2012), http://libertystreeteconomics.newyorkfed.org/2012/08/good-news-or-bad-on-new-york-city-jobs.html.
10 See Mary Bowler and Teresa L. Morisi, “Understanding the employment measures from the CPS and the CES survey,” Monthly Labor Review, February 2006, pp. 23–38, https://www.bls.gov/opub/mlr/2006/02/art2full.pdf.
11 See Thomas Nardone, Mary Bowler, Jurgen Kropf, Katie Kirkland, and Signe Wetrogan, Examining the discrepancy in employment growth between the CPS and the CES, report to the Federal Economic Statistics Advisory Committee (U.S. Bureau of Labor Statistics and U.S. Census Bureau, October 17, 2003), https://www.bls.gov/advisory/fesacp2101703.pdf.
12 For a detailed discussion of the differences between the Bureau’s household and establishment surveys, see Bowler and Morisi, “Understanding the employment measures.”
13 For detailed discussions of the conceptual differences between the surveys, see Shail Butani, Charles Alexander, and James Esposito, Using the American Community Survey to enhance the Current Population Survey: opportunities and issues (U.S. Bureau of Labor Statistics, 1999), https://www.bls.gov/osmr/research-papers/1999/pdf/st990280.pdf ; and Braedyn K. Kromer and David J. Howard, Comparison of ACS and CPS data on Employment Status (U.S. Census Bureau), https://www.census.gov/hhes/www/laborfor/ACS-CPS_Comparison_Report.pdf. See also “American Community Survey (ACS) questions and answers,” Local Area Unemployment Statistics (U.S. Bureau of Labor Statistics, May 4, 2011), https://www.bls.gov/lau/acsqa.htm.
14 As earlier noted, the LAUS models of employment and unemployment are intended to remove sample error from the monthly CPS estimates.
15 See Kromer and Howard, Comparison of ACS and CPS data. Even with this change, the ACS question was considerably more general than questions in the CPS, which asked about specific types of job searches.
16 Ibid.
17 The figures for 2010, 2011, and 2012 were 55.8, 56.0, and 56.8 percent, respectively. In all 3 years, the 90-percent confidence interval was plus or minus 0.3 percentage point around the estimate.
Publish Date: Tuesday, February 18, 2014