An official website of the United States government
An official website of the United States government
The .gov means it's official.
Federal government websites often end in .gov or .mil. Before sharing sensitive information,
make sure you're on a federal government site.
The site is secure.
The
https:// ensures that you are connecting to the official website and that any
information you provide is encrypted and transmitted securely.

More BLS articles and information related to occupational employment are available online at the following links:
Although some occupations are found in nearly every industry in the United States, others are specific to one or only a few industries. For example, several of the most concentrated occupations in the coal mining industry are found primarily in that industry, and are uncommon outside of the mining and extraction sector. As a result, job mobility for these workers might be extremely limited in the face of an industry downturn, particularly one affecting the extraction industries in general. On the other hand, although over a quarter of computer systems analysts are found in the computer systems design and related services industry, this occupation was distributed relatively evenly across sectors, potentially allowing displaced workers to move more easily into other industries. Understanding the relationship between industry and occupation may provide important insights into workers’ ability to cope with job loss by moving across industries.
This BEYOND THE NUMBERS article uses two tools—the Herfindahl-Hirschman index (HHI) and industry quotients—to measure occupational specialization by industry. Although some industries use specialized labor highly intensively, others rely on less specialized occupations that are also prevalent elsewhere in the economy. These differences in industry staffing patterns may affect workers’ ability to respond effectively and flexibly to changes in the economy. Occupations concentrated in a single industry, such as travel agents or shoe machine operators and tenders, may require skills that are highly specific to that industry. If workers in these occupations become unemployed, it may be difficult for them to use their skills in other industries. However, workers in more widely distributed occupations may find it easier to transfer their skills in response to job loss. Occupational composition also may affect a growing industry's ability to attract workers from elsewhere in the economy. For example, industries that rely on specialized, highly qualified workers may find that the high skill and training requirements act as a barrier to entry for displaced workers from other sectors.
Several different measures are available for examining the industry and occupation relationship. Traditional tools include measuring the share of total occupational employment found in a given industry, as well as the share of total industry employment made up of a specific occupation. For instance, 62 percent of registered nurses were employed in hospitals in May 2012, and registered nurses made up 29 percent of total hospital employment, showing a strong relationship between this industry and occupation.
However, these statistics provide only a partial picture of the relationship between occupation and industry. For example, they don’t offer a convenient way of comparing which occupations are most and least concentrated by industry, nor do they allow for easy identification of industries that use specific occupations intensively. The HHI and industry quotients are additional tools that provide a complementary perspective on the industry and occupation relationship.
The HHI is normally used to measure market concentration among firms in an industry; here, it is used to provide an overall measure of occupational concentration by industry. In general, a higher HHI indicates that the occupation or occupational group was found primarily in a few industries, whereas a lower value indicates that the occupation or occupational group was spread more evenly across industries. An occupation or occupational group found entirely in a single industry will have an HHI with the maximum possible value of 10,000.1
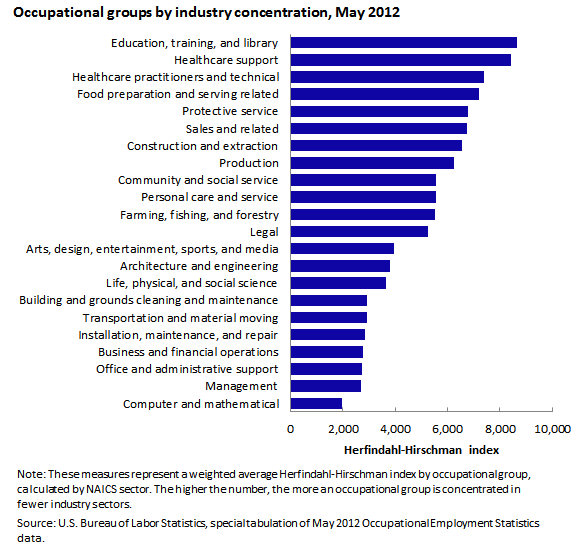
The concentration of occupational groups across industry sectors, based on an aggregated HHI, is shown in chart 1. The aggregated HHI for each occupational group is a weighted average of the HHIs for the individual detailed occupations in that group, with each occupation’s HHI weighted by the occupation’s share of total group employment. Thus, occupations with high employment levels have more influence than occupations with low employment levels on the aggregate HHI, allowing the aggregate index to reflect more closely the industry concentration patterns of the occupations that make up the majority of jobs in the group. In some cases, weighting had a substantial effect on the aggregate HHI. For example, if the HHI for the transportation and material moving group is constructed by taking a simple average of the indexes of its detailed occupations, the result is nearly 74 percent higher than the weighted average HHI shown in chart 1. This reflects, in part, the fact that the largest occupation in this group—laborers and hand freight, stock, and material movers—made up nearly a quarter of the occupational group employment and had one of the lowest industry concentrations of any transportation and material moving occupation. The aggregated HHIs also differ from HHIs constructed directly from the major group employment data in that the latter capture only the overall distribution of each group across industries, whereas averaging the occupation-specific HHIs incorporates the industry distribution of the detailed occupations within each group.2
The most widely dispersed occupational groups included computer and mathematical, management, office and administrative support, and business and financial operations occupations. These groups tend to contain jobs that are in demand in many types of businesses. For example, office and administrative support occupations such as executive secretaries and executive administrative assistants, customer service representatives, and general office clerks provide support functions applicable to a wide range of industries. Similar support occupations in the business and financial operations group include accountants and auditors; purchasing agents; and meeting, convention, and event planners.
Although the management group includes some highly specialized occupations, such as funeral service managers or lodging managers, other management occupations involve overseeing functional areas relevant to many industries, such as sales, marketing, purchasing, and finance. Nearly all of the computer and mathematical occupations were widely distributed across industry sectors. Except for actuaries, all of the occupations in this group had individual HHIs below 3,000, compared with only about one-quarter of occupations overall. Computer and mathematical occupations with the lowest industry concentrations included network and computer systems administrators, computer user support specialists, and database administrators.
Several of the most concentrated occupational groups had specialized job duties that were directly related to the primary activities of the industries in which they were concentrated. For example, 89 percent of education, training, and library jobs were in the educational services sector, and 88 percent of healthcare support jobs were in the health care and social assistance sector.3 Eighty-one percent of employment in food preparation and serving related occupations was in the accommodation and food services sector.
Although some occupational major groups were, on average, more concentrated than others, individual detailed occupations within a given group could vary greatly in their degrees of industry concentration. For example, the installation, maintenance, and repair group had an aggregated HHI of about 2,800, but HHIs for individual occupations within this group ranged from 855 for first-line supervisors of mechanics, installers, and repairers to 9,222 for bicycle repairers.
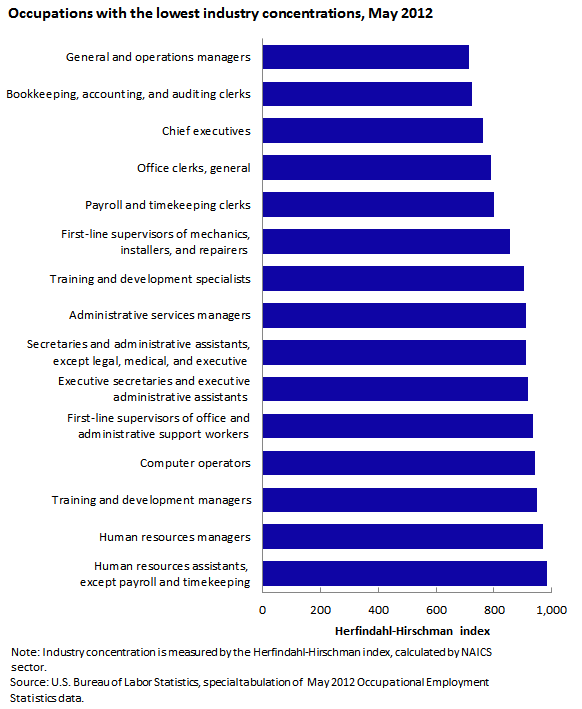
Detailed occupations that were spread most evenly across industry sectors, as measured by low HHIs, are shown in chart 2. These included two management occupations with broad job duties: chief executives and general and operations managers. Most of the remaining occupations shown were related to human resources or general office administration. Human resources occupations with low industry concentrations ranged from the managerial level through the clerical level, and included human resources managers; training and development managers; training and development specialists; human resources assistants, except payroll and timekeeping; and payroll and timekeeping clerks. Occupations associated with general office administration included administrative services managers; first-line supervisors of office and administrative support workers; computer operators; secretaries and administrative assistants, except legal, medical, and executive; executive secretaries and executive administrative assistants; general office clerks; and bookkeeping, accounting, and auditing clerks. Overall, these occupations may allow for more mobility among jobseekers as they look for jobs in various industries.
Detailed occupations with perfect or near-perfect concentration in a single industry sector, as indicated by HHIs of approximately 10,000, included a number of occupations specific to government, such as postmasters and mail superintendents, postal service mail carriers, and other postal service occupations; legislators; tax examiners and collectors, and revenue agents; judges, magistrate judges, and magistrates; and fish and game wardens. Postsecondary teaching occupations made up most of the remaining occupations with HHIs of about 10,000, reflecting their high concentration in the educational services sector. Such occupations may limit jobseekers to specific industries.
Aside from postsecondary teaching occupations and government-specific occupations, occupations with near-perfect industry concentration included mine shuttle car operators, mining roof bolters, orthodontists, funeral attendants, chiropractors, and shampooers. Many of these occupations were concentrated not only in a single industry sector, but in a specific detailed industry within that sector. For example, nearly all funeral attendants were employed in the death care services industry, part of the other services (except federal, state, and local government) sector.
HHIs for the occupations with the highest employment in May 2012 are shown in chart 3. Total employment in these occupations ranged from about 2.1 million for secretaries and administrative assistants, except legal, medical, and executive, to over 4.3 million for retail salespersons.
In terms of their industry concentrations, the occupations in chart 3 fall into two broad categories: half had HHIs of less than 2,500, while the remainder had much higher HHIs of approximately 7,000 to 9,000. Occupations in the first category tended to be spread across multiple industry sectors, where they were found in numbers sufficient to produce high overall employment levels. Occupations in this category were general office clerks; customer service representatives; laborers and freight, stock, and material movers, hand; janitors and cleaners, except maids and housekeeping cleaners; and secretaries and administrative assistants, except legal, medical and executive.
However, occupations found primarily in a single sector also could have very high employment levels, provided they made up a sufficiently large share of employment in the sectors in which they were concentrated. For example, registered nurses was the largest occupation in the largest industry sector, health care and social assistance. Eighty-seven percent of registered nurses were employed in this sector, where they made up about 1 out of every 8 jobs. Similarly, retail salespersons and cashiers combined made up about 45 percent of employment in the second-largest industry sector, retail trade, although fewer than 20 percent of cashiers and 10 percent of retail salespersons were employed outside of the retail trade sector.
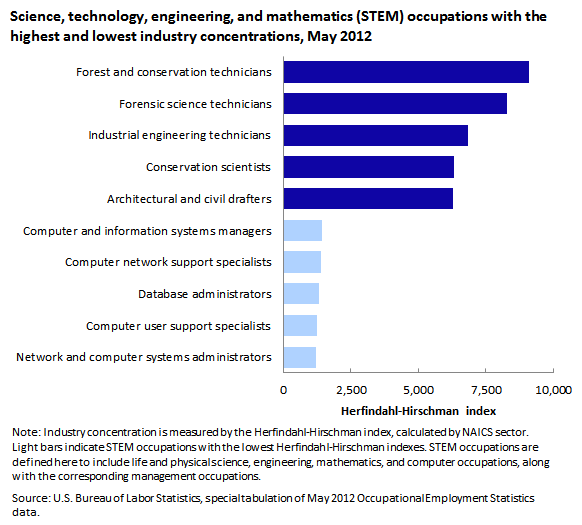
HHIs for a very different group of selected occupations—science, technology, engineering, and mathematics (STEM) occupations—are shown in chart 4. Unlike the largest occupations from chart 3, STEM occupations tended to be high paying: with the exception of forest and conservation technicians, all of the occupations in chart 4 had annual mean wages above the U.S. average of $45,790, while all of the largest U.S. occupations except registered nurses had below-average wages. However, like the largest U.S. occupations, STEM occupations varied greatly in their degrees of industry concentration.
Many of the most widely distributed STEM occupations were computer occupations, reflecting the importance of information technology to a variety of industries. Of the five STEM occupations with HHIs below 1,500, all were computer related: computer and information systems managers, computer network support specialists, database administrators, computer user support specialists, and network and computer systems administrators. Other computer occupations with low industry concentrations included computer systems analysts, web developers, and computer network architects (not shown in the chart). Outside of the computer group, STEM occupations with low industry concentrations included health and safety engineers, except mining safety engineers; electronics engineers, except computer; and electrical and electronics engineering technicians.
STEM occupations with the highest industry concentrations included forest and conservation technicians, forensic science technicians, industrial engineering technicians, conservation scientists, and architectural and civil drafters, all with HHIs of 6,000 or higher. Three of these occupations were found mainly in government. Ninety-six percent of forest and conservation technicians and 93 percent of forensic science technicians were employed in the public sector, with forest and conservation technicians found primarily in federal government and forensic science technicians found primarily in local government. Eighty-one percent of conservation scientists were employed in the public sector; nearly half of these jobs were in federal government, with the remainder split between state and local government. Seventy-nine percent of architectural and civil drafters were found in the professional, scientific, and technical services sector, primarily in the architectural, engineering, and related services industry. Seventy percent of industrial engineers were employed in manufacturing. Although no single manufacturing industry accounted for the majority of industrial engineers, manufacturing industries with the highest employment of this occupation included aerospace product and parts manufacturing; motor vehicle parts manufacturing; and navigational, measuring, electromedical, and control instruments manufacturing.
The HHI provides a useful summary statistic for measuring an occupation’s overall degree of industry concentration, but does not show the specific industries in which an occupation is used intensively. An alternative is to examine occupational concentrations using a variation of location quotients, a tool more commonly used to analyze data by geographic area. As used with respect to occupational employment data, the standard location quotient represents the ratio of an occupation’s share of area employment to its share of national employment. The variation used here, called an “industry quotient” for the purpose of this Beyond the Numbers article, represents the ratio of the occupation’s share of employment in a specific industry to its share of employment in all industries combined. An industry quotient greater than one indicates that the occupation makes up a greater share of industry employment than it does of overall employment. For example, an occupation that makes up 10 percent of employment in a given industry but only 2 percent of total employment would have an industry quotient of 5 for that industry, indicating the industry’s relative reliance on this type of labor is 5 times the average.
In geographic area analysis, high location quotients do not necessarily imply high employment levels of an occupation. Very large metropolitan areas, for example, tend to have high employment of most individual occupations, even if those occupations have lower shares of area employment relative to the national average. A similar caveat applies to industry quotients: a high industry quotient for an occupation indicates that the industry uses that occupation more intensively than average, but depending on the overall size of the industry, it may or may not have high absolute employment levels for that occupation. For example, the household appliance manufacturing industry had an industry quotient of 35 for team assemblers, but had employment of only about 15,000 in this occupation. By comparison, the much larger employment services industry had about 177,000 team assembler jobs, but had a much lower—although still above average—industry quotient of 7 for the occupation. For this reason, it is helpful to look at industry quotients in conjunction with other data, such as the actual number of jobs and the percentage of total occupational employment found in the industry.
Industry quotients varied considerably by occupation. For some widespread occupations, industry quotients were relatively low even in the industries in which these occupations were used most intensively. Chart 5 shows the industries with the highest industry quotients for bookkeeping, accounting, and auditing clerks, one of the occupations with the lowest overall industry concentrations as shown in chart 2. Bookkeeping clerks had industry quotients of 9 in the accounting, tax preparation, bookkeeping, and payroll services industry and 5 in the office administrative services industry. In both of these industries, the primary business activities were directly related to the job duties of this occupation. Bookkeeping clerks had an industry quotient of less than 4 in every other industry.
The highest industry quotients for other widespread occupations were similarly moderate. For example, the highest industry quotient for first-line supervisors of mechanics, installers, and repairers was about 14 (in the automotive repair and maintenance industry), and the highest industry quotient for human resources specialists was approximately 7 (in the employment services industry).
Where some of the highest industry quotients for some occupations were relatively low, industry quotients for other occupations ranged into the hundreds or even thousands. For example, shoe machine operators and tenders had an industry quotient of over 9,000 in the footwear manufacturing industry, and both fallers and logging equipment operators had industry quotients of over 2,000 in the logging industry. These industry quotients are extremely high because these occupations were highly concentrated in relatively small industries, but had low overall employment levels—in other words, the industry quotients had both high numerators and very low denominators. For example, shoe machine operators and tenders made up about 24 percent of employment in the small U.S. footwear manufacturing industry, but with total employment of about 3,400, this occupation represented less than .003 percent of total national employment.
Looking at industry quotients from the industry perspective reveals that some industries had several occupations with extremely high industry quotients, while in other industries, even the occupations with the highest industry quotients had only moderately high concentrations relative to the national average. These patterns suggest that industries vary considerably in their use of specialized, industry-specific labor.
The office administrative services industry is an example of an industry with a relatively low degree of occupational specialization. Even for the occupations used most intensively in this industry, industry quotients were moderate, ranging from nearly six for mail clerks and mail machine operators, except postal service to nine for both bill and account collectors and billing and posting clerks. (See chart 6.)
Although the occupations shown in chart 6 had above-average concentrations in the office administrative services industry, they made up only about 10 percent of total industry employment combined, and most jobs in these occupations were found in other industries. Of the occupations in chart 6, only billing and posting clerks, with industry employment of 13,650, and bill and account collectors (10,720) were among the largest occupations in the office administrative services industry. Credit counselors, training and development managers, and private detectives and investigators each had industry employment of less than 1,000. By comparison, customer service representatives, the largest occupation in the office administrative services industry, had industry employment of over 34,000. In addition, the office administrative services industry accounted for less than 3 percent of total employment in each of the occupations in chart 6.
The occupations with the highest industry quotients in the computer systems design and related services industry are shown in chart 7. The majority of these occupations were from the computer and mathematical occupational group. The only occupation from outside of this group, computer hardware engineers, also had job duties directly related to information technology. Although still moderate compared with those in many other industries, the highest industry quotients in computer systems design and related services were higher than those in office administrative services, ranging from about 17 for computer network support specialists, computer hardware engineers, and web developers to 32 for computer programmers.
Compared with office administrative services, the computer systems design and related services industry employed a more substantial share of the occupations used intensively in the industry, and these occupations made up a higher percentage of total industry employment. The occupations in chart 7 combined made up 45 percent of total employment in computer systems design and related services. Four of the occupations with the highest industry quotients also were the four largest occupations in the industry: applications software developers, with industry employment of 199,080; computer systems analysts (136,910); systems software developers (125,250); and computer programmers (122,790). In addition, the computer systems design and related services industry accounted for more than one-fifth of total occupational employment in each of the occupations shown in chart 7, rising to 34 percent for applications software developers and 39 percent for computer programmers.
However, the occupations shown in chart 7 were still widely found outside of computer systems design. For example, occupations like web developers, computer systems analysts, and computer network architects were associated with IT support functions in many industries, while computer network support specialists was among the STEM occupations most widely distributed across industries, as shown in chart 4.
In contrast to the industries featured in charts 6 and 7, coal mining is an example of an industry containing occupations that were both very intensively used and highly industry specific, as shown in chart 8. All of the most intensively used occupations in the coal mining industry had job duties directly related to the mining process, and most had limited employment outside of the extraction sector. Three occupations had industry quotients of over 1,000 in the coal mining industry, and a fourth occupation had an industry quotient of nearly 800. Two of these four occupations—mine shuttle car operators and mining roof bolters—were nearly exclusive to the coal mining industry, which contained 96 percent of employment in each occupation. Underground mining loading machine operators and continuous mining machine operators also were found primarily in coal mining, which accounted for 71 percent and 54 percent, respectively, of employment in these two occupations.
The remaining occupations in chart 8 had industry quotients ranging from 145 for excavating and loading machine and dragline operators to 575 for mine cutting and channeling machine operators. Of the occupations in chart 8, only mining and geological engineers and excavating and loading machine and dragline operators had significant employment outside of the mining sector. Thirty percent of mining and geological engineers worked in the architectural, engineering, and related services industry, compared with 44 percent in coal mining and other mining and extraction industries. About 43 percent of excavating and loading machine and dragline operators were employed in the construction sector, compared with about 31 percent in mining and extraction industries. Eighty-five percent or more of employment in the remaining four occupations—mine cutting and channeling machine operators, all other mining machine operators, all other extraction workers, and extraction worker helpers—was found in coal mining or other mining and extraction industries.
Although identifying the industries with the highest employment of each occupation is a good first step, the HHI and industry quotients offer additional perspectives on industry staffing patterns, helping to provide a more accurate picture of the distribution of occupations across industries. Such information could be useful for workers as they choose a career, jobseekers as they narrow or broaden their job searches, and employers as they try to recruit workers from other industries, based on the HHI and industry quotient for a particular occupation.
This BEYOND THE NUMBERS article was prepared by Audrey Watson, economist, in the office of Occupational Employment Statistics. Complete OES data, including data highlighted in this report, are available from the OES website at www.bls.gov/oes/. Email: OESinfo@bls.gov; Telephone: (202) 691-6569.
Information in this article will be made available to sensory-impaired individuals upon request. Voice phone: (202) 691-5200. Federal Relay Service: 1-800-877-8339. This article is in the public domain and may be reproduced without permission.
Audrey Watson, “Measuring occupational concentration by industry,” Beyond the Numbers: Employment & Unemployment, vol. 3, no. 3 (U.S. Bureau of Labor Statistics, February 2014), https://www.bls.gov/opub/btn/volume-3/measuring-occupational-concentration-by-industry.htm
Industry. A group of business establishments that produce similar products or provide similar services. For example, all establishments that manufacture automobiles are in the same industry. A given industry, or even a particular establishment in that industry, might have employees in dozens of occupations. Industry classification in the May 2012 OES data is based on the 2012 North American Industry Classification System (NAICS).
Occupation. A set of activities or tasks that employees are paid to perform. Employees that perform essentially the same tasks are in the same occupation, whether or not they work in the same industry. Some occupations are concentrated in a few particular industries; other occupations are found in many industries. The May 2012 OES data use the 2010 Standard Occupational Classification (SOC) system to classify jobs into occupations.
1 The standard version of the Herfindahl-Hirschman index is calculated by squaring each firm’s market share and then summing the results. For example, a market containing five firms with shares of 10, 15, 20, 25, and 30 percent would have an HHI of (10)2 + (15)2 + (20)2 + (25)2 + (30)2 = 100 + 225 + 400 + 625 + 900 = 2,250. For the purpose of this Beyond the Numbers article, market shares were replaced in the calculation by the shares of the occupation’s total employment found in each industry. An occupation with 100 percent of its employment in a single industry would have an HHI of (100)2 = 10,000. Herfindahl-Hirschman indexes presented in this section were calculated based on 2010 Standard Occupational Classification (SOC) detailed occupations and 2012 North American Industry Classification System (NAICS) 2-digit sectors and supersectors.
2 For example, consider an occupational major group consisting of four detailed occupations, each with employment of 100, distributed among four industries. At one extreme, the occupations could be distributed so that each industry contains all of the employment in one of the occupations; alternatively, each industry could contain 25 jobs in each of the four occupations. In the first scenario, because each occupation is perfectly concentrated in a single industry, each of the individual occupations has a Herfindahl-Hirschman index of 10,000; taking an average of the individual HHIs (either weighted or unweighted, in this example) produces an average HHI for the major group of 10,000. In the second case, each industry contains 25 percent of each occupation, so each of the individual occupations has an HHI of (25)2 + (25)2 + (25)2 + (25)2 = 2,500, and the (weighted or unweighted) average HHI for the group is also 2,500. However, in both cases, employment in each industry is 100, or 25 percent of total major group employment, and constructing the HHI directly from the major group data will result in an index of 2,500 for the major group, regardless of the very different distributions of the individual detailed occupations in the two scenarios.
3 OES data for the educational services sector include private, state, and local government schools; data for the health care and social assistance sector include private sector establishments and state and local government hospitals.
Publish Date: Wednesday, February 19, 2014