An official website of the United States government
An official website of the United States government
The .gov means it's official.
Federal government websites often end in .gov or .mil. Before sharing sensitive information,
make sure you're on a federal government site.
The site is secure.
The
https:// ensures that you are connecting to the official website and that any
information you provide is encrypted and transmitted securely.
More BLS articles and information related to the Producer Price Index Final Demand–Intermediate Demand system are available online at the following links:
“Comparing new final-demand producer price indexes with other government-price indexes,” Monthly Labor Review.
“Analyzing price movements within the Producer Price Index final demand–intermediate demand system,” Monthly Labor Review.
The release of January 2014 Producer Price Index (PPI) data marks the transition from the Stage of Processing (SOP) aggregation system to the Final Demand–Intermediate Demand (FD–ID) aggregation system. The transition to the FD–ID system is the culmination of a longstanding PPI objective to improve upon the SOP aggregation system by incorporating price data for services, construction, government purchases, and exports. In comparison to the SOP system, the FD-ID system more than doubles PPI coverage of the U.S. economy to over 75 percent of in-scope domestic production.
The FD–ID system highlights the index for final demand. Examples of final-demand goods include pharmaceutical preparations destined for personal consumption, construction machinery and equipment for private capital investment, diesel fuel and jet fuel for government, and organic chemicals for export. Examples of final-demand services include consumer loan services, apparel retailing margins, passenger air transportation, wired and wireless telecommunication services for government, wholesale margins from machinery and equipment sold for capital investment, and wholesale margins from organic chemicals sold for export. Examples of final-demand construction include new school construction and new hospital construction.1
The FD–ID system also includes two separate parallel treatments of intermediate demand: price changes for goods, services, and construction sold to business as inputs to production. One treatment, intermediate demand by type of commodity, measures price changes on the basis of similarity of product and includes aggregate indexes for processed goods for intermediate demand, unprocessed goods for intermediate demand, and services for intermediate demand. The other treatment, intermediate demand by production flow, is a stage-based system of price indexes in which price changes for goods, services, and construction can be studied as they move through the production chain of the economy to final demand. This treatment includes four stages of intermediate demand, which were established to maximize the forward flow of production through the economy while minimizing backflow of production.2
This issue of Beyond the Numbers presents 2013 PPI data based on the new FD–ID system. The PPI estimates shown with this system represent the beginning of wider coverage by the index, to be continued in subsequent issues.
| Index | 2012 | 2013 |
|---|---|---|
|
Final demand price index |
||
|
Final demand |
1.9 | 1.1 |
|
Goods for final demand |
1.4 | 0.7 |
|
Foods |
4.1 | –1.1 |
|
Energy goods |
–1.3 | 1.0 |
|
Goods less foods and energy |
1.4 | 1.1 |
|
Services for final demand |
2.2 | 1.3 |
|
Trade services |
3.8 | –0.1 |
|
Transportation and warehousing services |
2.7 | 1.6 |
|
Services less trade, transportation, and warehousing |
1.4 | 1.9 |
|
Construction for final demand |
1.4 | 3.0 |
|
Intermediate demand, by type of commodity |
||
|
Processed goods for intermediate demand |
0.4 | 0.0 |
|
Processed foods and feeds |
7.2 | –3.1 |
|
Processed energy goods |
–2.8 | –1.3 |
|
Processed materials less foods and energy |
0.6 | 0.8 |
|
Unprocessed goods for intermediate demand |
1.4 | –2.1 |
|
Unprocessed foodstuffs and feedstuffs |
10.6 | –6.2 |
|
Unprocessed energy materials |
–4.5 | 4.4 |
|
Unprocessed nonfood materials less energy |
–1.6 | –5.9 |
|
Services for intermediate demand |
2.9 | 1.0 |
|
Trade services for intermediate demand |
7.1 | –1.5 |
|
Transportation and warehousing services for intermediate demand |
3.3 | 2.2 |
|
Services less trade, transportation, and warehousing for intermediate demand |
1.6 | 1.6 |
|
Construction for intermediate demand |
1.0 | 1.9 |
|
Intermediate demand, by production flow |
||
|
Stage-4 intermediate demand |
1.9 | 0.8 |
|
Total goods inputs to stage-4 intermediate demand |
1.2 | 0.3 |
|
Total services inputs to stage-4 intermediate demand |
2.5 | 1.4 |
|
Stage-3 intermediate demand |
1.5 | 0.4 |
|
Total goods inputs to stage-3 intermediate demand |
1.0 | 0.2 |
|
Total services inputs to stage-3 intermediate demand |
2.1 | 1.0 |
|
Stage-2 intermediate demand |
0.5 | –0.3 |
|
Total goods inputs to stage-2 intermediate demand |
–2.0 | –0.4 |
|
Total services inputs to stage-2 intermediate demand |
3.8 | –0.1 |
|
Stage-1 intermediate demand |
1.0 | 0.2 |
|
Total goods inputs to stage-1 intermediate demand |
–1.3 | –1.0 |
|
Total services inputs to stage-1 intermediate demand |
4.1 | 2.1 |
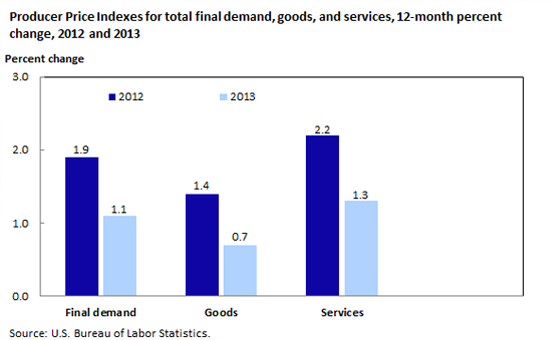
The PPI for final demand advanced 1.1 percent in 2013 after rising 1.9 percent in 2012. Almost three-quarters of the slower rate of increase can be traced to prices for final-demand services, which moved up 1.3 percent following a 2.2-percent gain the previous year. The index for final-demand goods also rose less than it did in 2012, 0.7 percent compared with 1.4 percent. (See chart 1.) In contrast, prices for final-demand construction climbed 3.0 percent in 2013 after moving up 1.4 percent the previous year. Within intermediate demand, the index for processed goods was unchanged following a small increase in 2012, prices for unprocessed goods turned downward in 2013, and the index for services moved up at a slower rate than it did the previous year. (See table 1.)
Leading the deceleration in producer inflation in 2013, prices for final-demand services and for services for intermediate demand rose less than they did in 2012. Within services, the indexes for both final-demand trade services and intermediate-demand trade services turned downward in 2013. (Trade indexes in the PPI measure average changes in margins received by wholesalers and retailers.3) The downturn in trade margins was heavily influenced by activity in the retail sales sector. Retail sales increased 4.2 percent in 2013, compared with larger advances of 5.4 percent in 2012 and 7.5 percent in 2011.4 Retail sales excluding the motor vehicle sector moved up at a modest 3.2-percent rate in 2013, following a 4.9-percent increase in 2012. In contrast, sales in motor vehicles and related parts climbed 8.7 percent in 2013, surpassing the 7.7-percent rise in 2012.5 The PPIs for both final-demand and intermediate-demand transportation and warehousing services rose less in 2013 than they did the previous year. Prices for transportation and warehousing services often change in response to contract adjustment formulas structured in accordance with a base price–fuel adjustment factor mechanism.6 In 2013, the index for gasoline fell 1.0 percent and prices for diesel fuel declined 0.9 percent.
From the perspective of goods, food prices turned downward consistently within final demand, intermediate-demand processed goods, and intermediate-demand unprocessed goods. Prices for corn and soybeans exhibited steep declines, following large increases the previous year. Corn production jumped 29.2 percent, to 12.925 billion bushels in 2013, compared with a drought-induced 12.8-percent drop in production in 2012. Similarly, soybean production rose 8.4 percent, to 3.289 billion bushels in 2013, after declining 1.9 percent a year earlier.7 Moving through the production chain reveals that the indexes for prepared animal feeds, beef and veal, and processed young chickens also turned downward after rising in 2012. In contrast, the indexes for final-demand energy goods and unprocessed energy materials turned upward in 2013, while prices for processed energy goods declined less than they had in 2012.
Final-demand services. In 2013, the slower rate of increase in the index for final demand can be traced primarily to the index for final-demand services. That index rose 1.3 percent after climbing 2.2 percent in 2012. Within final-demand services, the slower rate of advance was led by margins for final-demand trade services, which edged down 0.1 percent after rising 3.8 percent the previous year. Also contributing to the deceleration in inflation for final-demand services, the index for final-demand transportation and warehousing services increased 1.6 percent following a 2.7-percent rise in 2012. In contrast, prices for final-demand services less trade, transportation, and warehousing advanced 1.9 percent after a 1.4-percent climb the previous year.
Services detail. The advance in margins for apparel wholesaling slowed to 2.0 percent in 2013, from a 24.3-percent increase the previous year. The indexes for truck transportation of freight and inpatient care also rose less than they did in 2012. Margins for fuels and lubricants retailing turned downward after rising a year earlier. In contrast, the index for securities brokerage, dealing, investment advice, and related services increased 2.9 percent following a 2.2-percent decline in 2012. Margins for flooring and floor coverings retailing also turned upward in 2013.
Final-demand goods. The increase in the index for final-demand goods slowed to 0.7 percent in 2013, after a 1.4-percent increase in 2012. In 2013, prices for final-demand goods less foods and energy advanced 1.1 percent, compared with a 1.4-percent increase the previous year. The index for final-demand foods fell1.1 percent after jumping 4.1 percent in 2012. In contrast, prices for final-demand energy rose 1.0 percent subsequent to a 1.3-percent decline the previous year.
Product detail. Price increases for motor vehicles slowed to 1.2 percent in 2013, from 2.3 percent the previous year. The indexes for corn; prepared animal feeds; and hay, hayseeds, and oilseeds turned downward after rising in 2012. In contrast, prices for liquefied petroleum gas rose 5.2 percent in 2013 following a 26.4-percent drop a year earlier. The index for fresh and dry vegetables also increased after declining in 2012.
Finished goods. The finished-goods index is a special grouping that represents about two-thirds of final-demand goods through the exclusion of the weight for government purchases and exports. The finished-goods index constitutes about one-quarter of overall final demand. The index for finished goods moved up 1.2 percent in 2013, subsequent to a 1.4-percent increase a year earlier. In 2013, higher prices for pharmaceutical preparations, motor vehicles, residential electric power, and fresh and dry vegetables outweighed falling prices for processed young chickens and electronic computers and computer equipment.
Intermediate demand includes goods, services, and maintenance and repair construction sold to businesses, excluding capital investment. BLS publishes two parallel treatments of intermediate demand, each constructed from the identical set of commodity price indexes. One treatment organizes commodities according to their type, and the other organizes commodities in accordance with a stage-based, production flow model.
Processed goods for intermediate demand. The index for processed goods for intermediate demand was unchanged in 2013, following a 0.4-percent rise in 2012. The index for processed foods and feeds fell 3.1 percent in 2013, compared with a 7.2-percent jump in the previous 12-month period. In contrast, price declines for processed energy goods slowed to 1.3 percent, from 2.8 percent in 2012. The index for processed materials less foods and energy moved up 0.8 percent in 2013, after increasing 0.6 percent the previous year.
Product detail. Within the index for processed goods for intermediate demand, prices for prepared animal feeds dropped 8.4 percent in 2013, compared with a 20.3-percent rise a year earlier. The indexes for industrial electric power, diesel fuel, and particleboard and fiberboard also turned down after rising in 2012. In contrast, prices for jet fuel advanced 0.9 percent in 2013 following a 5.4-percent decline the previous year. The index for steel mill products dropped less than in 2012.
Unprocessed goods for intermediate demand. Prices for unprocessed goods for intermediate demand declined 2.1 percent in 2013, after rising 1.4 percent in 2012. Leading the downturn, the index for unprocessed foodstuffs and feedstuffs fell 6.2 percent after jumping 10.6 percent a year earlier. Prices for unprocessed nonfood materials less energy dropped 5.9 percent in 2013, following a 1.6-percent decline the previous year. In contrast, the index for unprocessed energy materials rose 4.4 percent subsequent to a 4.5-percent decrease in 2012.
Product detail. Leading the downturn in the index for unprocessed goods for intermediate demand, prices for corn decreased 41.3 percent in 2013 after climbing 23.6 percent in 2012. The indexes for hay, hayseeds, and oilseeds; gold ores; and coal also turned downward in 2013. In contrast, prices for crude petroleum advanced 7.4 percent, compared with an 11.0-percent decrease in 2012. The index for carbon steel scrap also increased in 2013 after falling a year earlier.
Services for intermediate demand. In 2013, the rise in the index for services for intermediate demand slowed to 1.0 percent, from 2.9 percent in 2012. The index for transportation and warehousing services for intermediate demand rose less, advancing 2.2 percent, compared with a 3.3-percent increase in 2012. Margins for trade services for intermediate demand fell 1.5 percent, following a 7.1-percent rise the previous year. Prices for services less trade, transportation, and warehousing for intermediate demand climbed 1.6 percent in 2013, the same rate as in 2012.
Services detail. Among services for intermediate demand, the rise the prices for truck transportation of freight slowed to 0.2 percent in 2013 from 3.2 percent the previous year. The indexes for metals, minerals, and ores wholesaling; paper and plastics product wholesaling; and television advertising time sales turned downward after advancing in 2012. In contrast, the index for securities brokerage, dealing, investment advice, and related services rose 2.9 percent in 2013 following a 2.2-percent decline the previous year. Prices for airline passenger services rose more than in 2012.
Stage-4 intermediate demand. The stage-4 intermediate-demand index measures price changes for products purchased by industries that primarily produce output sold to final demand. The advance in the index for stage-4 intermediate demand slowed to 0.8 percent in 2013, from 1.9 percent in 2012. In 2013, prices for total services inputs to stage-4 intermediate demand rose 1.4 percent, following a 2.5-percent increase the previous year, and the index for total goods inputs climbed 0.3 percent, after moving up 1.2 percent in 2012. Prices for truck transportation of freight rose less in 2013 than they had the previous year. The indexes for corn; metals, minerals, and ores wholesaling; and paper and plastics products wholesaling turned downward after large increases in 2012. In contrast, the index for securities brokerage, dealing, investment advice, and related services, as well as the index for jet fuel, turned upward in 2013 following decreases a year earlier.
Stage-3 intermediate demand. The stage-3 intermediate-demand index measures price changes for products purchased by industries that primarily produce output sold to industries classified into stage 4. In 2013, the index for stage-3 intermediate demand rose 0.4 percent, following a 1.5-percent increase in 2012. Price advances for total services inputs to stage-3 intermediate demand slowed to 1.0 percent, from 2.1 percent in 2012, and the index for total goods inputs edged up 0.2 percent in 2013 after advancing 1.0 percent the previous year. The index for air mail and package delivery services (excluding USPS) rose less in 2013 than in 2012. Prices for slaughter chickens, corn, and industrial electric power turned downward in 2013 after rising the previous year. In contrast, the index for steel mill products fell less, and prices for staffing services rose more, in 2013 than in 2012.
Stage-2 intermediate demand. The stage-2 intermediate-demand index measures price changes for products purchased by industries that primarily produce output sold to industries classified into stage 3. In 2013, the index for stage-2 intermediate demand declined 0.3 percent, after rising 0.5 percent in 2012. Prices for total services inputs to stage-2 intermediate demand fell 0.1 percent in 2013, following a 3.8-percent increase the previous year. In contrast, the decrease in the index for total goods inputs slowed to 0.4 percent from 2.0 percent in 2012. The indexes for metals, minerals, and ores wholesaling; corn; prepared animal feeds; and paper and plastics products wholesaling turned downward in 2013 after rising the previous year. In contrast, prices for crude petroleum and securities brokerage, dealing, investment advice, and related services rose following decreases in 2012.
Stage-1 intermediate demand. The stage-1 intermediate-demand index measures price changes for products purchased by industries that primarily produce output sold to industries classified into stage 2. The index for stage-1 intermediate demand rose 0.2 percent in 2013, after advancing 1.0 percent in 2012. Price increases for total services inputs to stage-1 intermediate demand slowed to 2.1 percent, from 4.1 percent in 2012. In contrast, the index for total goods inputs fell 1.0 percent in 2013 after a 1.3-percent decline the previous year. The increase in prices for rail transportation of freight and mail slowed in 2013. The indexes for industrial electric power; paper and plastics products wholesaling; and metals, minerals, and ores wholesaling turned downward after rising in 2012. In contrast, the indexes for carbon steel scrap and for securities brokerage, dealing, investment advice, and related services rose in 2013 after falling the previous year.
This Beyond the Numbers article was prepared by Joseph Kowal, Lana Borgie, Brian Hergt, and Antonio Lombardozzi, economists in the Producer Price Index Program. Email: ppi-info@bls.gov. Telephone: 202-691-7705.
Information in this article will be made available upon request to individuals with sensory impairments. Voice phone: (202) 691-5200. Federal Relay Service: 1-800-877-8339. The article is in the public domain and may be reproduced without permission.
Joseph Kowal, Lana Borgie, Brian Hergt, and Antonio Lombardozzi, “Improvements to the Producer Price Index measure: the Final-Demand–Intermediate-Demand system,” Beyond the Numbers: Prices & Spending, vol. 3, no. 4 (U.S. Bureau of Labor Statistics, February 2014), https://www.bls.gov/opub/btn/volume-3/improvements-to-the-producer-price-index.htm
1 The FD–ID system was first introduced as a set of experimental indexes in January 2011. Nearly all new FD–ID goods, services, and construction indexes provide historical data back to either November 2009 or April 2010, and the indexes for goods that correspond with the historical SOP indexes go back to the 1970s or earlier. For more information about the FD–ID system, see “A new, experimental system of indexes from the PPI program,” Monthly Labor Review, February 2011, pp. 3–24, https://www.bls.gov/opub/mlr/2011/02/art1full.pdf; or Producer price indexes: PPI Final Demand–Intermediate Demand (FD–ID) aggregation system (U.S. Bureau of Labor Statistics, February 3, 2014), https://www.bls.gov/ppi/fdidaggregation.htm. For more detail about overall PPI methodology, see “Chapter 14. Producer Prices,” BLS Handbook of Methods (U.S. Bureau of Labor Statistics), https://www.bls.gov/opub/hom/pdf/homch14.pdf.
2 The intermediate demand indexes titled “Processed Goods for Intermediate Demand” and “Unprocessed Goods for Intermediate Demand” are equivalent to the SOP indexes titled “Intermediate Materials, Supplies, and Components” and “Crude Materials for Further Processing.”
3 “Wholesale and retail Producer Price Indexes: margin prices,” Beyond the numbers: prices and spending (U.S. Bureau of Labor Statistics, August 2012, https://www.bls.gov/opub/btn/volume-1/pdf/wholesale-and-retail-producer-price-indexes-margin-prices.pdf.
4 Monthly and annual retail trade (U.S. Census Bureau, January 14, 2014), https://www.census.gov/retail. Data for December 2013 are provided under the section titled “Advance monthly retail trade report.” For historical data, an Excel file is provided under the heading “Monthly retail trade report.” Data for 2013 described in the analysis presented in this Beyond the Numbers article were taken from the advance report, downloaded January 16, 2014; the remainder of the data presented was extracted from the historical Excel file.
5 In 2010 and 2011, retail sales of motor vehicles and related parts increased 10.7 percent and 9.9 percent, respectively. From the sector’s low point in 2009, during the 2007–2009 recession, to the close of 2013, retail sales of motor vehicles and related parts jumped 42.4 percent.
6 “The impact of fuel surcharges on the PPI,” Focus on prices and spending, Producer Prices Index: second quarter 2011 (U.S. Bureau of Labor Statistics, August 2011), https://www.bls.gov/opub/focus/volume2_number6/ppi_2_6.pdf.
7 Tom Capehart, Edward Allen, and Jennifer Bond, “Corn and sorghum production and carryout down for 2013/14,” Feed outlook, Economic Research Service Situation and Outlook Report FDS-14a (U.S. Department of Agriculture January 2014), see especially table 1, p. 13, http://www.ers.usda.gov/ersDownloadHandler.ashx?file=/media/1256968/fds_14a.pdf; , and Mark Ash, “Record demand is seen for U.S. soybeans in first quarter of 2013/14,” Oil crops outlook, Economic Research Service Situation and Outlook Report OCS-14a (U.S. Department of Agriculture, January 14, 2014), see especially table 1, p. 8, http://www.ers.usda.gov/ersDownloadHandler.ashx?file=/media/1256457/ocs14a.pdf.
Publish Date: Wednesday, February 26, 2014