An official website of the United States government
An official website of the United States government
The .gov means it's official.
Federal government websites often end in .gov or .mil. Before sharing sensitive information,
make sure you're on a federal government site.
The site is secure.
The
https:// ensures that you are connecting to the official website and that any
information you provide is encrypted and transmitted securely.

More BLS articles and information on employment and unemployment are available online at the following links:
Long-term unemployment over men's careers, Beyond the Numbers
Young adult employment during the recent recession, Issues in Labor Statistics
Over the past four decades, the labor force has changed dramatically. Women’s labor market participation rates have risen, and women are increasingly working throughout their adult lives. One consequence of these changes is that men’s and women’s roles have been converging, with men taking a more active role at home, doing a greater share of housework and child care, and women spending more time in paid work.1
It is still common, however, for women to take time out of the labor force when they have children.2 With the trend toward shared responsibilities in the home between the genders, are young men increasingly spending more time out of the labor force after the birth of a child?
This Beyond the Numbers article examines work patterns in the lives of young adults in the year after they have their first child. Using data from the National Longitudinal Survey of Youth of 1997 and 1979 (NLSY97 and NLSY79 respectively), we compare men and women born between 1980 and 1984 with men and women born between 1957 and 1964 to see how labor force participation among new moms and dads has changed.3 This analysis looks at individuals who had a first child between the ages of 18 and 24 and compares them to individuals of the same age without children.4 The NLSY975 and NLSY796 collect information about the timing of births and individuals’ weekly work history, allowing for a comparison of labor force participation after the birth of a child.We analyze how different variables, such as age, educational status, employment status, race and ethnicity, and presence of fathers and mothers in the household, influence the labor market experience of young parents.
Our data indicate that although women typically continue to take more time out of the labor force after the birth of a child than do men, differences have been narrowing. However, this narrowing is largely the result of increased labor force participation of mothers in the year after giving birth, rather than decreased labor force participation among new fathers.
By the age of 25, 33.9 percent of the NLSY97 respondents had a child,7 compared with 37.4 percent of the NLSY79 respondents. For both cohorts, women were more likely to have a child by the time they were 25 than were men. (See table 1.)
| Gender | 1979 Cohort | 1997 Cohort |
|---|---|---|
|
Total |
37.4 | 33.9 |
|
Men |
29.8 | 26.9 |
|
Women |
45.2 | 41.3 |
|
Source: U.S. Bureau of Labor Statistics, National Longitudinal Survey of Youth 1979 and 1997. |
||
The percentage of respondents who had a child by age 25 differed by race and Hispanic or Latino ethnicity,8 with White respondents being less likely to have a child by 25 than Black or Hispanic respondents.9 Although each race and ethnicity group conformed to overall trends of reduced childbearing by age 25 in the more recent cohort, Hispanic men’s reductions were greater than Hispanic women’s reductions. (See chart 1.) The reduction in the total percentage of all 25-year-olds who had a child was smaller than the reduction in any of the three race and ethnicity groups. This is because Black and Hispanic or Latino individuals were more likely to have children before 25 in each cohort, and they represent a larger proportion of the sample in the 1997 cohort.
Young men and women both showed increases in average educational attainment from the 1979 cohort to the 1997 cohort, but women had larger increases. (Table 2 shows educational attainment for women and men at 25.) The percentage of individuals having less than a high school diploma or only a high school diploma decreased between the 1979 and 1997 cohorts, and a much higher percentage of the cohorts had either some college or a bachelor’s degree or higher in the 1997 cohort. Both women and men were more likely to have some college in the 1997 cohort, but the increase in the fraction of women receiving a bachelor’s degree exceeded the increase in the fraction of men receiving a degree. From the 1979 to the 1997 cohort, women’s attainment of a bachelor’s degree increased by almost 10 percentage points, whereas for men, the increase was less than 1 percentage point.
| Education | Women | Men | ||
|---|---|---|---|---|
| 1979 Cohort | 1997 Cohort | 1979 Cohort | 1997 Cohort | |
|
Less than a high school diploma |
11.4 | 8.7 | 14.1 | 9.8 |
|
High school diploma |
45.9 | 22.6 | 44.7 | 31.6 |
|
Some college |
22.8 | 39.1 | 21.5 | 38 |
|
Bachelor’s degree or higher |
19.9 | 29.5 | 19.7 | 20.5 |
|
Source: U.S. Bureau of Labor Statistics, National Longitudinal Survey of Youth 1979 and 1997. |
||||
Those respondents who achieved more education were less likely to have a child by age 25, indicating a strong association between education and parenthood. By age 25, very few mothers or fathers had a bachelor’s degree or higher, compared with men and women without children. For example, in 1997, of those women with a bachelor’s degree or higher, fewer than 10 percent were mothers. (See table 3.)
| Education | Women | Men | ||
|---|---|---|---|---|
| 1979 Cohort | 1997 Cohort | 1979 Cohort | 1997 Cohort | |
|
Less than high school diploma |
82.9 | 77.9 | 54.5 | 55.8 |
|
High school diploma |
58.4 | 65.4 | 36.8 | 38.1 |
|
Some college |
32.9 | 43.1 | 22.7 | 22.2 |
|
Bachelor’s degree or higher |
7 | 9.2 | 4.6 | 5 |
|
Source: U.S. Bureau of Labor Statistics, National Longitudinal Survey of Youth 1979 and 1997. |
||||
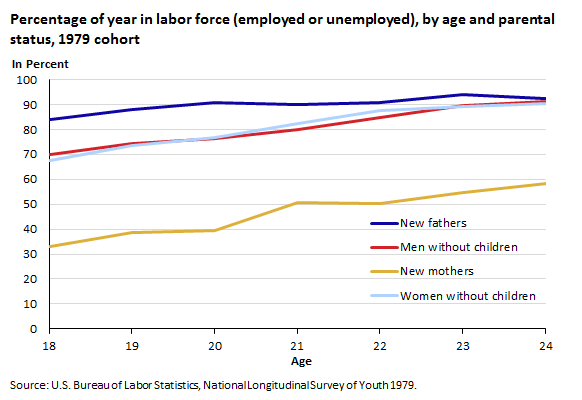
Labor force participation for both cohorts increased with age between 18 and 24, with older individuals spending more time in the labor force (employed or unemployed) than younger individuals. (See chart 2 and chart 3.) Labor force participation of new mothers differed significantly from that of women who were not mothers, with new mothers spending more time out of the labor force than their similarly aged peers who did not have children.10 Following trends from the overall population, women of both cohorts who were older at the time of their first child’s birth tended to be in the labor force for more of the year following the birth of their child. Labor force participation of first-time fathers differed by a relatively small amount from that of similarly aged men who did not have children. New fathers tended to work slightly more than their similarly aged peers who were without children. This was especially true of younger respondents, with the differences diminishing by age 24.
The 1997 cohort, particularly the younger respondents, displayed more dramatic differences in the labor force participation rates of men and women and between the labor force participation of those who had children and those who did not. In both cohorts, labor force participation of new mothers was less than that of women without children, but the participation differential was greater in the 1979 cohort. And although fathers had higher participation than men without children in both cohorts, this participation differential was greater in the 1979 cohort.
For example, for the 1979 cohort, 18-year-old mothers participated in the labor force about 33 percent of weeks over the year compared to over twice as much (67 percent) for women without children, whereas 18-year-old mothers participated in the labor force about 50 percent of weeks over the year compared to almost 69 percent for women without children in the 1997 cohort. The changes were smaller for men. For the 1979 cohort, 18-year-old fathers participated in the labor force almost 84 percent of weeks over the year compared to almost 70 percent for men without children, whereas they participated 77 percent (new fathers) versus almost 67 percent (men without children) of weeks for the 1997 cohort. The gender gap in participation between parents also closed during these years as a result of the dramatic increase in the labor force participation of new mothers in the 1997 cohort. In the 1979 cohort, 18-year-old new mothers worked 40 percent of the weeks that new fathers worked (33 percent for new mothers compared to almost 84 percent for new fathers), but for the 1997 cohort, the comparable figure was 65 percent (almost 50 percent for new mothers compared to 77 percent for new fathers).
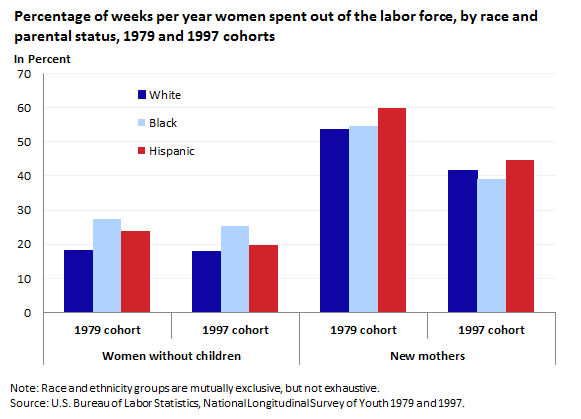
Race and ethnicity is another factor that shows differences in the amount of time spent in the labor force in the year after the birth of a first child. By racial and ethnic groups, new mothers uniformly spent more weeks out of the labor force than women without children. For both cohorts, Hispanic mothers spent slightly more weeks, on average, out of the labor force than Black or White mothers. (See chart 4.)
For both cohorts, fathers tended to spend fewer weeks out of the labor force than men without children. For both cohorts, Black men were more likely to spend more weeks out of the labor force than their White or Hispanic counterparts, regardless of parental status. (See chart 5.)
As mentioned earlier, individuals who became parents before age 25 were likely to have lower educational attainment than individuals without children. Parents in both cohorts who had more schooling spent less of the year out of the labor force after the birth of their first child. (See table 4.) At every education level, fathers in the 1997 cohort were spending more weeks out of the labor force than fathers in the 1979 cohort. The reverse was true for new mothers. Mothers in each educational attainment category in the 1997 cohort were spending less time out of the labor force compared with the 1979 cohort. The changes were smaller at the higher levels of education. In the 1979 cohort, mothers with some college or higher were out of the labor force approximately 42 percent of the weeks in the first year after the birth of their child, and this dropped to 38 percent for the 1997 cohort. New mothers with less than a high school diploma in the 1979 cohort spent 73 percent of the weeks in the year out of the labor force; this dropped to 55 percent in the 1997 cohort.
| Education | Mothers | Fathers | ||
|---|---|---|---|---|
| 1979 Cohort | 1997 Cohort | 1979 Cohort | 1997 Cohort | |
|
Less than high school diploma |
72.8 | 55 | 14.6 | 20.1 |
|
High school diploma |
50.6 | 40.1 | 6.4 | 10 |
|
Some college or higher |
41.7 | 37.5 | 3.4 | 7 |
|
Note: Table excludes those enrolled in school anytime in the year after the birth of the first child. Source: U.S. Bureau of Labor Statistics, National Longitudinal Survey of Youth 1979 and 1997. |
||||
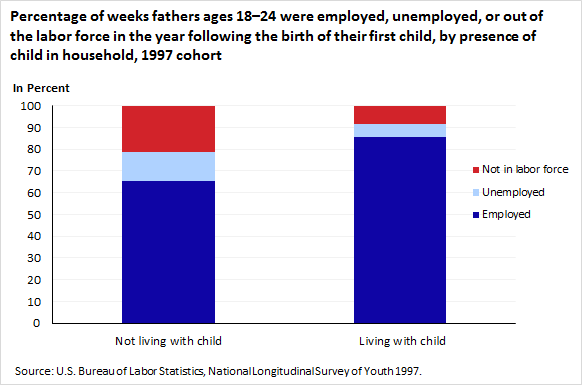
Almost all women who became mothers when they were 18 to 24 lived with their children in the first year after birth: 99 percent in the 1979 cohort and 95 percent in the 1997 cohort. However, in 1979, a little more than a quarter of men becoming fathers when 18 to 24 did not live with their children in the first year after birth, and this proportion increased to 57 percent in the 1997 cohort. Fathers living with their first child spent more of the year employed than did fathers who were not living with their child. (See chart 6.)
Mothers’ employment was also correlated with whether or not the father lived in the same household. For the 1979 cohort, 72.8 percent of first births were to mothers who lived with the child’s father in the first year after the birth. This varied dramatically by race: 84.2 percent of White mothers lived with their child’s father, compared with 30.9 percent of Black mothers and 66.5 percent of Hispanic mothers. Overall, fewer mothers lived with their child’s father in the 1997 cohort than in the 1979 cohort, but this too varied by race. While the percentage of Black mothers living with their child’s father was about the same in the 1997 and 1979 cohorts, the percentage of White and Hispanic mothers living with the child’s father decreased. (See table 5.)
| Race | 1979 Cohort | 1997 Cohort |
|---|---|---|
|
All mothers |
72.8 | 58.6 |
|
White |
84.2 | 69.6 |
|
Black |
30.9 | 29.1 |
|
Hispanic |
66.5 | 56 |
|
Source: U.S. Bureau of Labor Statistics, National Longitudinal Survey of Youth 1979 and 1997. |
||
Fathers’ presence in the household had differing correlations with maternal labor force status overall for the 1979 and the 1997 cohorts. In the 1979 cohort, the father’s presence is associated with mothers spending fewer weeks out of the labor force, and in the 1997 cohort it is associated with a few more weeks in the labor force. (See table 6.)
| Characteristic | 1979 Cohort | 1997 Cohort |
|---|---|---|
|
All mothers |
||
|
Father not present |
56.5 | 40 |
|
Father present |
53.6 | 42.4 |
|
White |
||
|
Father not present |
52.5 | 37 |
|
Father present |
53.9 | 43.7 |
|
Black |
||
|
Father not present |
57.8 | 42.6 |
|
Father present |
47.6 | 30.9 |
|
Hispanic |
||
|
Father not present |
66.8 | 45 |
|
Father present |
56.5 | 44.3 |
|
Source: U.S. Bureau of Labor Statistics, National Longitudinal Survey of Youth 1979 and 1997. |
||
These trends differed by race and ethnicity. For both cohorts, White mothers were more likely to take more time out of the labor force when the father of the child was present. Black and Hispanic mothers with the fathers of their children in the household uniformly spent less time out of the labor force than Black and Hispanic women who lived in households where the father was absent.
Many young mothers in the most recent cohort (NLSY97) worked a greater portion of the year after the birth of their child, creating a markedly different labor market experience from young mothers in the previous cohort. Young fathers’ work patterns have also changed, but far less dramatically. They still work slightly more than young men who have not become fathers, but the differences between fathers and men without children are smaller in the more recent generation of young men.
This Beyond the Numbers summary was prepared by Judith Dey, former economist in the Office of Employment and Unemployment Statistics, U.S. Bureau of Labor Statistics. Email: NLS_INFO@bls.gov. Telephone: (202) 691-7410.
Information in this article will be made available to sensory-impaired individuals upon request. Voice phone: (202) 691-5200. Federal Relay Service: 1-800-877-8339. This article is in the public domain and may be reproduced without permission.
Judith Dey, “How has labor force participation among young moms and dads changed? A comparison of two cohorts,” Beyond the Numbers: Employment & Unemployment, vol. 3, no. 19 (U.S. Bureau of Labor Statistics, September 2014), https://www.bls.gov/opub/btn/volume-3/how-has-labor-force-participation-among-young-moms-and-dads-changed.htm
1 Kim Parker and Wendy Wong, "Modern Parenthood: Roles of Moms and Dads Converge as They Balance Work and Family," (Pew Research Center, March 2013), http://www.pewsocialtrends.org/files/2013/03/FINAL_modern_parenthood_03-2013.pdf.
2 Lynda Laughlin, “Maternity Leave and Employment Patterns of First-Time Mothers: 1961-2008,” Current Population Reports, (U.S. Census Bureau, October 2011), pp. 70-128.
3 This analysis compares data from the National Longitudinal Survey of Youth 1997 (NLSY97), a nationally representative sample of 8,984 men and women born from 1980 to 1984 and living in the United States at the time of the initial survey, and the National Longitudinal Survey of Youth 1979 (NLSY79), a nationally representative sample of 12,686 men and women born from 1957 to 1964 and living in the United States at the time of the initial survey. For both cohorts, weights were used in the tables and charts. The weights correspond to the year in which the respondent turned 25.
4 Because mothers and fathers may have children at any point in the year (e.g., 18 years and 2 months, 18 years and 11 months), they were compared to individuals without children at the midpoint of the year (e.g., 18 and 6 months, 19 and 6 months). Individuals in the comparison group did not have children, nor were they pregnant prior to turning 25 and a half.
5 Participants in the NLSY97 were first interviewed in 1997, when they were ages 12 to 17. The sample members have been interviewed annually through 2011. Respondents are ages 25 to 29 in the most recent round of data available.
6 Participants in the NLSY79 were first interviewed in 1979 when they were ages 14 to 22. Interviews for the NLSY79 were conducted annually through 1994 and biennially since 1994. Respondents are ages 45 to 53 in the most recent round of data available.
7 In this article, only biological children were considered.
8 Race and Hispanic or Latino ethnicity groups are mutually exclusive but not exhaustive. Other race groups, which are included in the overall totals, are not shown separately because their representation in the survey sample is not sufficiently large to provide statistically reliable estimates.
9 Note that these figures are representative of individuals living in the United States at the time the samples were drawn. This consideration may be especially important for the Hispanic sample because of the immigration that occurred after the sample was drawn.
10 Individuals on paid maternity or paternity leave are considered employed.
Publish Date: Friday, September 12, 2014