An official website of the United States government
An official website of the United States government
The .gov means it's official.
Federal government websites often end in .gov or .mil. Before sharing sensitive information,
make sure you're on a federal government site.
The site is secure.
The
https:// ensures that you are connecting to the official website and that any
information you provide is encrypted and transmitted securely.

More BLS articles and information related to pay are available online at the following links:
Payday is a highly anticipated day for any worker no matter when it takes place. How frequently workers get paid and how many paydays there are per year could affect their decisions as consumers, such as if and when they decide to purchase particular goods and services. If so, then the length of the workers’ pay period may have an impact on the velocity of money—that is, the number of times $1 is spent to purchase goods and services.1 Also, how frequently a worker is paid could play into his or her borrowing and saving choices.
From the employer perspective, the length of a business’ pay period is associated with the business’ costs and cash flows. Processing payroll, mailing checks, and paying the banking fees charged for a direct deposit are all costs that may incline businesses to pay their workers less frequently. However, most states set a minimum limit on how frequently employees are paid.2
This Beyond the Numbers article analyzes pay frequencies, or lengths of pay periods, that private businesses use in the United States, as collected by the Current Employment Statistics (CES) survey. Data of this nature are not published in any standard Bureau of Labor Statistics (BLS, the Bureau) source, but are available upon request. (Update, September 10, 2019: The most recent data are now available online, https://www.bls.gov/ces/publications/length-pay-period.htm.) The article also explains why the CES program collects such data.
To provide detailed information on employment, hours, and earnings of workers on nonfarm payrolls, the CES survey collects data on about 144,000 businesses and government agencies representing approximately 554,000 individual worksites.3 Data are collected each month from businesses for the pay period that includes the 12th of the month. The length of this pay period is specific to the business and depends on how frequently it pays its employees. This means that businesses in the CES survey report information on total hours and earnings that covers various lengths of pay period.
Data on a business’ length of pay period need to be collected in order to adjust hours and earnings information to a common basis for CES estimates. For example, a business that pays employees for a 2-week pay period will need to have its average hours divided by 2 in order to calculate average weekly hours. For this reason, any respondent reporting hours or earnings information also is asked to provide the length of pay period it uses; possible length of pay periods are weekly, biweekly, semimonthly, or monthly pay periods.4 In addition to providing employee counts, 59.3 percent of businesses participating in the CES survey give hours and earnings information.
Information on the length of the pay period is collected in order to produce CES hours and earnings estimates, but may have its own value as a labor statistic. As mentioned earlier, the length of a business’ pay period determines how frequently money becomes available to workers, in turn perhaps affecting workers’ spending, borrowing, or saving decisions. On the employer’s side, the length of the pay period is associated with different business costs and cash flows.
Each data observation in this article is for one business and the length of pay period with which it operates. Only businesses that report valid hours and earnings data were used in arriving at estimates.5 The analysis is limited to private businesses: government and public and private educational establishments’ hours and earnings data are out of the scope of the survey.6
Each business in the CES survey is assigned a weight, which is determined by the business’ chance of being selected into the CES sample. This weight is used in producing the survey’s employment, hours, and earnings estimates. The weight also can be applied to data on the length of the business’ pay period. The weighted length-of-pay-period data give an estimate of the percentage of private businesses operating under each length of pay period in the United States.7
Some businesses use multiple pay frequencies. The CES program collects data for up to two lengths of pay periods for each business.8 Businesses that pay all workers for the same length of pay period are referred to as single-pay-period businesses, whereas businesses that pay workers for different lengths of pay period are referred to as multiple-pay-period businesses. This distinction allows for an estimate of how many private businesses operate as a single-pay-period business versus how many operate as a multiple-pay-period business. In March 2013, 94.8 percent of private businesses were single-pay-period businesses and 5.2 percent of private businesses were multiple-pay-period businesses. The remainder of this article examines the distribution of lengths of pay period for single-pay-period businesses only.
Biweekly is the most common length of pay period, with 36.5 percent of U.S. private businesses paying their employees every 2 weeks. Weekly pay periods are almost as common, with 32.4 percent of private businesses paying employees each week. Semimonthly and monthly pay frequencies are less common. Overall, individual businesses tend to have stability in pay frequencies from month to month. Chart 1 shows the March 2013 distribution of percentages of private businesses operating under each length of pay period collected from respondents to the CES survey.
The distribution of lengths of pay period also can be examined by business characteristic to provide a greater level of detail.
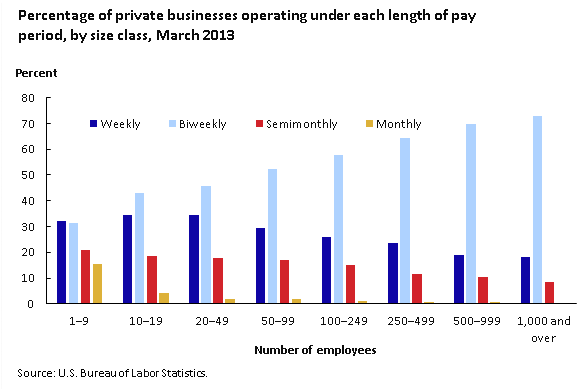
Business size. The CES survey groups businesses into eight different size classes based on the maximum number of employees within the business over the previous 12 months. Chart 2 displays the percentages of private businesses operating under each length of pay period by size class.
A number of trends appear in the distribution of length of pay periods by size class. The percentage of private businesses operating under a biweekly pay period is lowest within the smallest size class (1–9 employees); this percentage increases as the size class grows. In the largest size class (over 1,000 employees) over 70 percent of the businesses pay on a biweekly schedule. The reverse trend, however, is seen for the three other length-of-pay-period groups: the percentage of businesses operating with weekly, semimonthly, and monthly payrolls decreases as the size class increases. This trend holds for every increase in size class except one instance in both weekly and monthly pay periods.9 The smallest businesses tend to exhibit the most flexibility in paying their workers.
Industry. The CES survey classifies businesses into industry groups that are used in this article to calculate the percentages of private businesses operating under each length of pay period within each industry. Table 1 shows that in three industries—construction, education and health services, and manufacturing—a majority of businesses operate under one specific length of pay period. The construction industry displays the most uniformity in its pay period, with 70.6 percent of businesses in the industry using a weekly pay period. Following at a distant second and third, with slightly more than 50 percent of their businesses operating under one specific length of pay period, are education and health services (biweekly) and manufacturing (weekly).
In four industries, between 40 percent and 50 percent of businesses operate under one specific length of pay period. In leisure and hospitality and in information, businesses tend to use biweekly pay periods; in natural resources and mining and in the industry designated as other services, businesses tend to use weekly pay periods.
Businesses in the trade, transportation, and utilities industry do not favor any one specific pay period, but more than 70 percent of them use either weekly or biweekly pay periods. The financial activities and the professional and business services industries have the most variety in the length of their pay periods, with each of the four pay periods covered by the CES survey used by between 15 percent and 36 percent of businesses in the industry.
| Industry | Weekly | Biweekly | Semimonthly | Monthly |
|---|---|---|---|---|
|
Natural resources and mining |
44.2 | 25.5 | 19.1 | 11.2 |
|
Construction |
70.6 | 18.3 | 5.2 | 5.9 |
|
Manufacturing |
50.8 | 35.9 | 9.5 | 3.8 |
|
Trade, transportation, and utilities |
36.1 | 37.3 | 16.4 | 10.2 |
|
Information |
10.2 | 43.7 | 35.9 | 10.2 |
|
Financial activities |
18.0 | 33.9 | 30.5 | 17.6 |
|
Professional and business services |
20.4 | 36.0 | 28.0 | 15.6 |
|
Education and health services(1) |
12.6 | 52.9 | 22.9 | 11.6 |
|
Leisure and hospitality |
28.9 | 46.2 | 17.0 | 7.9 |
|
Other services |
42.5 | 28.4 | 17.1 | 12.0 |
| Footnote:
(1) For information on the special estimation procedure for educational establishments, see chapter 2, “Employment, hours, and earnings from the establishment survey,” in BLS Handbook of Methods, https://www.bls.gov/opub/hom/homch2.htm#special_estimation. Source: U.S. Bureau of Labor Statistics.
|
||||
Earnings. Another detailed characteristic associated with frequency of pay is, of course, hourly earnings. Chart 3 shows the average hourly earnings paid by businesses, for each length of pay period used. The dollar amounts shown are calculated from gross hours and earnings data collected in the CES survey.
A look at the chart reveals that semimonthly is the pay period in which businesses pay the highest average hourly earnings, followed closely by monthly; businesses using either pay period have average hourly earnings of slightly less than $30 an hour. Businesses paying biweekly average slightly less than $25 an hour for the pay period, and businesses paying on a weekly basis average less than $20 an hour. The March 2013 average hourly earnings for all businesses, regardless of the length of pay period used, was $23.84, not seasonally adjusted.
The estimates presented for the various lengths of pay period examined in this article may be of interest for a number of economic and business reasons. The length of a business’ pay period determines how frequently workers in the business are paid. Workers paid on a weekly schedule typically will have 52 paydays a year, compared with 26 paydays for workers paid biweekly, 24 paydays for those paid semimonthly, and 12 paydays for workers paid monthly.
The earnings analysis presented in this article reveals that businesses paying on a weekly pay schedule have the lowest average hourly earnings. This schedule may represent an effort on the part of businesses to pay lower earning workers more frequently. The businesses using the two longest pay periods—semimonthly and monthly—pay the highest average hourly earnings. Those working under either of these pay periods may be less constrained in their purchasing decisions by the lower frequency of their paydays because of their higher hourly earnings.
There is no specific length of pay period used by a majority of private businesses. Biweekly (36.5 percent) is the most common, followed by weekly (32.4 percent), semimonthly (19.8 percent), and then monthly (11.3 percent). Certain industries tend to use specific lengths of pay period; for example, 70.6 percent of construction businesses use a weekly pay period. Also, private businesses use a biweekly pay period more frequently as the size of the business increases. As a result, 72.9 percent of private businesses in the largest size class pay their employees every 2 weeks and these businesses have more uniformity in the length of pay period.
This Beyond the Numbers summary was prepared by Matt Burgess, economist in the Office of Employment and Unemployment Statistics: Data Collection Branch, U.S. Bureau of Labor Statistics. Email: burgess.matthew@bls.gov, telephone: (202) 691-6519.
Information in this article will be made available upon request to individuals with sensory impairments. Voice phone: (202) 691-5200. Federal Relay Service: 1-800-877-8339. This article is in the public domain and may be reproduced without permission.
Matt Burgess, “How frequently do private businesses pay workers?” Beyond the Numbers: Pay & Benefits, vol. 3, no. 11 (U.S. Bureau of Labor Statistics, May 2014), https://www.bls.gov/opub/btn/volume-3/how-frequently-do-private-businesses-pay-workers.htm
1 For more information on the velocity of money, see Economic research (St. Louis: Federal Reserve Bank of St. Louis), http://research.stlouisfed.org/fred2/categories/32242.
2 For state payday requirements, see Wage and Hour Division: state payday requirements (U.S. Department of Labor, January 1, 2014), http://www.dol.gov/whd/state/payday.htm.
3 For more information on the Current Employment Statistics (CES) survey, see Current Employment Statistics–CES (National) (U.S. Bureau of Labor Statistics, published monthly), https://www.bls.gov/ces/.
4 If the pay frequency is less often than monthly, employment data are still collected but data on hours and earnings are not, because such data cannot be reconciled to CES concepts on a monthly basis. Biweekly pay frequencies have payday every 2 weeks, while semimonthly pay frequencies have payday twice a month.
5 Valid data are data that are neither equal to zero or blank. Also, valid data are data that have passed logical checks which disallow a combination of hours and earnings that are unrealistically large or small.
6 For more information about the CES sample design, see “Technical notes for the Current Employment Statistics survey,” in Current Employment Statistics–CES (National) (U.S. Bureau of Labor Statistics, March 10, 2014), www.bls.gov/web/empsit/cestn.htm. For information on the special estimation procedure for educational establishments, see chapter 2, “Employment, hours, and earnings from the establishment survey,” in BLS Handbook of Methods, https://www.bls.gov/opub/hom/homch2.htm#special_estimation.
7 For more information about CES selection weights, see ibid.
8 In the rare event that a business has more than two pay frequencies, the Bureau still collects the data, but additional work is required before the data can be entered into the CES system.
9 The percentage of businesses using weekly pay periods increased from 32.1 percent in the 1–9 employee size class to 34.6 percent in the 10–19 employee size class. Similarly, the percentage of businesses using monthly pay periods increased from 0.7 percent in the 250–499 employee size class to 0.8 percent in the 500–999 employee size class.
Publish Date: Friday, May 23, 2014