
An official website of the United States government
An official website of the United States government
The .gov means it's official.
Federal government websites often end in .gov or .mil. Before sharing sensitive information,
make sure you're on a federal government site.
The site is secure.
The
https:// ensures that you are connecting to the official website and that any
information you provide is encrypted and transmitted securely.
More BLS articles and information related to animal accidents and occupational injuries, illnesses, and fatalities are available online at the following links:
Are Animals Occupational Hazards?
Fatal occupational injuries involving contractors, 2011
Nonfatal injuries and illnesses among state and local government workers
Although not often associated with injuries and deaths at the workplace, insects, arachnids, and mites were involved in 83 fatal occupational injuries from 2003 to 2010.1 The majority of these workplace deaths were due to bee stings. Annual nonfatal work-related injury and illness case counts involving insects, arachnids, and mites that led to days away from work ranged from 4,930 to 6,870 between 2008 and 2010. Most of these nonfatal cases were due to stings or bites, some venomous and some nonvenomous.
This issue of Beyond the Numbers article examines fatal and nonfatal workplace injuries and illnesses related to insects, arachnids, and mites using data from two Bureau of Labor Statistics (BLS) sources: the Census of Fatal Occupational Injuries (CFOI)2 and the Survey of Occupational Injuries and Illnesses (SOII).3 CFOI data used here are from 2003 to 2010 and aggregated to support extended analysis. SOII data are from 2008 to 2010. BLS began publishing national SOII estimates for state and local government in 2008, so that period was chosen to keep the coverage of CFOI and SOII data in this study as comparable as possible.4 For this article, the term "insects" refers to the entire category, for short.
The two leading federal agencies dedicated to ensuring the safety and health of employees in the workplace have each recognized insects as a workplace hazard. The National Institute for Occupational Safety and Health (NIOSH), which is part of the Centers for Disease Control and Prevention, notes that "Thousands of people are stung by insects each year, and as many as 90–100 people in the United States die as a result of allergic reactions."5 NIOSH devotes a section of their website to workplace safety measures related to insects. The Occupational Safety and Health Administration (OSHA) has issued several fact sheets that are designed to help workers identify and protect themselves from different types of insects. Noteworthy among these are the brown recluse spider, fire ants, and the black widow spider.6
Over the 8-year period from 2003 to 2010, an average of 10 fatal occupational injuries per year involving insects were recorded. The high was in 2005 (15), and the series low was in 2003 (6). (See table 1.)
| Year | Fatal injuries |
|---|---|
|
2003 |
6 |
|
2004 |
10 |
|
2005 |
15 |
|
2006 |
10 |
|
2007 |
11 |
|
2008 |
10 |
|
2009 |
9 |
|
2010 |
12 |
|
NOTE: Data for all years are revised and final. CFOI fatality counts exclude illness-related deaths unless precipitated by an injury event. SOURCE: U.S. Department of Labor, Bureau of Labor Statistics, in cooperation with State, New York City, District of Columbia, and Federal agencies, Census of Fatal Occupational Injuries |
|
Bees were the most common insect involved, with 52 fatal occupational injuries. Eleven workers were killed in wasp-related incidents including three incidents involving yellow jackets. In addition, seven fatal occupational injuries over that period were from spiders and four were from ants.
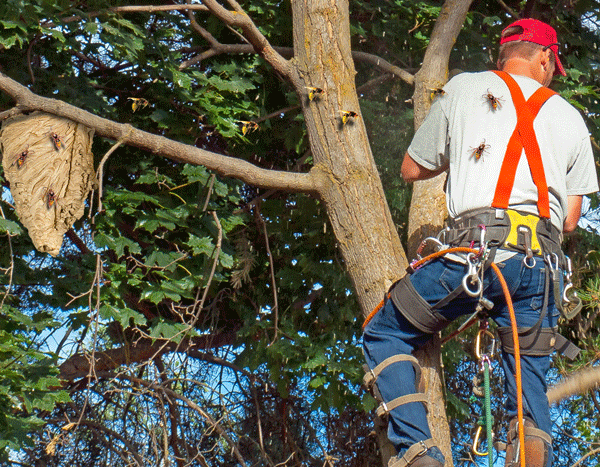
Insect-related deaths were most commonly associated with three types of jobs: farming, construction, and landscaping. A total of 20 farmers and farm workers were killed during the 8-year period. Construction occupations (19), landscaping workers (17), and farmers and farm workers accounted for two thirds of the deaths. (See table 2.)
| Characteristics | Fatal injuries |
|---|---|
|
Total |
83 |
|
|
|
|
Type of insect |
|
|
Bee |
52 |
|
Wasp |
11 |
|
Yellow Jacket |
3 |
|
Spider |
7 |
|
Ant |
4 |
|
Other or unknown insect |
9 |
|
|
|
|
Employee Status |
|
|
Wage and salary(1) |
62 |
|
Self-employed(2) |
21 |
|
|
|
|
Gender |
|
|
Male |
82 |
|
|
|
|
Age |
|
|
20 to 24 |
5 |
|
25 to 34 |
12 |
|
35 to 44 |
19 |
|
45 to 54 |
23 |
|
55 to 64 |
12 |
|
65 and older |
9 |
|
|
|
|
Race or ethnic origin(3) |
|
|
White, non-Hispanic |
55 |
|
Black or African American, non-Hispanic |
11 |
|
Hispanic or Latino |
16 |
|
|
|
|
Event(4) |
|
|
Injections, stings, venomous bites |
70 |
|
Nonhighway falls from vehicle |
5 |
|
Other transportation incidents |
3 |
|
|
|
|
Occupation(5) |
|
|
Farming occupations(6) |
20 |
|
Farmworkers and laborers, crop, nursery, and greenhouse |
8 |
|
Farmers and ranchers |
6 |
|
Farmworkers, farm, and ranch animals |
4 |
|
Construction occupations(7) |
19 |
|
First-line supervisors of construction trades and extraction workers |
3 |
|
Carpenter |
3 |
|
Construction laborers |
3 |
|
Operating engineers and other construction equipment operators |
3 |
|
Landscaping occupations(8) |
17 |
|
Landscaping and groundskeeping workers |
13 |
|
Tree trimmer |
3 |
|
Driver/sales workers and truck drivers |
6 |
|
Pest control workers |
3 |
|
|
|
|
Industry(9) |
|
|
Private |
78 |
|
Agriculture, forestry, fishing, and hunting |
22 |
|
Crop production |
10 |
|
Animal production |
11 |
|
Cattle ranching and farming |
6 |
|
Construction |
21 |
|
Residential building construction |
4 |
|
Administrative and support and waste management and remediation services |
16 |
|
Services to buildings and dwellings |
15 |
|
Landscaping services |
12 |
|
Exterminating and pest control services |
3 |
|
Retail trade |
3 |
|
Transportation and warehousing |
3 |
|
Government(10) |
5 |
|
State government |
3 |
|
Footnotes:
(1) May include volunteers and workers receiving other types of compensation. (2) Includes self-employed workers, owners of unincorporated businesses and farms, paid and unpaid family workers, businesses or members of partnerships and may include some owners of incorporated businesses or members of partnerships. (3) Persons identified as Hispanic or Latino may be of any race. The racial categories shown exclude data for Hispanics and Latinos. (4) Based on the original BLS Occupational Injury and Illness Classification System (OIICS). (5) Occupation data are based on the 2000 Standard Occupational Classification (SOC) system. (6) Farming occupations include SOC 11-9012, SOC 45-1*, and SOC 45-2*. (7) Construction occupations include SOC 11-9021, SOC 47-1*, SOC 47-2*, SOC 47-3*, and SOC 47-4*. (8) Landscaping occupations include SOC 37-1012 and SOC 37-3*. (9) Industry data from 2003 to 2008 are based on the 2002 North American Industry Classification System. Industry data from 2009 to the present are based on the 2007 North American Industry Classification System. (10) Includes fatal injuries to workers employed by governmental organizations regardless of industry. NOTE: Data for all years are revised and final. Totals for major categories may include subcategories not shown separately. CFOI fatality counts exclude illness-related deaths unless precipitated by an injury event. SOURCE: U.S. Department of Labor, Bureau of Labor Statistics, in cooperation with State, New York City, District of Columbia, and Federal agencies, Census of Fatal Occupational Injuries |
|
Fatal occupational injuries involving insects are often associated with anaphylactic shock. In total, 39 of the case narratives noted the decedent suffered anaphylactic shock.
While 9 percent of all fatal workplace injuries from 2003 to 2010 occurred in Texas, 25 percent (21) of insect-related fatal workplace injuries occurred in this state. Florida had the next highest percentage with 10 percent (8) (See table 3.)
| State | Fatal injuries |
|---|---|
|
Total |
83 |
|
Texas |
21 |
|
Florida |
8 |
|
California |
6 |
|
Ohio |
6 |
|
Pennsylvania |
5 |
|
New York |
4 |
|
North Carolina |
4 |
|
Arizona |
3 |
|
Colorado |
3 |
|
South Carolina |
3 |
|
NOTE: Data for all years are revised and final. CFOI fatality counts exclude illness-related deaths unless precipitated by an injury event. SOURCE: U.S. Department of Labor, Bureau of Labor Statistics, in cooperation with State, New York City, District of Columbia, and Federal agencies, Census of Fatal Occupational Injuries |
|
Not surprisingly, these incidents tended to occur in the warmer months.7 Almost 94 percent of the cases occurred between April 1 and October 31. The largest number of deaths (17) occurred in September. (See table 4.)
| Month | Fatal injuries |
|---|---|
|
Total |
83 |
|
April |
4 |
|
May |
10 |
|
June |
13 |
|
July |
14 |
|
August |
14 |
|
September |
17 |
|
October |
6 |
|
NOTE: Data for all years are revised and final. CFOI fatality counts exclude illness-related deaths unless precipitated by an injury event. SOURCE: U.S. Department of Labor, Bureau of Labor Statistics, in cooperation with State, New York City, District of Columbia, and Federal agencies, Census of Fatal Occupational Injuries |
|
Of the total 83 deaths, 72 were directly caused by an insect. These include cases in which the worker was bitten or stung. Another 11 deaths were indirectly caused by insects. These include cases where an insect distracted the worker while driving or caused the worker to fall from a height.
In the 72 direct cases, there were 33 instances in which the worker was attacked by multiple insects. In 27 of these instances, bees attacked the worker. There were also 12 cases in which the decedent was attacked by insects (10 of which involved bees) after disturbing a nest or other home of the insects. In all of these cases, multiple insects attacked the worker.
Five of the direct cases involved a worker who used or tried to use an epinephrine autoinjector or other antivenom and still died from the insect bite.
For indirect incidents, five deaths resulted from the decedent falling from a tractor while trying to evade insects.
Every year from 2008 to 2010, the estimated number of nonfatal cases with days away from work involving insects, including bees, wasps, and spiders, exceeded 4,600.8 (See table 5.) Due to limitations in the data, estimates identifying how often particular types of insects were involved in days-away-from-work cases are not publishable.
| Year | Private Industry | Local Government | State Government | Total All Ownerships |
|---|---|---|---|---|
|
2008 |
4650 | 1460 | 430 | 6540 |
|
2009 |
4820 | 1660 | 390 | 6870 |
|
2010 |
3650 | 980 | 300 | 4930 |
|
Footnotes: (1) Days-away-from-work cases include those that resulted in days away from work, some of which also included job transfer or restriction SOURCE: U.S. Department of Labor, Bureau of Labor Statistics, Survey of Occupational Injuries and Illnesses in cooperation with participating State agencies. |
||||
Most insect-related nonfatal cases involved stings or bites of some kind. More than 65 percent of all insect-related cases were due to injections, stings, or venomous bites for each year in the reference period. At least 20 percent of the remaining cases involving insects in each of those years were from nonvenomous bites. (See table 6.)
| Characteristic | 2008 | 2009 | 2010 |
|---|---|---|---|
|
Total |
6540 | 6870 | 4930 |
|
Gender |
|||
|
Male |
4710 | 4970 | 3380 |
|
Female |
1790 | 1880 | 1540 |
|
Gender Not Reported |
30 | 20 | 20 |
|
|
|||
|
Age |
|||
|
16 to 19 |
110 | 490 | 110 |
|
20 to 24 |
580 | 850 | 480 |
|
25 to 34 |
1580 | 1230 | 1110 |
|
35 to 44 |
1630 | 1600 | 1200 |
|
45 to 54 |
1580 | 1970 | 1450 |
|
55 to 64 |
790 | 570 | 420 |
|
65 and older |
170 | 70 | 80 |
|
Other or Not Reported |
110 | 90 | 70 |
|
|
|||
|
Event(2) |
|||
|
Injections, stings, venomous bites |
4750 | 4680 | 3450 |
|
Nonvenomous bites |
1690 | 1910 | 1370 |
|
Contact with skin or other exposed tissue |
- | 50 | 20 |
|
|
|||
|
Occupation(3) |
|||
|
Management |
80 | 90 | 90 |
|
Education, training, and library |
40 | 180 | 90 |
|
Healthcare practitioner and technical |
130 | 140 | 150 |
|
Registered nurses |
20 | 40 | 80 |
|
Healthcare support |
230 | 230 | 250 |
|
Home health aides |
50 | 50 | 80 |
|
Nursing aides, orderlies, and attendants |
160 | 160 | 110 |
|
Protective service |
360 | 750 | 510 |
|
First-line supervisors/managers, fire fighting and prevention workers |
- | 20 | 50 |
|
Fire fighters |
50 | 50 | 80 |
|
Correctional officers and jailers |
20 | 90 | 70 |
|
Police and sheriff's patrol officers |
60 | 120 | 140 |
|
Security guards |
100 | 60 | 140 |
|
Food preparation and serving related |
50 | 70 | 70 |
|
Building and grounds cleaning and maintenance |
1530 | 1400 | 790 |
|
First-line supervisors/managers of housekeeping and janitorial workers |
40 | - | 70 |
|
Janitors and cleaners, except maids and housekeeping cleaners |
660 | 310 | 340 |
|
Landscaping and groundskeeping workers |
530 | 790 | 260 |
|
Personal care and service |
130 | 90 | 130 |
|
Amusement and recreation attendants |
30 | - | 40 |
|
Sales and related |
170 | 210 | 220 |
|
Cashiers |
40 | 50 | 90 |
|
Retail salespersons |
70 | 100 | 60 |
|
Office and administrative support |
450 | 390 | 570 |
|
Customer service representatives |
120 | 120 | 110 |
|
Stock clerks and order fillers |
60 | 50 | 50 |
|
Farming, fishing, and forestry |
170 | 110 | 210 |
|
Farmworkers and laborers, crop, nursery, and greenhouse |
140 | 90 | 150 |
|
Farmworkers, farm and ranch animals |
- | - | 50 |
|
Construction and extraction |
650 | 1100 | 200 |
|
Construction laborers |
240 | 160 | 50 |
|
Installation, maintenance, and repair |
620 | 600 | 700 |
|
Telecommunications equipment installers and repairers, except line installers |
40 | 70 | 70 |
|
Automotive service technicians and mechanics |
50 | 170 | 60 |
|
Maintenance and repair workers, general |
170 | 120 | 180 |
|
Telecommunications line installers and repairers |
80 | 70 | 60 |
|
Installation, maintenance, and repair workers, all other |
40 | - | 80 |
|
Production |
300 | 320 | 270 |
|
Transportation and material moving |
1170 | 860 | 570 |
|
Truck drivers, heavy and tractor-trailer |
310 | 170 | 110 |
|
Truck drivers, light or delivery services |
40 | 90 | 100 |
|
Laborers and freight, stock, and material movers, hand |
320 | 330 | 200 |
|
|
|||
|
Industry(4) |
|||
|
Private |
4650 | 4820 | 3650 |
|
Agriculture, forestry, fishing, and hunting |
180 | 150 | 190 |
|
Mining |
30 | - | 20 |
|
Utilities |
90 | 50 | 20 |
|
Construction |
580 | 730 | 230 |
|
Manufacturing |
300 | 260 | 290 |
|
Wholesale trade |
240 | 240 | 460 |
|
Retail trade |
350 | 860 | 380 |
|
Transportation and warehousing |
440 | 320 | 190 |
|
Information |
190 | 170 | 190 |
|
Finance and insurance |
20 | 20 | 30 |
|
Real estate and rental and leasing |
420 | 190 | 240 |
|
Professional, scientific, and technical services |
150 | 80 | 50 |
|
Management of companies and enterprises |
30 | 20 | 30 |
|
Administrative and support and waste management and remediation services |
470 | 510 | 420 |
|
Health care and social assistance |
690 | 670 | 580 |
|
Educational services |
20 | 40 | 20 |
|
Arts, entertainment, and recreation |
200 | 110 | 150 |
|
Accommodation and food services |
120 | 60 | 90 |
|
Other services |
130 | 330 | 80 |
|
State government |
430 | 390 | 300 |
|
Educational services |
110 | 100 | 40 |
|
Health care and social assistance |
50 | 90 | 30 |
|
Public administration |
210 | 160 | 210 |
|
Local government |
1460 | 1660 | 980 |
|
Construction |
- | 150 | - |
|
Educational services |
130 | 340 | 280 |
|
Health care and social assistance |
60 | 20 | 30 |
|
Public administration |
1110 | 1020 | 490 |
|
Transportation and warehousing |
30 | - | 40 |
|
Utilities |
60 | 50 | - |
|
Footnotes: (1) Days-away-from-work cases include those that resulted in days away from work, some of which also included job transfer or restriction (2) These codes are based on the original Occupational Injury and Illness Classification System developed by the Bureau of Labor Statistics. (3) Standard Occupational Classification Manual, 2000, Office of Management and Budget (4) Industry data for 2008 are based on the North American Industry Classification System - United States, 2002. Industry data from 2009 to the present are based on the North American Industry Classification System - United States, 2007. SOURCE: U.S. Department of Labor, Bureau of Labor Statistics, Survey of Occupational Injuries and Illnesses in cooperation with participating State agencies. |
|||
Building and grounds cleaning and maintenance, transportation and material moving, and construction and extraction occupations had consistently high counts of nonfatal insect-related cases. (See table 6.) Employees in these fields are likely to deal with the natural habitat of insects or arachnids such as the brown recluse spider, which can be found "any place which had remained undisturbed for lengthy periods of time, such as behind pictures, beneath or behind furniture, in boxes of toys, in clothing, among stored papers, in the corrugations of cardboard boxes, and in discarded articles, such as tires, inner tubes, and assorted other junk."9
Four states10 had case counts higher than 250 in all 3 years of the reference period: California, Florida, New York, and Texas. (See table 7.) As a percentage of all days-away-from-work cases in those large population states, though, insect-related cases were less than 1 percent of the total cases in any year. Seven other states had case counts that exceeded 1 percent of all nonfatal days-away-from-work cases for the state in at least 1 year: Georgia, Kansas, Louisiana, New Mexico, South Carolina, Tennessee, and West Virginia.11
| State | 2008 | 2009 | 2010 |
|---|---|---|---|
|
National Total |
6540 | 6870 | 4930 |
|
Alaska |
- | - | - |
|
Alabama |
140 | 140 | 130 |
|
Arkansas |
90 | 110 | 70 |
|
Arizona |
130 | 160 | 60 |
|
California |
840 | 680 | 750 |
|
Colorado |
NP | NP | NP |
|
Connecticut |
180 | 210 | 50 |
|
District Of Columbia |
20 | - | - |
|
Delaware |
- | 20 | 20 |
|
Florida |
630 | 420 | 390 |
|
Georgia |
170 | 150 | 610 |
|
Hawaii |
70 | 70 | 30 |
|
Iowa |
80 | - | 30 |
|
Idaho |
NP | NP | NP |
|
Illinois |
110 | 260 | 80 |
|
Indiana |
100 | 90 | 60 |
|
Kansas |
50 | 140 | 20 |
|
Kentucky |
110 | 110 | 90 |
|
Louisiana |
210 | 210 | 100 |
|
Massachusetts |
80 | NP | 60 |
|
Maryland |
170 | 120 | 180 |
|
Maine |
- | - | - |
|
Michigan |
100 | 50 | 50 |
|
Minnesota |
20 | 70 | 70 |
|
Missouri |
70 | 50 | 80 |
|
Mississippi |
NP | NP | NP |
|
Montana |
- | - | - |
|
North Carolina |
210 | 140 | 140 |
|
North Dakota |
NP | NP | NP |
|
Nebraska |
20 | - | - |
|
New Hampshire |
NP | NP | NP |
|
New Jersey |
200 | 160 | 120 |
|
New Mexico |
40 | 150 | 170 |
|
Nevada |
20 | - | 20 |
|
New York |
360 | 340 | 320 |
|
Ohio |
NP | NP | NP |
|
Oklahoma |
70 | 70 | 100 |
|
Oregon |
20 | 140 | 60 |
|
Pennsylvania |
NP | NP | NP |
|
Rhode Island |
NP | NP | NP |
|
South Carolina |
80 | 270 | 80 |
|
South Dakota |
NP | NP | NP |
|
Tennessee |
410 | 220 | 110 |
|
Texas |
570 | 330 | 620 |
|
Utah |
10 | 40 | 30 |
|
Virginia |
110 | 90 | 140 |
|
Vermont |
- | - | - |
|
Washington |
120 | 130 | 140 |
|
Wisconsin |
70 | 40 | 60 |
|
West Virginia |
50 | 130 | 30 |
|
Wyoming |
- | - | - |
|
Footnotes: (1) Days-away-from-work cases include those that resulted in days away from work, some of which also included job transfer or restriction NOTE: State participation in the survey may vary by year. NP denotes a non-participating state for which no estimates are available. Dash indicates data do not meet publication guidelines. SOURCE: U.S. Department of Labor, Bureau of Labor Statistics, Survey of Occupational Injuries and Illnesses in cooperation with participating State agencies. |
|||
As with the fatalities data, more nonfatal days-away-from-work cases involving insects occur during summer and fall.12 (See table 8.) Note that decreased hours of sunlight and temperature associated with seasonal change from fall to winter may not necessarily reduce the insect population.13
| Month | 2008 | 2009 | 2010 |
|---|---|---|---|
|
Total |
6540 | 6870 | 4930 |
|
January |
220 | 200 | 110 |
|
February |
170 | 260 | 80 |
|
March |
280 | 220 | 110 |
|
April |
350 | 260 | 250 |
|
May |
410 | 540 | 360 |
|
June |
690 | 720 | 470 |
|
July |
1280 | 1600 | 830 |
|
August |
990 | 1100 | 910 |
|
September |
960 | 820 | 910 |
|
October |
670 | 620 | 530 |
|
November |
250 | 300 | 260 |
|
December |
270 | 120 | 100 |
|
Footnotes: (1) Days-away-from-work cases include those that resulted in days away from work, some of which also included job transfer or restriction SOURCE: U.S. Department of Labor, Bureau of Labor Statistics, Survey of Occupational Injuries and Illnesses in cooperation with participating State agencies. |
|||
Generating these estimates for months using the Survey of Occupational Injuries and Illnesses (SOII) microdata is straightforward (see table 8), but obtaining standard errors for those estimates are not. Due to the fact that the SOII sampling methodology does not include month as a defining characteristic but month of occurrence affects the likelihood of a case being submitted for the survey, standard errors using the regular SOII ratio method computation of standard errors are likely to be biased. More detailed information on methods used in this paper is available from the authors upon request.14
This Beyond the Numbers summary was prepared by Andrew Kato and Steve Pegula, economists in the Office of Compensation and Working Conditions, U.S. Bureau of Labor Statistics. Email: pegula.stephen@bls.gov. Telephone: (202) 691-6166.
Information in this article will be made available to sensory-impaired individuals upon request. Voice phone: (202) 691-5200. Federal Relay Service: 1-800-877-8339. This article is in the public domain and may be reproduced without permission.
Steve Pegula and Andrew Kato, “Fatal injuries and nonfatal occupational injuries and illnesses involving insects, arachnids, and mites,” Beyond the Numbers: Workplace Injuries, vol. 3, no. 17 (U.S. Bureau of Labor Statistics, August 2014), https://www.bls.gov/opub/btn/volume-3/fatal-injuries-and-nonfatal-occupational-injuries-and-illnesses-involving-insects-arachnids-and-mites.htm
1 For fatal occupational injuries, insect-related cases were found by searching for cases where the source and/or secondary source of the injury was coded 514x insects, arachnids (spiders, ticks, scorpions, etc.) per Occupational Injury and Illness Classification System (OIICS) (see note 4 for more on OIICS). All other case narratives were searched using the following keywords: insect, bug, bee, hornet, wasp, scorpion, yellow jacket, spider, and ant. Due to the subjectivity of classifying cases as insect-related, this analysis may not match results published in other Census of Fatal Occupational Injuries (CFOI) publications.
There are a few limitations of the fatal data that bear mentioning. BLS does not rely on narrative searches in its official data so users are cautioned about comparing data in this analysis to published CFOI figures. To be included in this dataset via a case narrative search, the case narrative must have been sufficiently detailed to return a match. It is possible that some cases were not included because the narrative did not have enough detail to meet the search criteria. In addition, determining inclusion based on case narrative searches is inherently subjective. Even using the same criteria, different cases will be included in the dataset based on the interpretations of different data users.
For nonfatal occupational injuries and illnesses, insect-related cases were identified as cases where the source and/or secondary source on the detailed case report was coded 514x insects, arachnids (spiders, ticks, scorpions, etc.) per OIICS. Microdata case narratives were inspected by the authors but not used in classifying cases. The set of cases used in this analysis matches those used in official Survey of Occupational Injuries and Illnesses (SOII) estimates, but may differ in totals due to rounding.
2 CFOI has published data on all fatal occupational injuries in the United States since 1992. Multiple source documents, including death certificates, workers’ compensation reports, media accounts, police reports, and reports from the Occupational Safety and Health Administration (OSHA), are used to identify and fully detail each fatal occupational injury. More information on CFOI can be found here: https://www.bls.gov/iif/oshcfoi1.htm.
3 SOII publishes data on nonfatal occupational injuries and illnesses. In addition to total case counts and incidence rates by industry and case types, the data include additional detail about the case circumstances and worker characteristics for cases that required at least one day away from work to recuperate. More information on SOII can be found here: https://www.bls.gov/iif/oshcdnew.htm.
4 Both CFOI and SOII employ similar coding structures: OIICS for case circumstances, the Standard Occupational Classification (SOC) system for occupation, and the North American Industry Classification System (NAICS) for industry. OIICS includes coding structures for the nature of the injury, the part of body injured, the source of the injury, the secondary source of the injury (if any), and the event that precipitated the incident. More information on OIICS can be found here: https://www.bls.gov/iif/oshoiics.htm. The full manual is available here: https://www.bls.gov/iif/oiics_manual_2007.pdf. For more information on SOC, please see https://www.bls.gov/soc/. From 2003 to 2008, CFOI and SOII used the 2002 NAICS. For 2009 and 2010, CFOI and SOII used the 2007 NAICS. More information on NAICS can be found here: https://www.bls.gov/bls/naics.htm.
One notable difference between CFOI and SOII is that they differ in the scope of workers they cover. CFOI includes all workers in the United States including the self-employed, federal workers, resident military, and volunteers. SOII does not include the self-employed, federal workers, and resident military. SOII also excludes workers on farms with fewer than 11 employees and most volunteers.
5 See the NIOSH Workplace Safety & Health Topic page for Insects and Scorpions: http://www.cdc.gov/niosh/topics/insects/.
6 See https://www.osha.gov/OshDoc/data_Hurricane_Facts/brown_recluse_spider.pdf, https://www.osha.gov/OshDoc/data_Hurricane_Facts/fire_ants.pdf, and https://www.osha.gov/OshDoc/data_Hurricane_Facts/black_widow_spider.pdf.
7 Photoperiod diapauses cycles, whether reproductive or strictly developmental, can depend on temperature, light, or other ecological factors tied to seasonality. Regardless of which specific factors are involved, we are interested in the common seasonal timing of changes in environmental conditions. See, for example, Saunders, et al., Insect Clocks 3rd Ed. Amsterdam: Elsevier Science, 2002.
8 The first year of the Survey of Occupational Injuries and Illnesses (SOII) with comprehensive coverage of state and local government entities nationwide was 2008. Limiting the reference period to the 3-year window of 2008–2010 maintains consistency in coverage and sampling for the SOII data used. Comparison to the fixed value 4,600 is statistically significant in all 3 years at the 95- percent confidence level.
9 Edwards, G.B., "The Present Status and a Review of the Brown Recluse and Related Spiders, Loxosceles spp. (Areneae: Sicariidae), in Florida", Florida Department of Agriculture and Consumer Services Division of Plant Industry, Entomology Circular No. 406, May/June 2001, p. 3, available online at: http://www.freshfromflorida.com/content/download/9810/135128/ent406.pdf.
10 State level estimates are not available for all state entities and territories covered by the SOII. “State participation in the survey may vary year by year.” See Selby, Burdette, and Huband, “Overview of the Survey of Occupational Injuries and Illnesses Sample Design and Estimation Methodology,” October 2008, available online at: https://www.bls.gov/osmr/research-papers/2008/pdf/st080120.pdf Non-participating states for which estimates are not available are denoted in table 7.
11 These years were as follows: GA 2010, KS 2008, LA 2008–2009, NM 2009–2010, SC 2009, TN 2008, WV 2009. The indicated state–year combinations had days away from work cases in which insects were either the source or secondary source of nonfatal injuries. These case were significantly higher than a value equal to 1 percent share of that state’s overall total days away from work cases estimate at the 95-percent confidence level in those years.
12 For a broader view on temporal variation in SOII data, see Pierce, Brooks, "The Seasonal Timing of Work-Related Injuries," available online at: https://www.bls.gov/osmr/research-papers/2013/st130230.htm
13 Insect-related incidence rates may be linked to other life cycle effects such as maturation speeds and endocrinal changes. Varley, Gradwell, and Hassell, Insect Population Ecology: An Analytical Approach, University of California Press, 1974, Chapter 5: 75-93. In particular, p.81-83 and figure 5.3.
14 Month of occurrence cannot be treated the same way as other variables because it is incorporated into subsampling processes used during SOII data collection. The statistical basis for computational methods used in this paper are from Efron and Tibshirani, “Bootstrap Methods for Standard Errors, Confidence Intervals, and Other Measures of Statistical Accuracy, Statistical Science, Vol.1, No.1, 54-77, available online at: http://projecteuclid.org/download/pdf_1/euclid.ss/1177013815.
Publish Date: Wednesday, August 6, 2014