An official website of the United States government
An official website of the United States government
The .gov means it's official.
Federal government websites often end in .gov or .mil. Before sharing sensitive information,
make sure you're on a federal government site.
The site is secure.
The
https:// ensures that you are connecting to the official website and that any
information you provide is encrypted and transmitted securely.

More BLS articles and information related to higher education are available online at the following links:
Investment in higher education by race and ethnicity, Monthly Labor Review
New education classification better reflects income and spending patterns in Consumer Expenditure Survey, Beyond the Numbers
The job market for recent college graduates in the United States, The Editor’s Desk
On average, education accounts for about 2 percent of total annual expenditures by U.S. consumers, but this percentage varies greatly by demographic.1 Some groups appear to spend much more than others, so it is natural to question what influences this variation in spending.
A popular conception is that racial and ethnic groups value higher education differently. In economic terms, this is a reflection of the value of human capital—how much people are willing to invest in their children’s education. The notion that some groups invest more than others is often based on average participation rates but does not account for actual expenditures or the expenditures when you consider socioeconomic differences. This Beyond the Numbers article looks at the amount of money invested in education by different race and ethnic groups and examines different factors that could contribute to the differences in expenditures.2
We find that race and ethnicity groups do, on average, spend vastly different amounts on education, but the likelihood of going to college (and thus having education expenditures) and socioeconomic factors have the most influence on families’ investment in higher education—and race and ethnicity is not the driving factor, as commonly thought.
For this study, we analyzed 90,872 observations from the Consumer Expenditure Survey (CE) for years 2008 through 2010, and the results indicate that there is more to the story than average expenditures by race and ethnicity.
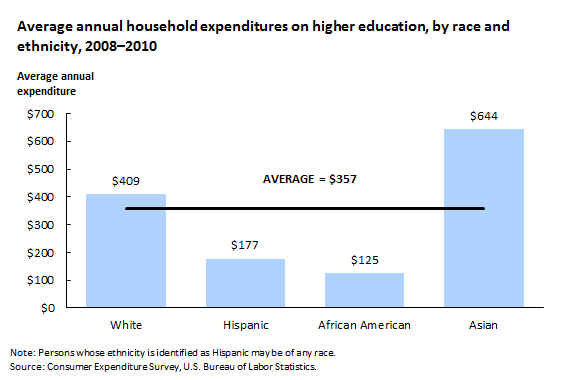
Consumer expenditure data on U.S. households show that, on average, U.S. households spent $357 per year on higher education between 2008 and 2010. Hispanic and African American households spent less for tuition than White households, by 57 percent and 69 percent, respectively. (See chart 1.) Asian households spent 57 percent more for tuition than White households.
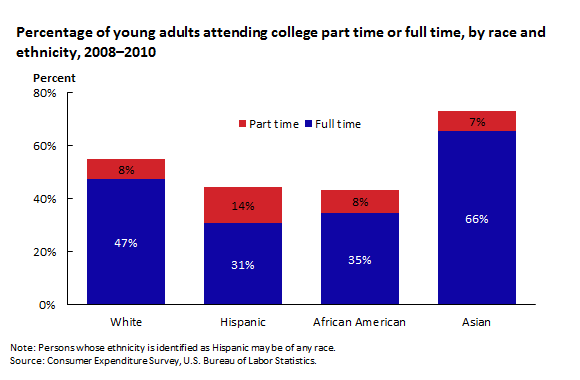
Some of the differences in expenditures are attributable to different higher-education participation rates by various groups. (See chart 2.) According to CE data, Asian families are more likely than other groups to send their children to college and therefore have greater education expenditures, on average. However, average higher-education expenditures across all households are incomplete as they do not distinguish between the families with students who are attending college from those who are not, nor do they compare households of different race and ethnicities on an even socioeconomic level.
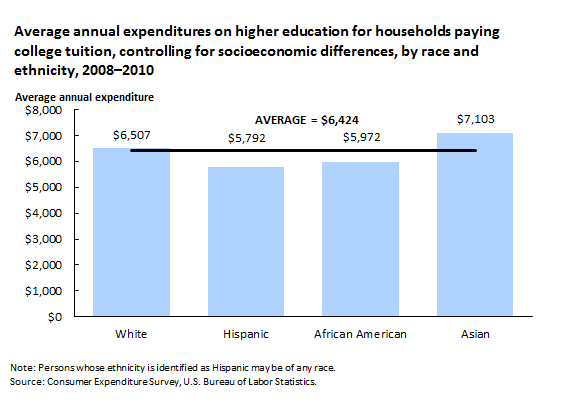
When we analyzed the households with a college student with a tuition expenditure, and accounted for the household income and education level of the parents,3 we found that the differences in tuition expenditures between races and ethnicities converge. For college students with tuition expenditures who have parent(s) with a bachelor’s degree and a median annual income of $70,000, Hispanics and African American households had tuition expenditures that were only 11 and 8 percent lower, respectively, than those made by White households, while Asians had 9 percent higher tuition expenditures than White households. (See chart 3.)
However, these much smaller differences in tuition expenditures are not actually statistically significant. In other words, when you compare families with similar household incomes and parental education levels, the higher education expenditure levels are essentially the same across all race and ethnic groups. As parents' education and income level increase, so do the expenditures for higher education. From another perspective, socioeconomic differences, not differences in race or ethnicity, have a greater influence on how families value higher-education investments.
This Beyond the Numbers summary was prepared by Tian Luo, economist in the San Francisco Division of Economic Analysis and Information, and Richard Holden, regional commissioner in the San Francisco Regional Office, U.S. Bureau of Labor Statistics. Email: luo.tian@bls.gov. Telephone: (415) 625-2286.
Information in this article will be made available to sensory-impaired individuals upon request. Voice phone: (202) 691-5200. Federal Relay Service: 1-800-877-8339. This article is in the public domain and may be reproduced without permission
Tian Luo and Richard J. Holden, “Do different groups invest differently in higher education?” Beyond the Numbers: Special Studies & Research, vol. 3, no. 13 (U.S. Bureau of Labor Statistics, June 2014), https://www.bls.gov/opub/btn/volume-3/do-different-groups-invest-differently-in-higher-education.htm
1 Consumer Expenditures in 2011, U.S. Bureau of Labor Statistics, April 2014, https://www.bls.gov/cex/csxann11.pdf.
2 See Tian Luo and Richard Holden, “Investment in higher education by race and ethnicity,” Monthly Labor Review, March 2014, https://www.bls.gov/opub/mlr/2014/article/investment-in-higher-education-by-race-and-ethnicity.htm.
3 For details on methodology, see Luo and Holden, “Investment in higher education by race and ethnicity,” https://www.bls.gov/opub/mlr/2014/article/investment-in-higher-education-by-race-and-ethnicity.htm.
Publish Date: Monday, June 9, 2014