An official website of the United States government
An official website of the United States government
The .gov means it's official.
Federal government websites often end in .gov or .mil. Before sharing sensitive information,
make sure you're on a federal government site.
The site is secure.
The
https:// ensures that you are connecting to the official website and that any
information you provide is encrypted and transmitted securely.
On December 2, 2014, the number of fatalities in July was corrected in the sentence: July had the highest number of fatal occupational injuries (11,168), and the fewest number of injuries occurred in February (8,008). Also, the word “average” was erroneously used to describe the “total” number of fatal injuries during the winter months. The sentence was corrected to: In comparison, the winter months of December, January, and February totaled 25,380 fatal injuries (22 percent).

More BLS articles and information related to fatal occupational injuries are available at the following links:
Fatalities in the construction industry: findings from a revision of the BLS Occupational Injury and Illness Classification System, Monthly Labor Review
Comparing fatal work injuries in the United States and the European Union, Monthly Labor Review
Death on the job: fatal work injuries in 2011, Beyond the Numbers
The Bureau of Labor Statistics (BLS) Census of Fatal Occupational Injuries (CFOI) is the federal government’s preeminent source for data on fatal injuries in the workplace. CFOI publishes demographic and employment information about deceased workers (referred to as “decedents” by CFOI) as well as detailed data on the fatal incidents.
On October 1, 1993, CFOI published the first comprehensive nationwide data on fatal occupational injuries in the United States. These data, which recorded fatal injuries for calendar year 1992, marked the beginning of a data series that has been used by governmental agencies, safety and health entities, academic institutions, and others to identify trends in workplace deaths and to work towards eliminating future work-related fatal injuries.
Over the years, CFOI has collected and published a wealth of information about on-the-job fatal injuries. This issue of Beyond the Numbers highlights some interesting facts and data from the first 20 years of the Census of Fatal Occupational Injuries.
CFOI uses multiple source documents to identify and provide detail on fatal occupational injuries. Using a wide range of documents, including death certificates, workers’ compensation reports, media reports, and Occupational Safety and Health Administration (OSHA) reports, CFOI publishes more than 20 data elements (such as occupation, industry, race and ethnicity, and gender), providing information by way of millions of individual data points related to fatal work injuries.
From 2007 to 2011, 94 percent of CFOI cases had a death certificate as a source document. Media reports (72 percent); coroner, medical examiner, and autopsy reports (51 percent); and OSHA reports (38 percent) were also commonly utilized in CFOI. During this same period, an average of four unique source documents substantiated each CFOI case.
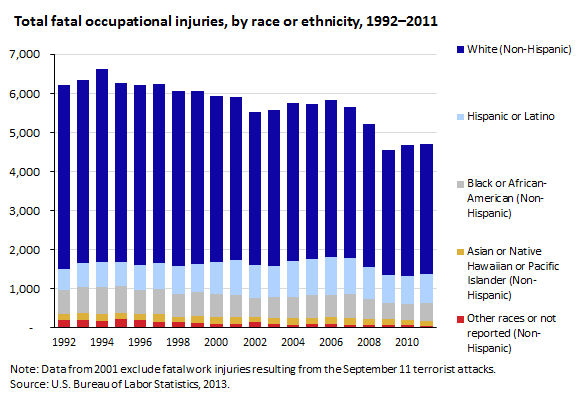
During the 20-year period from 1992 to 2011, 115,091 workers were killed from injuries incurred while on the job.1 Annual totals ranged from a low of 4,551 in 2009 to a high of 6,632 in 1994. (See chart 1.)
Total fatal occupational injuries have decreased 25 percent from 1992 to 2011. The 10-year averages are telling: From 1992 to 2001, an average of 6,184 workers died from injuries that happened on the job annually. From 2002 to 2011, that figure was 5,325.
In 1994, the year with the highest number of fatal occupational injuries, a worker died every 79 minutes, on average. In 2009, the year with the lowest number, a worker died every 115 minutes, on average.
Certain data elements can provide insights into common characteristics and trends of fatally injured workers. The following sections describe the proportion of workers who were fatally injured as a percentage of all fatally injured workers.
Gender. More than 9 out of every 10 fatal occupational injuries recorded from 1992 through 2011 were incurred by men (106,194 fatalities). The ratio of men to women stayed relatively consistent throughout the 20-year period; the number of women who were fatally injured ranged from a low of 335 workers (7 percent of the total) in 2009 to a high of 539 (9 percent) in 1995. The number of men who were fatally injured reached a high in 1994 with 6,104 fatal injuries and dropped to a series low in 2009 with 4,216.
Race and ethnicity. Nearly 72 percent (82,794) of all fatally injured workers were White, non-Hispanic workers. Hispanic or Latino workers (13 percent, or 15,213 workers) constituted the next largest group of fatal occupational injuries by race or ethnicity, followed by non-Hispanic Black or African American workers (10 percent, 11,405). These figures hew closely to the proportion of hours worked by each race or ethnicity for 2011. White, non-Hispanics worked 69 percent of all hours, Hispanics or Latinos worked 15 percent of hours, and Blacks or African American, non-Hispanics worked 10 percent.2
Country of origin. For the years that CFOI collected complete data on country of origin (2001 to 2011), 17 percent (10,100 of 59,167) of the decedents were born outside of the United States. These decedents came from more than 125 different countries; the most common foreign birthplaces were Mexico (4,250), India (361), El Salvador (342), and Guatemala (342).
Age. Just under half of all fatal occupational injuries were incurred by workers age 35 to 44 (23 percent, or 26,945 workers) or 45 to 54 (22 percent, 25,799). Fatally injured workers of all ages are represented in CFOI: 38 fatally injured workers were under the age of 10 and 62 were older than the age of 90. Although workers age 65 and older accounted for only 4 percent of the hours worked in 2011, they accounted for 12 percent of those fatal occupational injuries in that year.
Twenty percent (23,022) of all fatal occupational injuries were incurred by self-employed workers; wage and salary workers made up the remaining 80 percent (92,066).
Private sector workers made up 90 percent (103,430) of all fatal occupational injuries between 1992 and 2011. The remaining 10 percent worked in the public sector: 5 percent (6,223) of the workers were employed by local governments, 3 percent (3,046) worked for the federal government, and 2 percent (2,257) were employed by state government entities.
CFOI publishes data on the industry in which the decedent was employed at the time of the incident.
Some industries saw their share of fatalities increase from 1992 to 2011.3 A total of 14 percent of the decedents in 1992 were employed in the private transportation and public utilities sector. By 2011, that share had increased to 17 percent. A total of 15 percent of the decedents worked in the private construction industry in 1992; that figure increased to 16 percent in 2011.
Other industries experienced large decreases in their share of fatalities from 1992 to 2011. In 1992, 16 percent of decedents worked in the private sector trade (retail and wholesale) industry. By 2011, the figure had decreased to 10 percent. Manufacturing accounted for 12 percent of the fatalities in 1992, but 7 percent in 2011.
CFOI publishes data on the occupation in which the decedent was working when the incident occurred.
Transportation and material moving occupations accounted for the largest number of fatalities of any occupation group in both 1992 and 2011.4 The 1992 figure accounted for 18 percent of all fatal occupational injuries and the 2011 figure accounted for 26 percent. Those in construction occupations (except supervisors) accounted for 8 percent of fatalities in 1992 and 11 percent in 2011.
Workers in sales occupations accounted for 8 percent of deaths in 1992 and 5 percent in 2011. Workers in farming, forestry, and fishing occupations accounted for 15 percent of deaths in 1992 and 11 percent in 2011.5
In addition to gathering worker characteristics of the decedent, CFOI also captures information regarding the nature of the incident. The event captures the type of incident that precipitated the fatal injury.6 Over the 20-year span, 42 percent of fatal occupational injuries were the result of transportation incidents, making it the leading fatal injury event for the period. The next most common events included violence and other injuries by persons or animals (17 percent), contact with objects and equipment (16 percent), and falls (12 percent).
Although the annual total of fatal occupational injuries has decreased since 1992, the composition of that total has shifted. The most common singular event leading to a fatal occupational injury in both 1992 and 2011 was a roadway incident: 19 percent of all occupational fatalities in 1992 and 24 percent in 2011. Roadway incidents have increased as a percentage of all fatalities over the 20-year span, and homicides have fallen. In 1992, homicides accounted for 17 percent of all fatalities, and in 2011, they accounted for 10 percent.
Falls to a lower level increased as a percentage of all fatalities from 8 percent in 1992 to 12 percent in 2011. Contact with electricity, on the other hand, went from 5 percent of fatalities in 1992 to 4 percent of fatalities in 2011.
A total of 80,645 workers were fatally injured during the day (7 a.m. to 6:59 p.m.) from 1992 to 2011. Another 26,631 were fatally injured during the night and evening hours (7 p.m. to 6:59 a.m.). For 7,815 cases, time of incident was unknown.
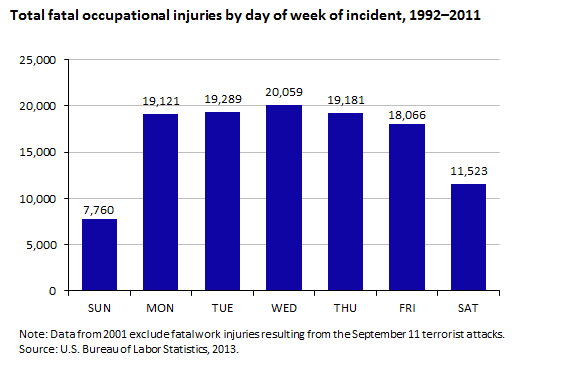
The majority (83 percent) of all fatal occupational injuries occurred during the traditional workweek, Monday through Friday. (See chart 2.)
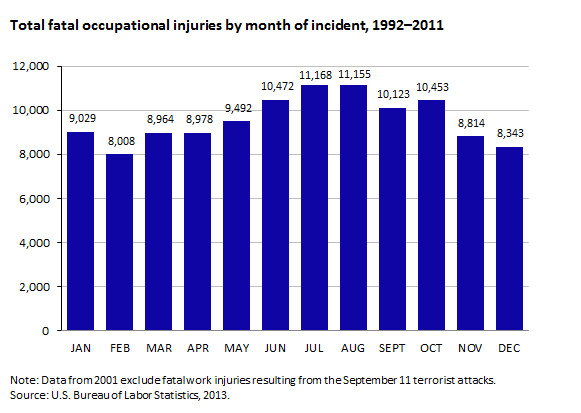
July had the highest number of fatal occupational injuries (11,168), and the fewest number of injuries occurred in February (8,008). Just over a quarter of workers (28 percent, or 32,795) were fatally injured during the summer months of June, July, and August. In comparison, the winter months of December, January, and February totaled 25,380 fatal injuries (22 percent). (See chart 3.)
Fatal injuries occurred most frequently on a street or highway (35,746 deaths, or 31 percent) or at an industrial place or premise (25,879 or 22 percent). These major location categories include state and U.S. highways (10,393), local roads or streets (10,163), construction sites (8,107), interstates or freeways (7,649), and factories or plants (4,913).
In addition to the number of fatal occupational injuries, CFOI publishes data on the rate at which these injuries occur for workers by employee status, gender, age, race or ethnicity, occupation, and industry.7 Fatal injury rates depict the risk of incurring a fatal occupational injury faced by all workers or a group of workers and can be used to compare risk among worker groups with varying employment levels.
Data for 2011 are presented for fatal injury rates as CFOI used different methods to calculate rates over the 20-year time period. For general comparison, the 1992 fatal injury rate for all workers was approximately 5 fatal occupational injuries per 100,000 workers employed.
The following data are for 2011, when the rate for all workers was 3.5 fatal occupational injuries per 100,000 full-time equivalent workers.
Employee status. Self-employed workers had a rate of 13.1 fatal occupational injuries per 100,000 workers, while wage and salary workers had a rate of 2.9.
Gender. Male workers had a rate of 5.7 fatal occupational injuries per 100,000 workers, while female workers had a rate of 0.7.
Age. Workers age 65 and older had a rate of 11.0 fatal occupational injuries per 100,000 workers, which was more than 3 times the rate for all workers. All other age groups had a rate closer to the all-worker rate.
Race and ethnicity. Hispanic or Latino workers had a rate of 4.0. White, non-Hispanic, workers had a rate of 3.6. Black or African American, non-Hispanic workers had a rate of 3.3.
Occupation. Occupations with high fatal injury rates included fishers and related fishing workers (127.3 fatal occupational injuries per 100,000 workers), logging workers (104.0), and aircraft pilots and flight engineers (56.1).
Industry. Industry groups with high fatal injury rates included agriculture, forestry fishing, and hunting (24.9); mining, quarrying, and oil and gas extraction (15.9); and transportation and warehousing (15.3).
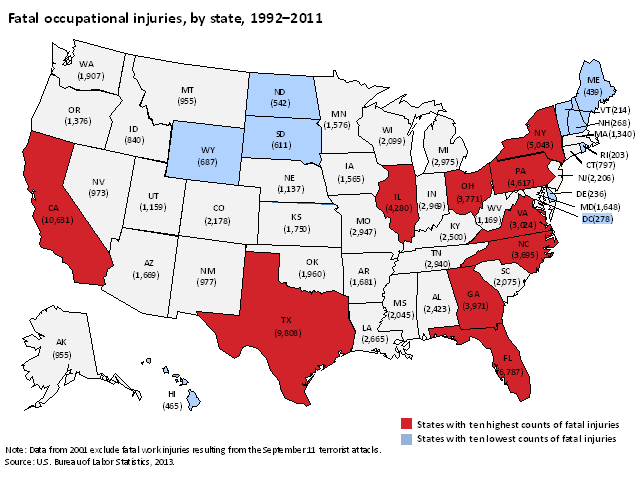
CFOI collects fatal occupational injury data in 55 states and jurisdictions across the United States and its territories. For the 50 states and the District of Columbia from 1992 to 2011, California was the state with the highest number of fatal occupational injuries, with 10,631. Texas had the second highest number (9,808). These two states alone accounted for 18 percent of all fatal occupational injuries over the period. Just under half (48 percent, 55,627) of all fatal occupational injuries occurred in the top 10 states, which is not surprising because these 10 states accounted for 51 percent of the hours worked in 2011.8 The 9 states and the District of Columbia with the fewest total fatal occupational injuries constituted only 3 percent of total fatalities and 3 percent of the hours worked. Rhode Island had the lowest number of fatal occupational injuries (203).
This issue of Beyond the Numbers highlights the types of data that are available from CFOI and discusses some of the long-term trends shown in the last 20 years. For more information, data can be accessed from the CFOI homepage at https://www.bls.gov/iif/oshcfoi1.htm.
Custom data queries can be submitted via the IIF Online Profiles system here: https://data.bls.gov/gqt/InitialPage.
Articles using CFOI data can be found here: https://www.bls.gov/iif/publications.htm.
More information on CFOI in general can be found here: https://www.bls.gov/opub/hom/pdf/homch9.pdf.
Two tables of particular note:
All worker data from 1992 to 2002: https://www.bls.gov/iif/oshwc/cfoi/cftb0186.pdf.
All worker data from 2003 to present: https://www.bls.gov/iif/oshwc/cfoi/all_worker.pdf.
This Beyond the Numbers summary was prepared by Laura Kesy and Steve Pegula, economists in the Office of Compensation and Working Conditions, U.S. Bureau of Labor Statistics. Email: iifstaff@bls.gov. Telephone: (202) 691-6216.
Information in this article will be made available to sensory-impaired individuals upon request. Voice phone: (202) 691-5200. Federal Relay Service: 1-800-877-8339. This article is in the public domain and may be reproduced without permission.
Laura Kesy and Stephen Pegula, “Census of Fatal Occupational Injuries commemorates 20 years of occupational safety and health data,” Beyond the Numbers: Workplace Injuries, vol. 3, no. 23 (U.S. Bureau of Labor Statistics, October 2014), https://www.bls.gov/opub/btn/volume-3/census-of-fatal-occupational-injuries-commemorates-20-years.htm
1 Data from 2001 exclude fatal work injuries resulting from the September 11 terrorist attacks; data from 1995 include fatal work injuries resulting from the Oklahoma City bombing. See https://www.bls.gov/iif/oshwc/cfoi/cfnr0008.pdf for a detailed look at fatal work injuries resulting from the September 11th attacks.
2 These employment figures and those in the age section are taken from the hours-worked data used by CFOI to calculate fatal injury rates. These data do not include certain groups, notably volunteers, members of the resident military, and workers age 15 and younger. See https://www.bls.gov/iif/oshnotice10.htm for more information on how CFOI calculates fatal injury rates.
3 CFOI used different industry classifications systems during the 20-year period. From 1992 to 2002, CFOI used the Standard Industrial Classification (SIC) system to define industry. From 2003 to 2011, CFOI used the North American Industry Classification System (NAICS). The 2002 NAICS was used from 2003 to 2008, while the 2007 NAICS was used from 2009 to 2011. While data from these two systems are generally not comparable, the authors have identified a few industries in the private sector to compare between 1992 and 2011.
4 CFOI used different occupation classification systems during the 20-year period. From 1992 to 2002, CFOI used the Census Bureau occupational classification system to define occupation. From 2003 to 2011, CFOI used the Standard Occupational Classification (SOC) system. The SOC 2000 was used from 2003 to 2010, while the SOC 2010 was used in 2011. While the data from these two systems are generally not comparable, the authors have identified a few occupation groups to compare between 1992 and 2011.
5 The 2011 figure includes SOC 45* Farming, fishing, and forestry occupations and SOC 11-901*Agricultural managers.
6 CFOI used different event classification systems during the 20-year period. From 1992 to 2010, CFOI used the original Occupational Injury and Illness Classification System (OIICS). In 2011, CFOI began using the OIICS, version 2.01. While data from these two systems are generally not comparable, the authors have identified a few events to compare between 1992 and 2011.
7 More information on the fatal injury rates can be found here: https://www.bls.gov/iif/oshnotice10.htm.
8 These employment figures are taken from the hours-worked data used by CFOI to calculate state fatal injury rates. See Chapter 9 of the BLS Handbook of Methods, https://www.bls.gov/opub/hom/pdf/homch9.pdf, for more information.
Publish Date: Friday, October 17, 2014