An official website of the United States government
An official website of the United States government
The .gov means it's official.
Federal government websites often end in .gov or .mil. Before sharing sensitive information,
make sure you're on a federal government site.
The site is secure.
The
https:// ensures that you are connecting to the official website and that any
information you provide is encrypted and transmitted securely.

More BLS articles related to the consumer spending or the automobile industry are available online at the following links:
“Americans' aging autos,” The Editor's Desk
“Labor costs in the auto industry,” The Editor's Desk
“Automobiles,” Spotlight on Statistics
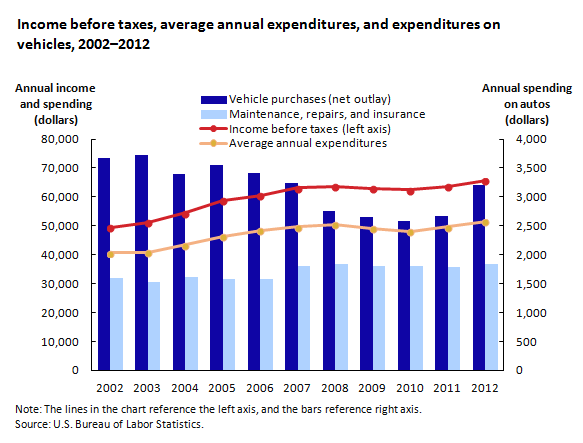
From 2008 to 2012, the average age of U.S. households’ vehicles increased as owners held on to their cars, trucks, and vans longer. The trend in aging autos coincides with declines in average household income in 2008; however, subsequent recovery in households’ incomes and a return to previous levels of expenditures on vehicles in 2012 do not appear to have reversed the pattern of aging. (See chart 1.) Analysis of data from the Bureau of Labor Statistics Consumer Expenditure Survey suggests that households continued to own the same number of vehicles over the last 10 years, but are owning their vehicles longer.
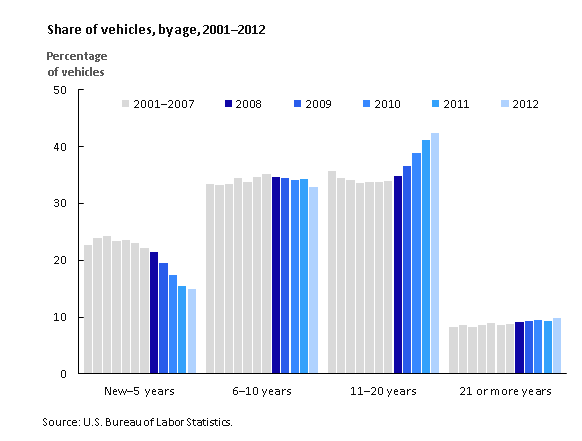
The average age of households’ cars, vans, sport utility vehicles (SUVs), and trucks increased from 10.1 years in 2007 to just over 11.3 years in 2012. Chart 2 shows that the share of newer vehicles (those manufactured less than 5 years earlier than the year shown) dropped by nearly 33 percent from 2007 to 2012 while the share of vehicles 11–20 years old grew by 25 percent over the same timeframe.
The average age of cars, vans, SUVs, and trucks reported in the survey all increased at similar rates from 2001 to 2012, even as the share of trucks and vans increased from 36.2 percent to 47.3 percent.
For households that reported disposing of a vehicle during 2012, the average age of the vehicles sold was 15 years, the average vehicle donated or given away was 14 years old, and the average vehicle traded in (toward the value of a new car) was 9 years old. Roughly one-third of all vehicles in the survey were paid for in part with the trade-in of a vehicle. For owned vehicles paid for with a trade-in credit, the credit accounted for 32 percent of the net purchase price of the new vehicle.
Higher income households tended to own more vehicles (2.4 vehicles for the highest income quintile, compared with 1.4 vehicles for the lowest quintile). For all income groups, the ratio of vehicles to household members age 16 and older remained constant at just over 1:1 from 2001 to 2012. Household members living in single-family detached dwellings owned the most vehicles (2.1), while occupants of high-rise apartments or dormitories owned the fewest (1.1). Rates of vehicle ownership remained constant for households, with the exception of multifamily residences, such as duplexes and garden-style and high-rise apartments, for which the number of vehicles per household declined 6 percent since 2001.
The average annual maintenance cost per vehicle climbed from $514 in 2011 to $5371 in 2012, not including average car insurance expenditures of $593 per vehicle and auto repair service policies averaging $7 per vehicle. It is worth noting that insurance and repair service policy expenditures are highest for households with newer cars, and higher expenditures on these items are likely associated with lower out-of-pocket expenditures for other vehicle repairs reported in the survey.
In 2012, households owning vehicles less than 5 years old—not surprisingly—reported the lowest maintenance and repair costs per vehicle. Households with vehicles averaging 6–15 years of age paid $151 more per vehicle per year, on average, for maintenance and repair than did households with newer vehicles. Interestingly, average maintenance and repair expenditures per vehicle dropped 16 percent as the average age of the vehicle increased to 16-20 years and then dropped by another 5 percent as the vehicle’s age went beyond 20 years, before rising slightly as the age of the vehicle reached 26 years or older.
Table 1 shows that declining expenditures on routine maintenance, such as oil changes, tire repair or replacement, body work, brakework, front-end alignment, and vehicle cleaning, are associated with older vehicles. Motor tuneups, electrical system repairs, exhaust system repairs, engine cooling system repairs, and related fluid costs peak for vehicles in the 11- to 15-year age range and remain higher for vehicles older than 15 years. Of all expenditures, those for vehicle parts, equipment, and accessories increase most as vehicles age. Also, higher expenditures for motor repair and replacement are observed in vehicles 26 years and older. The higher expenditures associated with vehicles in that age range appear to be heavily influenced by owners of classic cars.
| Selected maintenance and repair expenses | All | Average age of household vehicle(s) | ||||||
|---|---|---|---|---|---|---|---|---|
| New–5 years | 6–10 years | 11–15 years | ||||||
| Expenditure Level | Frequency (in percent) | Expenditure Level | Frequency (in percent) | Expenditure Level | Frequency (in percent) | Expenditure Level | Frequency (in percent) | |
Average annual maintenance/repair expenditure | $546 | ... | $437 | ... | $588 | ... | $576 | ... |
Tires—purchased, replaced, installed/repair tires and other repair work | $132.46 | 16 | $127.73 | 11 | $164.24 | 17 | $124.88 | 16 |
Lube, oil change, and oil filters | 54.11 | 41 | 63.75 | 41 | 65.54 | 47 | 50.32 | 40 |
Motor repair, replacement | 48.02 | 3 | 13.68 | 1 | 39.89 | 3 | 56.54 | 4 |
Brake work, including adjustments | 40.82 | 6 | 25.48 | 3 | 48.75 | 7 | 44.81 | 7 |
Motor tuneup | 37.18 | 5 | 30.33 | 4 | 37.81 | 6 | 42.25 | 6 |
Parts, equipment, and accessories | 29.98 | 10 | 15.32 | 5 | 24.12 | 9 | 32.19 | 12 |
Vehicle air-conditioning repair/electrical system repair | 28.92 | 4 | 3.59 | 1 | 32.08 | 4 | 35.49 | 5 |
Repair to steering or front end/front-end alignment, wheel balance, and rotation | 28.84 | 5 | 19.86 | 5 | 32.95 | 6 | 28.80 | 5 |
Clutch, transmission repair | 21.35 | 1 | 8.66 | 0 | 21.70 | 1 | 27.08 | 1 |
Bodywork and painting | 18.53 | 1 | 29.04 | 1 | 18.17 | 1 | 16.45 | 1 |
Repair to engine cooling system | 12.83 | 2 | 3.78 | 1 | 8.99 | 1 | 21.43 | 3 |
Exhaust system repair | 8.34 | 1 | 1.62 | 0 | 6.71 | 1 | 12.49 | 1 |
Auto repair service policy | 7.23 | 0 | 18.41 | 1 | 9.12 | 1 | 4.09 | 0 |
Vehicle products and cleaning services | 6.99 | 7 | 10.85 | 8 | 8.72 | 8 | 5.64 | 6 |
Shock absorber, replacement | 4.51 | 0 | 0.62 | 0 | 4.73 | 0 | 6.45 | 1 |
Coolant, brake fluid, transmission fluid, and other additives | 3.11 | 6 | 1.10 | 2 | 1.93 | 4 | 3.80 | 7 |
Vehicle audio and video equipment | 2.50 | 0 | 2.75 | 0 | 2.54 | 0 | 3.25 | 1 |
Miscellaneous auto repair, servicing/gas tank repair, replacement (from Diary Survey) | 60.11 | 6 | — | — | — | — | — | — |
See footnotes at end of table. | ||||||||
| Selected maintenance and repair expenses | Average age of household vehicle(s) | |||||
|---|---|---|---|---|---|---|
| 16–20 years | 21–25 years | 26 or more years | ||||
| Expenditure Level | Frequency (in percent) | Expenditure Level | Frequency (in percent) | Expenditure Level | Frequency (in percent) | |
Average annual maintenance/repair expenditure | $483 | ... | $457 | ... | $502 | ... |
Tires—purchased, replaced, installed/repair tires and other repair work | $96.03 | 2 | $78.80 | 14 | $61.86 | 15 |
Lube, oil change, and oil filters | 36.21 | 31 | 30.16 | 28 | 25.36 | 24 |
Motor repair, replacement | 69.41 | 4 | 58.16 | 4 | 81.83 | 5 |
Brake work, including adjustments | 29.58 | 6 | 30.66 | 6 | 17.02 | 6 |
Motor tuneup | 32.69 | 5 | 33.57 | 5 | 23.72 | 4 |
Parts, equipment, and accessories | 34.07 | 13 | 29.93 | 14 | 132.27 | 16 |
Vehicle air-conditioning repair/electrical system repair | 30.50 | 5 | 18.95 | 4 | 18.80 | 5 |
Repair to steering or front end/front-end alignment, wheel balance, and rotation | 28.11 | 5 | 22.61 | 4 | 22.43 | 3 |
Clutch, transmission repair | 16.13 | 1 | 31.10 | 3 | 10.52 | 1 |
Bodywork and painting | 14.87 | 1 | 22.80 | 1 | 16.11 | 2 |
Repair to engine cooling system | 10.31 | 2 | 14.01 | 2 | 11.80 | 3 |
Exhaust system repair | 10.43 | 1 | 4.45 | 1 | 4.90 | 1 |
Auto repair service policy | 1.94 | 0 | 4.06 | 0 | 2.94 | 0 |
Vehicle products and cleaning services | 3.87 | 5 | 3.42 | 4 | 4.14 | 5 |
Shock absorber, replacement | 1.96 | 0 | 7.97 | 1 | 1.37 | 0 |
Coolant, brake fluid, transmission fluid, and other additives | 5.48 | 10 | 5.45 | 11 | 4.45 | 10 |
Vehicle audio and video equipment | 1.10 | 0 | 0.57 | 0 | 2.14 | 1 |
Miscellaneous auto repair, servicing/gas tank repair, replacement (from Diary Survey) | — | — | — | — | — | — |
Note: 23,026 consumer units with one or more vehicles = 100 percent. Dashes indicate expenditures measured only in the Consumer Expenditure Diary Survey. The age of vehicles is not observed in the Diary data, so the average expenditure is assumed to be uniformly distributed across the average vehicle age. Zero indicates less than 0.5 percent. Source: Bureau of Labor Statistics. | ||||||
Households headed by individuals under the age of 25 and individuals over the age of 65 had the highest average vehicle age (just over 11 years old) and reported spending similar amounts on vehicle maintenance and repair ($480 per vehicle, by those under age 25 and $499 per vehicle, by those over age 65). Households headed by individuals 55–64 years old reported spending the most of all households on vehicle maintenance and repair ($607 per vehicle) and had an average vehicle age of just under 11 years old.
Although vehicle maintenance and repair expenditures as a percentage of income before taxes increased slightly, from 1.4 percent in 2007 to 1.6 percent in 2012, household members looking to reduce expenses found that the cost of maintaining an aging vehicle pales in comparison to the cost of purchasing a newer vehicle. Among households that purchased vehicles in 2012, the net purchase price after discount, trade-in, or rebate equaled 34 percent of the family’s annual income before taxes for new vehicles and 16 percent for used vehicles. These percentages are down slightly from 37 percent for new vehicles in 2004 and little changed for used vehicles that same year. Note, however, that the percentage for used vehicles peaked at 20 percent in 2008, driven largely by lower middle income households spending 34 percent of their average income before taxes for the purchase of used vehicles.
Consumer Expenditure Survey data suggest that, constrained by declining incomes starting at the end of 2008, many households delayed purchasing a new vehicle or purchased an older vehicle to reduce expenses. Given that income, expenditures in general, and expenditures on vehicles returned to prerecession levels in 2012, it remains to be seen if households will return to their old habits of buying newer vehicles, reversing the trend toward keeping cars longer described in this article.
This Beyond the Numbers summary was prepared by Ryan Pfirrmann-Powell, economist in the Office of Prices and Living Conditions, U.S. Bureau of Labor Statistics. Email: pfirrmann-powell.ryan@bls.gov, telephone: (202) 691-7954.
Information in this article will be made available upon request to individuals with sensory impairments. Voice phone: (202) 691-5200. Federal Relay Service: 1-800-877-8339. This article is in the public domain and may be reproduced without permission
Ryan Pfirrmann-Powell, “Americans’ aging autos,” Beyond the Numbers: Prices & Spending, vol. 3, no. 9 (U.S. Bureau of Labor Statistics, May 2014), https://www.bls.gov/opub/btn/volume-3/americans-aging-autos.htm
i This estimate includes $59.99 for miscellaneous auto repair and servicing and $1.34 for gas tank repair or replacement; data on both types of maintenance are collected exclusively in the Consumer Expenditure Diary Survey. These expenditures are uniformly distributed in the analysis of average maintenance and repairs by average vehicle age because data on the age of vehicles are collected only in the Interview Survey.
Publish Date: Thursday, May 8, 2014