An official website of the United States government
An official website of the United States government
The .gov means it's official.
Federal government websites often end in .gov or .mil. Before sharing sensitive information,
make sure you're on a federal government site.
The site is secure.
The
https:// ensures that you are connecting to the official website and that any
information you provide is encrypted and transmitted securely.

The Producer Price Index (PPI) for natural gas, measured on an annual average basis, fell 56.8 percent between 2007 and 2012, in response to strong growth in domestic energy production. The application of horizontal hydraulic fracturing (fracking) to shale rock formations contributed significantly to this increase in supply, as the technique boosted natural gas production yield by more than 25 percent over this period.
Since 2007, the PPI for natural gas has exhibited marked volatility. Chart 1 presents an indexed view of natural gas prices and domestic natural gas production from 2007 through 2012.1
Since shale gas has been a key player in domestic natural gas production for only a few years, and because it has been tracked over a relatively short period (since 2007) by the Energy Information Administration (EIA), analysts find that it is difficult to quantify precisely the effects that shale gas has had on natural gas prices. However, data indicate that increasingly higher natural gas prices during the first half of 2008 lured additional shale gas to the market. As natural gas prices peaked in July 2008, drilling activity (as measured by rig counts) hit an all-time high.2 Eventually, effects of oversupply took hold.
The EIA notes that, “increased natural gas supply tends to dampen prices. In turn, lower prices can erode incentive for drilling, which eventually results in decreased production.”3 Since 2008, this has held true for domestic rig counts. In September 2008, the natural gas rig count peaked at 1,585 rigs; but by November 2012, the total rig count fell 73.4 percent to 421 rigs.4 The New York Mercantile Exchange (NYMEX) natural gas futures closing price, which hit $8.39 on August 27, 2008, plummeted to $3.47 by October 29, 2012—a decrease of 58.5 percent.5 With prices currently well below their 2008 peak, producers have cut back on new drilling activity to avoid oversupply in the natural gas market. However, despite the slowdown in drilling activity, overall production has continued to rise, due to expanded horizontal hydraulic fracturing to shale rock formations. In terms of demand, domestic consumption increased 9.4 percent between 2008 and 2012, chiefly due to increased demand from the electric power sector, which rose 37 percent between 2008 and 2012.6 The vast majority of electric power is generated from coal and natural gas. As the price of natural gas fell relative to that of coal, the electric power generation sector increased natural gas consumption and reduced coal consumption.7
Examining growth in shale gas production may shed further light on the downward trend in natural gas prices. EIA data show domestic natural gas production increased 24.5 percent from January 2007 to December 2012. After 2007, the role of shale gas expanded, while extraction from all other sources shrank. From 2007 to 2011, yearly natural gas production less shale gas production decreased 11.9 percent. In 2008, production from shale formations increased 44.2 percent, 37.9 percent in 2009, 47.0 percent in 2010, and 46.1 percent in 2011. Shale production in 2011 was approximately 8.5 million of million cubic feet (MMcf), an overall increase of 327.2 percent from 2007.8 As a percentage of all production, gas from shale formations increased from 8.1 percent in 2007 to 29.9 percent in 2011, while total extraction (gas removed from wells, coal beds, shale formations, etc.) rose 15.5 percent―from 24.6 million MMcf in 2007 to 28.5 million MMcf in 2011. Chart 2 highlights the increasingly substantial role shale gas plays in the domestic natural gas market.
In addition, EIA notes the expanded role shale gas is expected to have in the future. Annual Energy Outlook 2013 projects that U.S. natural gas production will rise an estimated 44 percent over the next 30 years, with much of this increase in production expected to come from shale gas extraction.9 Shale gas is projected to grow from 7.8 million MMcf extracted in 2011, to 16.7 million MMcf in 2040. Chart 3, derived from Annual Energy Outlook 2013, illustrates the important role shale gas is expected to take.10
Between 2007 and 2011, U.S. shale gas production made significant strides, compared with other gas extraction methods. In the future, shale gas production is expected to increase, while every other extraction method likely will remain steady or decline. Increased availability of affordable natural gas also may have an influence on the broader energy market. For example, natural gas has cut into coal’s long-standing dominance as an input to electric power generation. Eventually, affordable, compressed natural gas could compete on a wider scale with diesel fuel to power commercial and mass transit vehicles.
With the potential combination of low prices and high-production levels, natural gas has a promising future in the domestic energy market. Utilizing existing natural gas extraction technologies―specifically, horizontal hydraulic fracturing―should provide the United States with abundant natural gas supplies that likely will continue for decades.
Following a 0.8-percent decrease in the fourth quarter of 2012, the PPI for finished goods advanced 0.3 percent in the first quarter of 2013.11 Accounting for roughly 75 percent of this upturn, price declines for finished energy goods slowed to 0.9 percent from December to March, after dropping 4.5 percent in the previous 3-month period. The index for finished goods less foods and energy increased 0.5 percent, after moving up 0.2 percent in the preceding quarter, while prices for finished consumer foods moved up at essentially the same rate, 1.0 percent, compared with 0.9 percent. (See chart 4.)12 At the earlier stages of processing, prices received by producers of intermediate materials, supplies, and components also moved up 0.3 percent in the first quarter subsequent to a 0.8-percent decrease in the fourth quarter of 2012. Leading this reversal, the index for intermediate goods less foods and energy climbed at a faster rate than it had from September to December, while prices for intermediate energy goods fell at a much slower rate from December to March, compared with the prior quarter. However, the index for intermediate foods and feeds declined at a faster rate in the first quarter. In contrast to prices for more highly processed finished and intermediate goods, the index for crude materials for further processing fell 2.1 percent in the first quarter of 2013, following a 1.9-percent rise in the fourth quarter of 2012. This downturn was broad based, with prices for crude energy goods (in particular, natural gas and coal), crude foodstuffs and feedstuffs, and crude nonfood materials less energy decreasing following advances in the previous quarter.
Following a 9.2-percent drop in the final quarter of 2012, crude petroleum prices inched down 1.3 percent in the first quarter of 2013. From mid-December to mid-February, in anticipation of stronger demand, futures prices for Cushing, OK, light sweet crude oil jumped 13.0 percent.13 However, over the first quarter of 2013, supply and production remained abundant. Crude oil stocks remained well above their 5-year averages, and weekly U.S. production of crude oil, at over 7 million barrels per day, was more than 20 percent higher than a year earlier.14 As a result, by mid-March, spot prices for light sweet crude oil had fallen 4.3 percent. For the PPI, after rising from December through February, the crude petroleum index dropped 14.1 percent in March. The PPIs for refined petroleum products moved in similar fashion from December to March. Leading the acceleration in intermediate core prices, the index for basic organic chemicals—which is highly responsive to crude oil fluctuations—climbed 5.8 percent in the first quarter after edging up 0.8 percent in the fourth quarter of 2012.
Leading the downturn in prices for crude goods, the natural gas index dropped 9.6 percent in the first quarter of 2013, following a 35.2-percent surge in the fourth quarter. (After reaching a 10-year low in May 2012, natural gas prices rebounded 74.5 percent over the final 7 months of 2012.) In 2012, natural gas reserves in underground storage remained near the top of their 5-year historical range, but colder-than-normal temperatures in January and March dropped these levels back to the middle of their 5-year range.15 For crude foodstuffs and feedstuffs, the downturn was led by steep reversals in prices for slaughter hogs and grains. Lower pork exports, combined with continued strong pork production, contributed to the decline in slaughter hog prices.16 For grains, the crop outlook for both corn and wheat were improved, compared with last year’s drought-affected harvest.17 In terms of basic industrial materials, softening in prices for metals, such as nonferrous scrap, iron ores, and gold ores, were major factors in the reversal in crude core prices.
For the 3 months ended in March, finished energy goods prices fell 0.9 percent, subsequent to a 4.5-percent decrease from September to December. A major factor contributing to this slower rate of decline was gasoline prices, which moved down 2.2 percent from December to March, compared with an 11.2-percent drop in the preceding quarter. The indexes for home heating oil and kerosene turned up, after falling in the 3 months ended in December. In contrast, price advances for residential electric power slowed to 0.7 percent in the first quarter of 2013, compared with a 1.3-percent gain in the previous 3-month period. The index for residential natural gas also rose less from December to March and prices for diesel fuel fell more than they had from September to December.
The index for finished goods less foods and energy moved up 0.5 percent in the first quarter of 2013 following a 0.2-percent gain from September to December. Leading this acceleration, prices for pharmaceutical preparations increased 3.1 percent from December to March, after advancing 0.9 percent in the 3 months ended in December. Similarly, the index for plastic products also rose at a faster rate, compared with the previous 3-month period. Prices for civilian aircraft, carpets and rugs, and radio and television communication equipment turned up in the first quarter of 2013. In contrast, the index for tobacco products edged up 0.1 percent in the first quarter of 2013, subsequent to a 2.0-percent increase for the 3 months ended in December. Prices for light motor trucks turned down from December to March, following advances in the fourth quarter of 2012.
The index for finished consumer foods rose 1.0 percent from December to March, following a 0.9-percent increase in the final 3 months of 2012. In the first quarter of 2013, higher prices for fresh and dry vegetables, soft drinks, raspberries, eggs for fresh use, and unprocessed and packaged fish more than offset falling prices for meats.
The PPI for intermediate materials, supplies, and components rose 0.3 percent in the 3 months ended March 2013, subsequent to a 0.8-percent decrease from September to December 2012. (See chart 5.) Leading this upturn, prices for intermediate materials less foods and energy increased more than they had in the previous quarter. The index for intermediate energy goods decreased less from December to March than it had in the 3 months ending in December. Conversely, prices for intermediate foods and feeds fell more in the 3-month period ended in March than it had from September to December.
The index for intermediate materials less foods and energy advanced 1.2 percent in the first quarter of 2013, following a 0.3-percent rise in the previous 3-month period. Prices for basic organic chemicals led this acceleration, jumping 5.8 percent, after moving up 0.8 percent a quarter earlier. The indexes for thermoplastic resins and materials and for plastic products also advanced more in the first quarter than they had for the 3 months ended in December. In contrast, prices for nonferrous metals turned down 1.6 percent for the 3-month period ended in March, compared with a 1.1-percent increase in the fourth quarter of 2012. The indexes for fabricated structural metal products and for paper boxes and containers also turned down after rising in the preceding quarter.
Prices for intermediate energy goods declined 1.7 percent from December to March, subsequent to a 4.2-percent drop in the previous 3-month period. The decrease in the index for gasoline slowed to 2.2 percent, from 11.2 percent in the prior quarter. Prices for lubricating oil base stocks and jet fuel turned up in the 3 months ending in March. Conversely, the index for industrial electric power moved down 6.3 percent, compared with a 0.7-percent rise in the previous quarter. Prices for diesel fuel decreased more in the first quarter, while the index for utility natural gas increased less than it had in the preceding 3-month period.
In the first quarter of 2013, prices for intermediate foods and feeds fell 1.2 percent, after moving down 0.4 percent in the 3 months ended December 2012. The index for meats dropped 2.3 percent, following a 2.6-percent advance in the previous 3-month period. Prices for dairy products, formula feeds, and wheat flour also turned down, after rising in the fourth quarter 2012. In contrast, the index for meat and bone meal increased 22.2 percent from December to March, subsequent to a 25.0-percent decrease in the previous quarter. Prices for soybean cake and meal declined less in the first quarter, while the confectionery materials index rose more than in the 3 months ended in December.
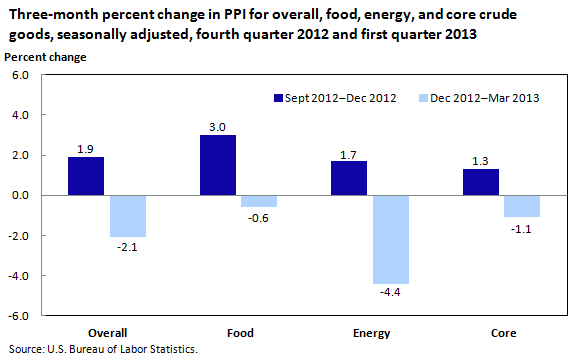
The PPI for crude materials for further processing fell 2.1 percent for the 3 months ended in March, after rising 1.9 percent during the preceding quarter. (See chart 6.) Accounting for almost 60 percent of this broad-based downturn, prices for crude energy materials fell 4.4 percent in the first quarter after climbing 1.7 percent in the fourth quarter of 2012. The index for crude foodstuffs and feedstuffs decreased 0.6 percent from December to March, following a 3.0-percent increase in the previous 3 months; and prices for crude nonfood materials less energy turned down 1.1 percent after rising 1.3 percent from September to December.
Most of the reversal in prices for crude energy materials can be traced to the index for natural gas, which decreased 9.6 percent, following a 35.2-percent jump in the previous quarter. The coal index also turned down, declining 6.0 percent, after rising 3.3 percent in the fourth quarter of 2012. In contrast, price declines for crude petroleum slowed to 1.3 percent in the first quarter of 2013 from 9.2 percent in the previous 3-month period.
Leading the downturn in prices for crude foodstuffs and feedstuffs, the index for slaughter hogs turned down 13.6 percent, following a 30.0-percent jump in the fourth quarter. Prices for grains also declined, after rising in the previous quarter. The index for slaughter chickens advanced less than it had in the 3 months ended in December. In contrast, the index for fresh and dry vegetables jumped 38.5 percent in the 3-month period ending in March, following a 5.8-percent decline in the prior quarter. Prices for slaughter steers and heifers and for unprocessed finfish also turned up, after falling in the fourth quarter of 2012.
Accounting for more than 90 percent of the downturn in prices for crude nonfood materials less energy, the index for nonferrous scrap fell 7.4 percent, subsequent to advancing 6.4 percent in the previous quarter. Prices for grains and iron ores also declined, after rising for the 3 months ended in December. The index for wastepaper was unchanged, after increasing in the fourth quarter. In contrast, the rise in the index for carbon steel scrap accelerated to 3.4 percent in the first quarter, from 0.1 percent in the previous quarter. Prices for copper ores turned up, after decreasing in the previous 3 months.
The PPI for the net output of total trade industries moved down 0.3 percent in the first quarter of 2013, after rising 2.1 percent for the 3 months ended December 2012. (Trade indexes measure changes in margins received by wholesalers and retailers.) More than half of the first-quarter downturn can be traced to margins received by the industry for merchant wholesalers of durable goods, which fell 2.7 percent in the first quarter, following a 2.4-percent advance in the fourth quarter of 2012. The margin indexes for gasoline stations, discount department stores, and clothing stores also decreased, after increasing in the previous quarter. In contrast, the margin index for electronic shopping and mail-order houses climbed 7.7 percent from December to March, after declining 6.0 percent in the preceding quarter. Margins received by warehouse clubs and super centers also turned up in the first quarter of 2013.
The PPI for the net output of transportation and warehousing industries increased 1.7 percent in the first quarter of 2013, compared with a 0.6-percent rise in the fourth quarter of 2012. Leading this faster rate of advance, prices received by the industry for couriers and express delivery services jumped 5.0 percent from December to March, after moving up at a 1.5-percent rate in the preceding quarter. The index for scheduled passenger air transportation also rose at a faster rate, compared with the fourth quarter. Prices received by the U.S. Postal Service climbed 3.6 percent, following no change in the previous quarter. The indexes for the long-distance general freight trucking industry group and local specialized freight trucking of new goods turned up in the first quarter. In contrast, prices received by the industry for local general freight trucking inched up 0.1 percent from December to March, following a 2.5-percent rise in the fourth quarter.
The Producer Price Index for services less trade, transportation, and warehousing advanced 0.5 percent in the first quarter of 2013, after edging down 0.1 percent in the fourth quarter of 2012. About one-third of this upturn can be traced to prices received by the industry group for accommodation services, which increased 4.1 percent from December to March, after dropping 5.1 percent in the fourth quarter. A slower rate of decline in the commercial banking index also was a major contributor to this reversal. Prices received by offices of lawyers rose after no change in the previous quarter, while the indexes for management consulting services and for direct property and casualty insurers turned up in the first quarter. In contrast, prices received by the portfolio management industry advanced 1.9 percent from December to March, following a 6.9-percent jump in the preceding quarter.
The Price Trends section of this Beyond the Numbers article was prepared by Lana Borgie, Brian Hergt, Joseph Kowal, and Tony Lombardozzi. Email: ppi-info@bls.gov. Telephone: (202) 691-7705.
Information in this article will be made available to sensory-impaired individuals upon request. Voice phone: (202) 691-5200. Federal Relay Service: 1 (800) 877-8339. This article is in the public domain and may be reproduced without permission.
PPI Energy and Chemicals Team, “The effects of shale gas production on natural gas prices,” Beyond the Numbers: Prices & Spending, vol. 2, no. 13 (U.S. Bureau of Labor Statistics, May 2013), https://www.bls.gov/opub/btn/volume-2/the-effects-of-shale-gas-production-on-natural-gas-prices.htm
1 U.S. Natural Gas Gross Withdrawals, U.S. Energy Information Administration (U.S. Department of Energy, March 29, 2013), www.eia.gov/dnav/ng/hist/n9010us2m.htm.
2 U.S. Natural Gas Rotary Rigs, U.S. Energy Information Administration (U.S. Department of Energy, March 29, 2013), www.eia.gov/dnav/ng/hist/e_ertrrg_xr0_nus_cm.htm.
3 Natural Gas Explained – Factors Affecting Natural Gas Prices, U.S. Energy Information Administration (U.S. Department of Energy, June 29, 2012), www.eia.gov/energyexplained/index.cfm?page=natural_gas_factors_affecting_prices.
4 Ibid.
5 Natural Gas Futures Contract 1, U.S. Energy Information Administration (U.S. Department of Energy, March 29, 2013), www.eia.gov/dnav/ng/hist/rngc1d.htm.
6 Natural Gas Consumption by End Use, U.S. Energy Information Administration (U.S. Department of Energy, 2013), www.eia.gov/dnav/ng/ng_cons_sum_dcu_nus_a.htm.
7 Today in Energy: Monthly coal- and natural gas-fired generation equal for first time in April 2012 (U.S. Department of Energy, U.S. Energy Information Administration, July 6, 2012), www.eia.gov/todayinenergy/archive.cfm?my=Jul2012. For the period from January 2007 to December 2010, electric power generation from coal averaged about 46.5 percent of total generation; natural gas averaged 22.8 percent and nuclear sources 19.7 percent. The remainder of electric power generation came from renewable, petroleum, and other sources.
8 Natural Gas Gross Withdrawals and Production, U.S. Energy Information Administration (U.S. Department of Energy, March 29, 2013), www.eia.gov/dnav/ng/ng_prod_sum_dcu_NUS_a.htm.
9 AEO2013 Early Release Overview, U.S. Energy Information Administration (U.S. Department of Energy, 2013), www.eia.gov/forecasts/aeo/er/pdf/0383er(2013).pdf.
10 Energy in Brief: What is shale gas and why is it important? U.S. Energy Information Administration (U.S. Department of Energy, December 5, 2012), www.eia.gov/energy_in_brief/article/about_shale_gas.cfm.
11 Price movements for PPIs described in this article include preliminary data for December 2012 through March 2013. All PPI data are recalculated 4 months after original publication, to reflect late data received from survey respondents. In addition, seasonally adjusted PPIs are recalculated on an annual basis for 5 years, to reflect more recent seasonal patterns.
12 Within the PPI stage-of-processing structure, the indexes for goods other than foods and energy commonly are referred to as the core indexes.
13 This Week in Petroleum, Energy Information Administration (U.S. Department of Energy), updated each Wednesday after 1:00 p.m., www.eia.gov/oog/info/twip/twip_crude.html. For detailed data pertaining to futures prices for Cushing, OK, go to www.eia.gov/dnav/pet/pet_pri_fut_s1_d.htm. For detailed data pertaining to crude oil stocks go to www.eia.gov/dnav/pet/pet_stoc_wstk_a_EPC0_SAX_mbbl_w.htm. For detailed data pertaining to crude oil production go to www.eia.gov/dnav/pet/pet_sum_sndw_a_epc0_fpf_mbblpd_w.htm.
14 Ibid.
15 Natural Gas Weekly Update, Energy Information Administration, (U.S. Department of Energy), updated every Thursday by 2:30 p.m., www.eia.gov/naturalgas/weekly/archive/2013/03_21/index.cfm. For the most current report, visit www.eia.gov/naturalgas/weekly/, and for archived copies, go to www.eia.gov/naturalgas/weekly/archive/.
16 Livestock, Dairy, and Poultry Outlook, LDP-M-225, March 14, 2013, U.S. Department of Agriculture, Economic Research Service, p. 1, p. 15, www.ers.usda.gov/media/1058622/ldpm225.pdf.
17 See Feed Outlook, April 2013, FDS-13d, April 12, 2013, U. S. Department of Agriculture, Economic Research Service, pp. 1–4, http://www.ers.usda.gov/media/1076389/fds13d.pdf. Also, Wheat Outlook, WHS-13d, April 12, 2013, U.S. Department of Agriculture, Economic Research Service, pp. 1–4, www.ers.usda.gov/media/1075836/whs-13d.pdf.
Publish Date: Tuesday, May 14, 2013