An official website of the United States government
An official website of the United States government
The .gov means it's official.
Federal government websites often end in .gov or .mil. Before sharing sensitive information,
make sure you're on a federal government site.
The site is secure.
The
https:// ensures that you are connecting to the official website and that any
information you provide is encrypted and transmitted securely.

More BLS articles and information related to retirement and medical benefits are available online at the following links:
Employee compensation packages commonly include both wages and benefits. For decades, employee benefits have been used as part of the total compensation package to attract and retain highly qualified workers. Just as workers in various occupations receive different levels of pay, they also receive access to different types and combinations of employee benefits.1 This article uses March 2012 National Compensation Survey (NCS) data to examine private industry workers’ access to medical benefits, retirement benefits, and combinations of the two benefits, by major occupation group, wage category, part-time and full-time status, union and nonunion status, and establishment size.2 The study finds notable differences in the patterns of access to medical and retirement benefits—separately, and in combination—among the various worker groups.
Throughout this analysis, each worker characteristic (wage category, establishment size, etc.) is treated independently. Of course, the workers who make up these data points do not fall neatly into one category; in reality, there is considerable overlap, which adds complexity to the overall picture. Since 1980, the NCS and its predecessor the Employee Benefit Survey (EBS) have published data on the incidence of specific types of employee benefits and many provisions of employer-provided retirement and health plans. In 2009, the NCS published for the first time estimates on the incidence of combinations of benefits among various groups of workers.3 Although the provisions, and value, of the plans themselves can vary widely among these categories of workers, the combined benefits incidence data provide greater insight into the benefits package that workers actually receive than the incidence of specific benefits alone. Major benefits such as medical insurance and retirement plans are not always offered together or to the same workers.
Table 1 shows the percent of workers in the private sector with access to medical benefits, retirement benefits, and combinations of both benefits; access indicates that the benefit was made available by the employer, whether or not the employee actually chose to participate in their employer’s benefits plan. As the data show, medical benefits are generally offered at a slightly higher rate than retirement benefits. At the all-worker level, for example, 70 percent have access to medical benefits and 65 percent have access to retirement benefits. A somewhat smaller percentage of workers have access to both benefits (58 percent), while only 12 percent have access to medical benefits without retirement benefits and 7 percent have access to retirement benefits without medical benefits. The relatively small number of workers who have access to only one of the two benefits (19 percent) suggests that if employers offer these benefits at all, they are most likely to offer some combination of both.
| Worker characteristic | Medical benefits | Retirement benefits | Medical and retirement benefits | Medical and no retirement benefits | Retirement and no medical benefits | No medical and no retirement benefits |
|---|---|---|---|---|---|---|
|
All workers |
70 | 65 | 58 | 12 | 7 | 23 |
|
Occupation: |
||||||
|
Management, professional, and related |
87 | 79 | 76 | 12 | 4 | 9 |
|
Service |
41 | 40 | 30 | 11 | 10 | 49 |
|
Sales and office |
72 | 69 | 60 | 12 | 9 | 19 |
|
Natural resources, construction, and maintenance |
77 | 65 | 62 | 14 | 3 | 20 |
|
Production, transportation, and material moving |
75 | 66 | 61 | 14 | 5 | 20 |
|
Average wage (in quartiles): |
||||||
|
Lowest 25 percent |
34 | 38 | 24 | 10 | 14 | 51 |
|
Second 25 percent |
74 | 65 | 60 | 14 | 6 | 20 |
|
Third 25 percent |
86 | 75 | 72 | 14 | 3 | 11 |
|
Highest 25 percent |
92 | 85 | 82 | 10 | 2 | 5 |
|
Full- or part-time status: |
||||||
|
Full time |
86 | 74 | 71 | 15 | 3 | 12 |
|
Part time |
24 | 38 | 20 | 4 | 19 | 57 |
|
Bargaining status: |
||||||
|
Union |
94 | 92 | 91 | 4 | 2 | 4 |
|
Nonunion |
67 | 62 | 55 | 13 | 7 | 25 |
|
Establishment size: |
||||||
|
1 to 49 workers |
54 | 46 | 38 | 16 | 8 | 38 |
|
50 to 99 workers |
69 | 63 | 54 | 15 | 9 | 22 |
|
100 to 499 workers |
82 | 79 | 72 | 10 | 6 | 12 |
|
500 or more workers |
89 | 86 | 84 | 5 | 3 | 8 |
| Source: U.S. Bureau of Labor Statistics, National Compensation Survey. |
||||||
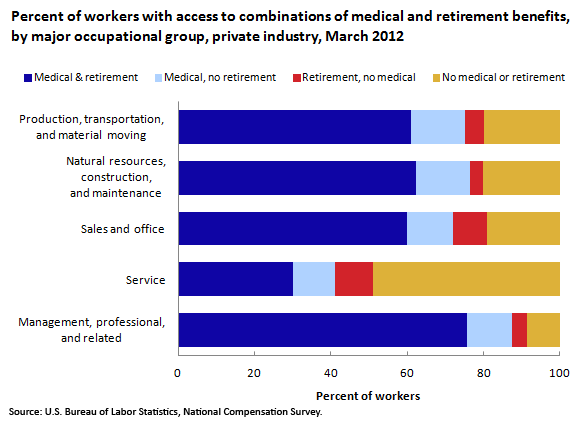
Similar patterns can be seen across the major occupational groups, with medical benefits offered at a slightly higher rate than retirement benefits in all groups except service occupations. Among natural resources, construction, and maintenance workers, for example, 77 percent had access to medical benefits and 65 percent had access to retirement benefits in March 2012. Similar percentages of workers in production, transportation and material moving occupations had access to the two benefits. Management, professional, and related occupations had the highest rates of access to both benefits, with 87 percent having access to medical benefits and 79 percent having access to retirement benefits. By contrast, service occupations had the lowest rates of access: 41 percent for medical and 40 percent for retirement. Some research suggests that in order to entice quality employees in the management, professional and related occupations, employers must offer medical and retirement benefits at higher rates than in other occupations.4
The next question is, what percentage of workers are offered both medical and retirement benefits? Chart 1 shows the percent of private industry workers with access to selected combinations of medical and retirement benefits among the five major occupational groups. Not surprisingly, more than three-quarters (76 percent) of workers in management, professional and related occupations have access to both retirement and medical benefits, and only 9 percent have access to neither benefit. In the service occupations, only 30 percent have access to both benefits, whereas nearly half (49 percent) have no access to either benefit. Almost as many service workers have “no medical and no retirement” (49 percent) as the other combinations combined. The relatively high percentage of part-time employees in the service occupations may explain some of this discrepancy, a topic discussed later in the article. At least 60 percent of the workers in the three other occupational groups—sales and office; natural resources, construction, and maintenance; and production, transportation, and material moving—have access to both medical and retirement benefits. Although the overall patterns in these data have held fairly constant in recent years, one notable change did occur: in March 2009, 43 percent of service workers did not have access to either medical or retirement benefits; by March 2012, that figure had risen to 49 percent.
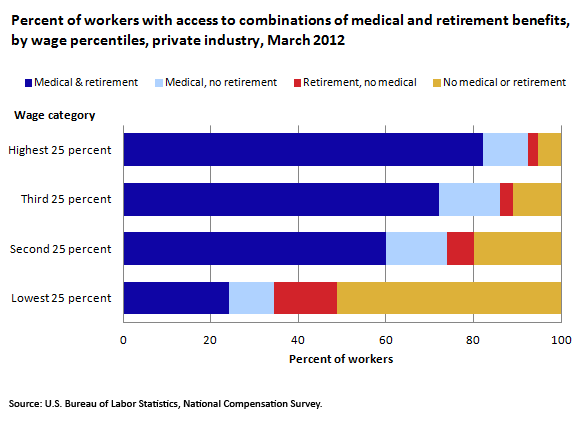
A positive correlation clearly exists between workers’ wages and their level of access to various employer-provided benefits. As can be seen in table 1, workers in the lowest wage quartile (25 percent) have much lower rates of access to medical or retirement benefits than those in the three higher wage quartiles, with a substantial difference between the lowest and the second 25 percent.5 Chart 2 shows the percent of workers with access to combinations of medical and retirement benefits by wage quartile. Workers in the lowest 25 percent have the lowest access to combinations of both benefits, and they are more likely to be offered neither benefit than any other combination. By contrast, in the highest 25 percent, 82 percent of workers have access to a combination of both medical and retirement benefits, and only 5 percent in this range reported “no medical and no retirement.”
The NCS data on benefit access by wage category reflect the same pattern: greater access to medical and retirement benefits with higher earnings. Not only were employer costs per employee hour worked for wages and salaries in management, professional, and related occupations higher than those of workers in any of the other major occupational groups, they also had the highest rates of access to both medical and retirement benefits. Service workers had the lowest access rates and the lowest employer costs per hour worked for wages and salaries of any major occupational group.6
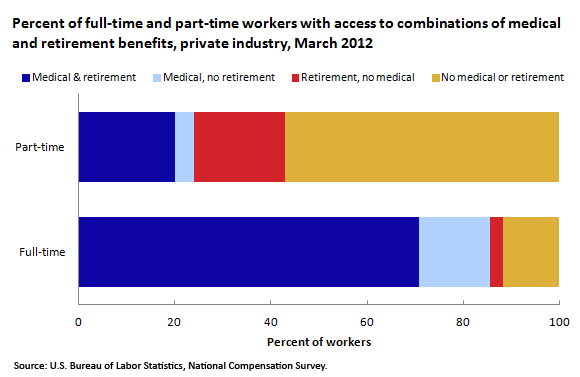
Another view of the differences in access to benefits can be seen by looking at full-time and part-time workers. Full-time workers have higher access to both medical and retirement benefits than do part-time workers. This is consistent with the differences in benefit access between workers in the management, professional, and related occupations and workers in the service occupations: the former group has a larger proportion of full-time workers, while the latter has a larger proportion of part-time workers. It is also consistent with the differences in wage categories among part-time and full-time workers: in general, full-time workers earn more per hour than part-time workers.7
As the data in table 1 show, more than three times as many full-time workers have access to medical benefits as their part-time counterparts: 86 percent of full-time workers have access to medical benefits, compared with 24 percent of part-time workers. Similarly, full-time workers are nearly twice as likely as part-time workers to have access to retirement benefits: 74 percent for full-time workers and 38 percent for part-time workers. In terms of combinations of both benefits, the majority of full- time workers have access to medical and retirement benefits while the majority of part-time workers have access to neither benefit. (See chart 3.)
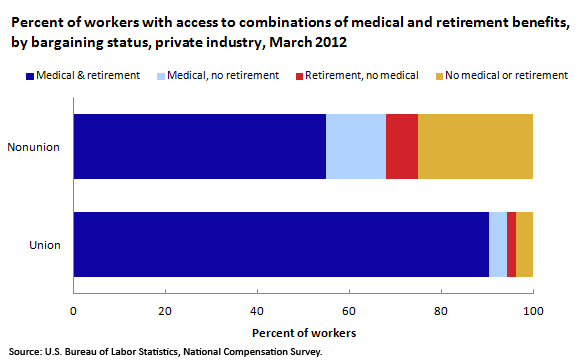
A worker’s bargaining status plays a role in access to benefits as well. Union workers generally have higher rates of access to benefits than their nonunion counterparts. Not only are employer costs for wages and salaries roughly $3 more per employee hour worked, on average, in the private sector ($23.17 per hour worked compared with $19.96 per hour worked), they also are more likely to have access to medical and retirement benefits, both separately and in combination.8
Chart 4 shows the percent of workers with various benefit combinations by bargaining status. Union workers are more likely than nonunion workers to have access to both benefits. Twenty five percent of nonunion workers have no medical and no retirement, compared with only 4 percent of union workers. A study by the Employee Benefit Research Institute showed that the premiums paid for benefits “are higher in plans with union workers compared with plans that have no union workers,” and union workers “paid a smaller share of the premium through payroll deduction for family coverage in plans with at least some union workers (20 percent) as compared with plans with no union workers (31 percent).”9 Although union workers make up a relatively small proportion of workers in the private sector—about 7.2 percent in 2011, according to data from the Current Population Survey—through collective bargaining they generally are able to negotiate higher wages and benefits for the workers they represent.10
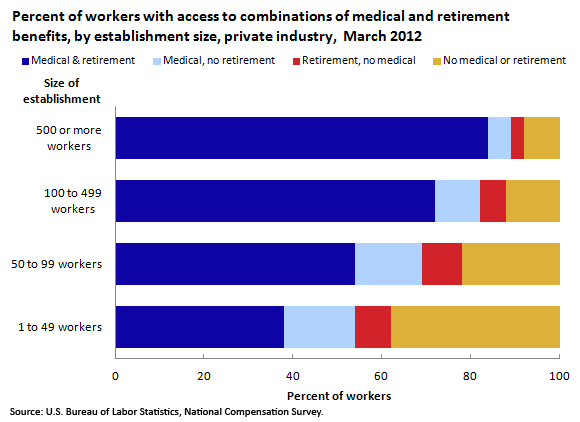
As the data in table 1 show, the larger the establishment, the more likely that establishment is to offer their employees medical and retirement benefits. Nearly 90 percent of workers in establishments with 500 or more employees have access to medical benefits, and 86 percent have access to retirement benefits. By contrast, in establishments with fewer than 50 employees, a little more than half (54 percent) of the workers have access to medical benefits, and 46 percent have access to retirement benefits.
Chart 5 shows the percent of workers with access to various benefit combinations by establishment size. There appears to be a positive correlation between establishment size and the likelihood of having the combination of medical and retirement benefits. As a combination package, in establishments with fewer than 50 employees, only 38 percent of workers have access to medical and retirement benefits, the same proportion as have access to neither benefit. In establishments with 500 or more employees, 84 percent of workers have access to both benefits. In the two middle-size establishment categories—50 to 99 employees and 100 to 499 employees—the comparable figures are 54 percent and 72 percent, respectively.
Some studies suggest that economies of scale are associated with health insurance benefits, meaning that larger companies can offer their employees health benefits at lower costs per worker than smaller companies.11 Although large establishments—those with 500 workers or more—account for over 16 percent of private industry employment in the first quarter of 2011, they are the most likely to offer both retirement and medical benefits.12 These data are consistent with theories of economies of scale regarding employer-provided benefits. According to an article published by the Internal Revenue Service, the Patient Protection and Affordable Care Act of 2010 includes tax credits to encourage small businesses to offer health benefits to their employees, which may result in changes to those data in the future.13
This article has examined the different rates of access to medical and retirement benefits and various combinations of the two benefits within private industry. People employed in management, professional, and related occupations have the highest rates of access to these benefits—both separately and in combination—while those employed in service occupations have the lowest rates of access. Access to medical and retirement benefits also trends positively with wage levels: workers who earn more tend to have greater access to these benefits. In addition, full-time workers are more likely to have access to both benefits than are part-time workers, and union workers have higher rates of access to both benefits than do nonunion workers, despite the relatively small share of the workforce represented by unions. Economies of scale appear to play an important role in the provision of these benefits, allowing larger businesses to offer medical and retirement benefits at substantially higher rates than smaller businesses. Employer-sponsored medical insurance and retirement benefits have become a normal part of the bargaining process for job seekers and employers, and they continue to be an important part of the overall compensation package offered to American workers.
This BEYOND THE NUMBERS article was prepared by Lindsay B. Kimbro, a former summer intern, and Michelle B. Mayfield, an economist, both in the Office of Compensation and Working Conditions. Email: Mayfield.Michelle@bls.gov. For more benefits information, Email: NCSInfo@bls.gov, or please see https://www.bls.gov/ebs. For additional assistance, contact one of our information offices: National—Washington, DC: (202) 691-6199, TDD (800) 877-8339; Atlanta (404) 893-4222; Boston: (617) 565-2327; Chicago: (312) 353-1880; Dallas: (972) 850-4800; Kansas City: (816) 285-7000; New York: (646) 264-3600; Philadelphia: (215) 597-3282; San Francisco: (415) 625-2270.
Information in this article will be made available to sensory-impaired individuals upon request. Voice phone: (202) 691-5200. Federal Relay Service: 1-800-8339.
This article is in the public domain and may be reproduced without permission.
Lindsay B. Kimbro and Michelle B. Mayfield, “Retirement and medical benefits: Who has both?” Beyond the Numbers: Pay & Benefits, vol. 2, no. 10 (U.S. Bureau of Labor Statistics, April 2013), https://www.bls.gov/opub/btn/volume-2/retirement-and-medical-benefits-who-has-both.htm
1 Trade-offs between wages and benefits are described by some economists as “compensating differentials, their size depends on the valuation of the marginal worker.” See Mark V. Pauly, “Making Sense of a Complex System: Empirical Studies of Employment-Based Health Insurance,” International Journal of Health Care Finance and Economics, September–December 2001, pp. 333–339, http://www.springerlink.com/content/l04pru35003721p0/.
2 National Compensation Survey: Employee Benefits in the United States, March 2012, Bulletin 2773 (U.S. Bureau of Labor Statistics, September 2012), https://www.bls.gov/ncs/ebs/#bulletin_coverage; for the full PDF version, see https://www.bls.gov/ncs/ebs/benefits/2012/ebbl0050.pdf.
3 See table 39, “Benefit combinations: Access, private industry workers, National Compensation Survey, March 2009,” https://www.bls.gov/ncs/ebs/benefits/2009/ownership/private/table40a.htm.
4 See Pauly, "Making Sense of a Complex System: Empirical Studies of Employment-Based Health Insurance," http://www.springerlink.com/content/l04pru35003721p0/.
5 For the National Compensation Survey, the published 25th ($10.69), 50th ($15.87), and 75th ($24.81) percentiles designate position in the earnings distribution within each published occupation. At the 50th percentile—the median—half of the hours are paid the same as or more than the rate shown and half are paid the same as or less than the rate shown. At the 25th percentile, one-fourth of the hours are paid the same as or less than the rate shown. At the 75th percentile, one-fourth of the hours are paid the same as or more than the rate shown.
6 See Employer Costs for Employee Compensation— March 2012 (HTML) (PDF), news release USDL-12-1124.
7 David M. Pongrace and Alan P. Zilberman, “A Comparison of Hourly Wage Rates for Full- and Part-Time Workers by Occupation, 2007,” Compensation and Working Conditions Online, July 23, 2009, https://www.bls.gov/opub/mlr/cwc/a-comparison-of-hourly-wage-rates-for-fulland-part-time-workers-by-occupation-2007.pdf.
8 See Employer Costs for Employee Compensation— March 2012 (HTML) (PDF), news release USDL-12-1124.
9 John MacDonald, Fast Facts, Employee Benefits Research Institute, January 20, 2010, http://www.ebri.org/pdf/FFE151.20Jan10.Final.pdf.
10 Current Population Survey, Household Data Annual Averages, table 42, “Union affiliation of employed wage and salary workers by occupation and industry, 2011,” https://www.bls.gov/cps/cpsaat42.pdf.
11 See Jayachandran N. Variyam and David S. Kraybill, “Fringe Benefits Provision by Rural Small Businesses,” American Journal of Agricultural Economics, May 1998, pp. 360–368.
12 Data on number of establishments and employment by establishment size are from the BLS Quarterly Census of Employment and Wages, available at https://www.bls.gov/cew/. See table 3, https://www.bls.gov/cew/publications/employment-and-wages-annual-averages/2011/home.htm.
13 Internal Revenue Service, “Recent Legislation Offers Tax Incentives for Small Businesses to Provide Health Care, Hire New Workers,” May 2010, http://www.irs.gov/. For details of the Patient Protection and Affordable Care Act, see Public Law 111– 148, March 23, 2010, http://www.gpo.gov/fdsys/pkg/PLAW-111publ148/content-detail.html.
Publish Date: Tuesday, April 16, 2013