An official website of the United States government
An official website of the United States government
The .gov means it's official.
Federal government websites often end in .gov or .mil. Before sharing sensitive information,
make sure you're on a federal government site.
The site is secure.
The
https:// ensures that you are connecting to the official website and that any
information you provide is encrypted and transmitted securely.
More BLS articles and information on import and export oil prices can be found at the following links:
In May 2013, domestic production of petroleum in the United States surpassed imports for the first time since January 1997. The fact that domestic production has outpaced imports is not some random occurrence, but rather the culmination of trends that have been in motion for a number of years. Imports of petroleum have been declining over the last 7 years, while domestic production has undergone a significant revival. According to a forecast by the International Energy Agency, “The United States will overtake Saudi Arabia to become the world's biggest petroleum producer before 2020, and will be energy independent 10 years later.”1
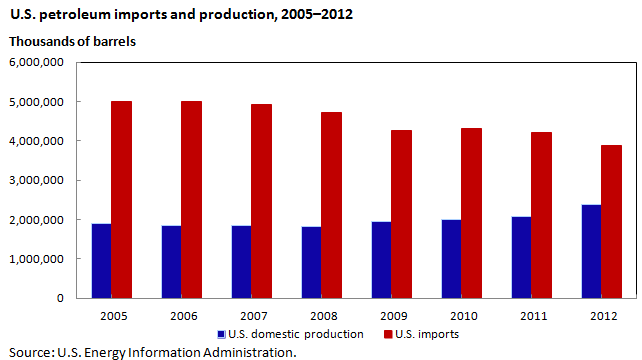
In 2005, the amount of foreign crude petroleum and petroleum products imported into the United States peaked at slightly more than 5 billion barrels. Beginning in 2006, the volume of U.S. imports began to decline, and it continued to fall in 6 of the next 7 years. By 2012, imports had declined 22.5 percent, to a little more than 3.8 billion barrels.
As seen in chart 1, 2009 was notable for domestic petroleum production. For the first time in 17 years, U.S. production increased, rising 6.8 percent over the previous year’s production, to 1.95 billion barrels. Production continued to expand over the next 3 years and, by 2012, had risen a further 21.7 percent, to 2.38 billion barrels.2 The increase was particularly evident in 2012, as U.S. production of crude petroleum grew 15.3 percent, well above the global average of 2.2 percent, and averaged 8.9 million barrels of crude petroleum per day.3 While production in Alaska declined, in the continental United States production grew from a little over 4.7 million barrels per day in 2009 to just under 6 million barrels per day in 2012.4
From 2009 to 2012, much of the increase in domestic production came from the rise in crude petroleum production in Texas (87.2 percent), North Dakota (437.4 percent), Oklahoma (39.6 percent), and New Mexico (40.7 percent).5 The large increases each of those states experienced, some starting as early as 2003, were in stark contrast to the historical trend of declining production that had prevailed nationally since the 1980s. U.S. production grew as a result of new production technologies, such as horizontal drilling and hydraulic fracturing, which were utilized in extracting petroleum and gas from shale deposits once viewed as unprofitable.6
With the overall increase in domestic production came an expansion in the amount of drilling activity. The number of rotary rigs (the machinery used to drill petroleum wells) in operation rose considerably from 2002 to 2011. In 2002, there were 137 rotary rigs in operation in the United States. By 2011, the number had grown 618.2 percent, to 984.7 There was also an increase in the number of petroleum wells in the nation: from 1997 to 2002, the number of active petroleum wells had declined 9.1 percent, but from 2002 to 2009, the number grew from 354,640 to 363,459, an increase of 2.5 percent. 8
Coinciding with the large increase in domestic petroleum production in the United States was a decline in the domestic consumption of petroleum. Domestic petroleum consumption fell from 18.9 million barrels a day in 2011 to 18.6 million barrels per day in 2012, a decrease of 1.6 percent.9 The amount of petroleum consumed in 2012 was the smallest since 1996.
The decline in demand manifested itself in the major economic sectors. The most important sector of the U.S. economy in terms of petroleum usage is the transportation sector. At the height of consumption in 2007, 14.3 million barrels of petroleum were consumed per day, with 9.1 million barrels per day going toward the production of gasoline. By 2012, gasoline consumption had decreased 6.6 percent, to 8.5 million barrels per day. Overall consumption in the transportation sector, which accounted for 70.5 percent of total U.S. petroleum consumption, declined 9.1 percent, to 13 million barrels per day, the lowest annual figure since 2001.10 Part of the decrease in consumption was brought about by a decline in vehicle distance traveled by American drivers. By 2012, the number of miles driven by Americans was 2.5 percent less than in 2008.11 At the same time, the vehicles being driven became more fuel efficient. The U.S. Environmental Protection Agency reported that the estimated composite average fuel economy of 2012 model-year cars and trucks was 23.8 mpg, the highest mileage since the EPA began publishing the figure in 1975.12
Decreasing consumption in the industrial, residential, and commercial sectors also contributed to the overall decline in domestic consumption of petroleum. The U.S. recession, which began in 2008, was an important contributor to the decline in both the industrial and the residential sector’s consumption of petroleum. Domestic industrial petroleum consumption fell 10.9 percent from 2008 to 2012, while residential consumption dropped 15.0 percent. Commercial consumption decreased 2.5 percent. One of the contributors to the decline in residential petroleum consumption is the construction of housing that is more energy efficient than previously; the amount of energy used to heat new houses has decreased.13
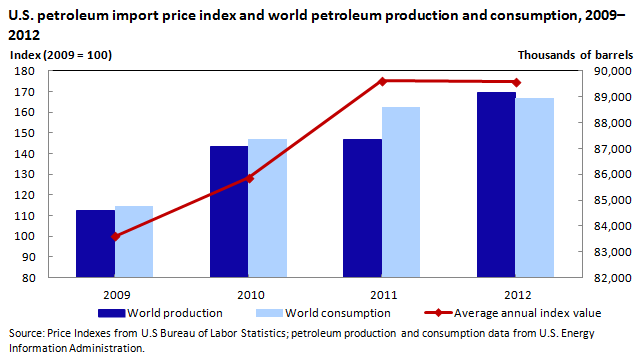
While the volume of petroleum imports to the United States started to decline as early as 2006 and domestic production began increasing in 2009, the price index for imported petroleum continued to rise until 2012. (See chart 2.) Several factors helped keep import prices rising until 2012. Strong global demand, especially from Asia; lower production from several nations that are members of the Organization of the Petroleum Exporting Countries (OPEC);14 and global supply shocks all contributed to increasing prices. By 2012, the growth in production worldwide, coupled with steadying global demand, started to drive prices down.
In 2010, import prices for petroleum rose 28.4 percent over the 2009 figure, on the strength of robust global demand; demand from Asia was particularly strong. Consumption in Asia grew 6.0 percent in 2010, while global consumption increased 3.1 percent.15 Much of the increase in consumption came from China, which experienced record demand during the year.
The rise in import petroleum prices (36.4 percent) was even more pronounced in 2011. Both supply concerns resulting from political unrest in North Africa and strong worldwide demand contributed to the higher prices. The political unrest began with protests against the Egyptian government. Although Egypt is a relatively small producer of petroleum, fears that the turmoil might lead to disruptions in the traffic of petroleum passing through the Suez Canal helped drive prices higher. The political unrest continued with a civil war that broke out in neighboring Libya in February, producing uncertainty that contributed to a worldwide rise in petroleum prices. As a result, Libyan petroleum exports fell from more than 1.5 million barrels a day before the crisis to 200,000 barrels a day by April.16 Strong demand from Asian countries continued into 2011 as Asian consumption increased 3.6 percent and Chinese consumption grew 5.2 percent.17
After 2 consecutive years of sizable increases, import prices leveled off in 2012, falling 0.3 percent for the year. Petroleum prices rose during the first quarter of 2012, but then fell 13.2 percent from March to December. Contributing to the price decline were increases in production by Russia, Canada, and the OPEC nations. Of particular note, the United States increased production by more than 15 percent, the largest single-year rise since the 18.9–percent hike in 1940.18 While global production was rising, the growth in world consumption of petroleum slowed in 2012, ticking up 0.4 percent.19
The recent surge in U.S. petroleum production, coupled with reduced growth in energy consumption, has lessened the nation’s reliance on petroleum imports and caused a historical shift in the U.S. energy outlook. Though certainly a positive development for the United States, this shift is expected to have global implications as well. In its most recent Medium-Term Oil Market Report, the International Energy Agency stated that the boom in North American petroleum production will ease what has been a tight market and reshape market fundamentals.20 The North American supply is forecasted to expand by 3.9 million barrels per day over the next 6 years, helping offset potential market disruptions from volatile regions such as the Middle East.
U.S. import prices fell 1.6 percent in the second quarter of 2013, after increasing 1.3 percent over the first quarter. A downturn in fuel prices was one factor in the second-quarter decrease in import prices. Also contributing to the decline were lower nonfuel prices, led by a 1.6-percent drop in import prices from Japan. The decrease in prices of imports from Japan paralleled the rise in the value of the U.S. dollar relative to the yen: the dollar rose 14.5 percent against the yen over the first half of 2013. The decline in the price index for imports from Japan is the largest quarterly drop in the index since 1998.
Fuel imports. Fuel prices fell 4.1 percent over the second quarter of 2013, following a 5.6-percent increase in the index for the first quarter of the year. The second-quarter drop resulted from a 1.9-percent decline in fuel prices in May and a 2.4-percent decrease in April. In contrast, prices for import fuels ticked up 0.1 percent in June. The second-quarter decline in fuel prices was led by a 4.7-percent decrease in petroleum prices, more than offsetting a 15.6-percent increase in natural gas prices.
The second-quarter decrease in petroleum prices followed a 6.2-percent increase during the first quarter and resumed the overall downward trend in the price of this commodity throughout 2012, when petroleum prices fell 8.7 percent. As indicated earlier, strong world supply and weakened demand contributed to the drop in petroleum prices. Another factor was the rising value of the U.S. dollar against most major currencies in recent months. Petroleum is generally priced in U.S. dollars, so a stronger dollar makes petroleum prices more expensive (thus weakening demand) for countries using other currencies to purchase petroleum.
In contrast to petroleum prices, the price index for natural gas rose 15.6 percent between March and June, resulting mostly from a 15.5-percent jump in April. Prices for natural gas increased 93.3 percent over the past year. The low price level in 2012 led to some cutback in production because profit levels became unsustainable as a result of the reduced prices.21
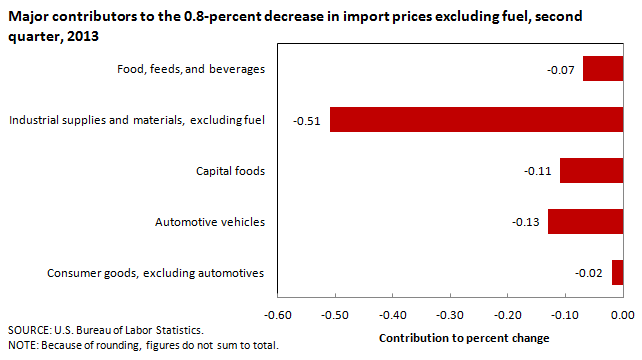
Nonfuel imports. Nonfuel import prices fell 0.8 percent between March and June, after ticking up 0.2 percent over the first quarter of 2013. The decrease was the largest quarterly decline since the index fell 1.8 percent over the first quarter of 2009.
As seen by the contributions shown in chart 3, the second-quarter decline was driven primarily by falling prices for nonfuel industrial supplies and materials, which dropped 3.0 percent. That decrease followed a 0.1-percent advance between December 2012 and March 2013, and was led by a 7.5-percent drop in prices for unfinished metals. Prices for gold and other precious metals have fallen because of smaller demand from investors on lessening fears of inflation.22
Each of the major finished goods areas recorded declines over the second quarter of 2013, in part because of the rising value of the U.S. dollar. Prices for automotive vehicles fell 0.9 percent for the quarter ended in June, the largest quarterly decrease in the index since a 1.0-percent drop in June 1991. Capital goods prices declined 0.3 percent between March and June: the most recent quarter that this index increased was the third quarter of 2012. The price index for consumer goods also decreased in the second quarter, edging down 0.1 percent.
Prices for foods, feeds, and beverages fell for the quarter ended in June, decreasing 1.1 percent, after a 2.7-percent increase over the previous 3 months. A 5.4-percent decline in vegetable prices, a 7.4-percent drop in coffee prices, and a 3.1-percent decrease in fruit prices offset higher prices for fish and shellfish in the second quarter.
Overall export prices decreased 1.3 percent in the second quarter of 2013, following a 0.6-percent increase the previous quarter. Both agricultural prices and nonagricultural prices contributed to the decline. The March-to-June drop in export prices was the largest quarterly decline since a 1.8-percent decrease in the second quarter of 2012.
Agricultural exports. The price index for agricultural exports fell 0.6 percent for the second quarter of 2013, entirely attributable to a 2.3-percent drop in April. Following the April decline, prices for U.S agricultural exports rose 1.7 percent over the remainder of the quarter. A 4.1-percent drop in corn prices for the 3 months ended in June was the largest contributor to the falling agricultural prices and was driven by an 8.1-percent decrease in April corn prices. Prices for export corn fell 5.5 percent during the first quarter of 2013. The drop was due to higher than originally estimated stockpiles and to forecasts that the acreage planted this year might be the largest since 1936.23 However, corn prices reversed direction in May and June, rising 4.5 percent over those months as rainy weather in much of the corn-growing region of the United States led to late planting. As of April 28, only about 5 percent of the U.S. corn crop was in the ground.24
Lower prices for nuts and cotton in the second quarter of 2013 also factored into the overall decline in agricultural export prices.
Nonagricultural exports. Nonagricultural export prices declined 1.4 percent between March and June, after rising 0.8 percent over the first quarter of the year. As seen in chart 4, most of the decrease resulted from prices for nonagricultural industrial supplies and materials, which fell 3.2 percent for the quarter. A 5.2-percent decline in fuel prices and a 9.5-percent decrease in prices for nonferrous metals were the two largest contributors to the overall drop in prices for nonagricultural industrial supplies and materials.
Each of the major finished goods areas recorded comparatively modest price declines for the quarter ended in June: consumer goods prices fell 0.5 percent, prices for capital goods decreased 0.3 percent, and the price index for export automotive vehicles edged down 0.1 percent.
This Beyond the Numbers was prepared by Edwin Bennion and David Mead, economists in the Office of Prices and Living Conditions, Bureau of Labor Statistics, Washington, DC. Email: MXPinfo@bls.gov. Telephone: 202-691-7101.
Upon request, information in this article will be made available to individuals with sensory impairments. Voice phone: (202) 691-5200. Federal Relay Service: 1-800-877-8339. This article is in the public domain and may be reproduced without permission.
Edwin Bennion and David Mead, “The reemergence of the United States as a global petroleum producer,” Beyond the Numbers: Global Economy, vol. 2, no. 19 (U.S. Bureau of Labor Statistics, August 2013), https://www.bls.gov/opub/btn/volume-2/reemergence-of-the-united-states-as-a-global-petroleum-producer.htm
1 Mark Thompson, “U.S. to Become Biggest Oil Producer–IEA,” CNN Money, November 12, 2012, http://money.cnn.com/2012/11/12/news/economy/us-oil-production-energy/index.html.
2 “Crude Oil Production,” Petroleum & Other Liquids (U.S. Energy Information Administration, March 15, 2013), http://www.eia.gov/dnav/pet/pet_crd_crpdn_adc_mbbl_a.htm.
3 “BP Statistical Review of World Energy June 2013” BP, http://www.bp.com/content/dam/bp/pdf/statistical-review/statistical_review_of_world_energy_2013.pdf.
4 “July 2013 Monthly Energy Review” (U.S. Energy Information Administration, July 26, 2013), table 3.1, http://www.eia.gov/totalenergy/data/monthly/pdf/mer.pdf.
5 “Crude Oil Production.”
6 “U.S. Oil Production in Largest Ever Single-Year Increase,” BBC News Business, June 12, 2013, http://www.bbc.co.uk/news/business-22875526.
7 “Crude Oil and Natural Gas Drilling Activity,” Petroleum & Other Liquids (U.S. Energy Information Administration, September 7, 2012), http://www.eia.gov/dnav/pet/pet_crd_drill_s1_a.htm.
8 “Distribution and Production of Oil and Gas Wells by State” (U.S. Energy Information Administration, January 7, 2011), http://www.eia.gov/pub/oil_gas/petrosystem/petrosysog.html;
2009 is the last year for which published data are available.
9 “Total Petroleum Consumption" (U.S. Energy Information Administration, June 27, 2013), http://www.eia.gov/cfapps/ipdbproject/IEDIndex3.cfm?tid=5&pid=5&aid=2.
10 “July 2013 Monthly Energy Review,” table 3.7c.
11 “Traffic Volume Trends,” Travel Monitoring (U.S. Department of Transportation, Federal Highway Administration, May 2013), http://www.fhwa.dot.gov/policyinformation/travel_monitoring/tvt.cfm.
12 “Light-Duty Automotive Technology, Carbon Dioxide Emissions, and Fuel Economy Trends: 1975 Through 2012,” Cars and Light Trucks (United States Environmental Protection Agency, March 21, 2013), http://www.epa.gov/otaq/fetrends.htm#report.
13 “Newer U.S. homes are 30% larger but consume about as much energy as older homes,” Today in Energy (U.S. Energy Information Administration, February 12, 2013), http://www.eia.gov/todayinenergy/detail.cfm?id=9951.
14 OPEC member nations are Algeria, Angola, Ecuador, Iran, Iraq, Kuwait, Libya, Nigeria, Qatar, Saudi Arabia, United Arab Emirates, and Venezuela.
15 “BP Statistical Review of World Energy”; and “International Energy Statistics” (U.S. Energy Information Agency), http://www.eia.gov/cfapps/ipdbproject/IEDIndex3.cfm.
16 “Oil Market Report” (International Energy Agency, May 12, 2011), omrpublic.iea.org/omrarchive/12may11full.pdf.
17 “BP Statistical Review of World Energy.”
18 “Crude Oil Production.”
19 “Total Petroleum Consumption.”
20 “Supply shock from North American oil rippling though global markets” (International Energy Agency, May 14, 2013), http://www.iea.org/newsroomandevents/pressreleases/2013/may/name,38080,en.html.
21 Erich Schwartzel, “U.S. report predicts rising natural gas prices in 2013–14,” Pittsburgh Post-Gazette, January 9, 2013, https://www.post-gazette.com/business/businessnews/2013/01/09/U-S-report-predicts-rising-natural-gas-prices-in-2013-14/stories/201301090327.
22 Jan Harvey, “Gold hits two-and-half year low as Fed flags end to easy money”, Reu33ters, June 20, 2013, http://news.yahoo.com/gold-hits-two-half-low-fed-flags-end-161417771.html.
23 “Corn Heads for Bear Market After U.S. Stockpiles Beat Estimates,” Agweb, April 1, 2013, https://www.agweb.com/article/corn_heads_for_bear_market_after_us_stockpiles_beat_estimates.
24 “April Showers (and Snow) Bring Market Chaos,” Agweb, May 1, 2013, https://www.agweb.com/article/april_showers_and_snow_bring_market_chaos/.
Publish Date: Monday, August 12, 2013