An official website of the United States government
An official website of the United States government
The .gov means it's official.
Federal government websites often end in .gov or .mil. Before sharing sensitive information,
make sure you're on a federal government site.
The site is secure.
The
https:// ensures that you are connecting to the official website and that any
information you provide is encrypted and transmitted securely.

Additional articles or information on green jobs are available online at the following links:
Green technologies and practices: a visual essay
The Green Goods and Services Occupational survey: initial results
Fifty-seven percent of businesses in the United States used green technologies or practices to improve energy efficiency within their establishments in August 2011, and over half used green technologies and practices to reduce or eliminate the creation of waste materials as a result of operations. These are some of the results from the first BLS Green Technologies and Practices (GTP) survey, published in June 2012. However, the previously published GTP data offer only a partial look at the extent to which businesses used green technologies and practices. For example, the data do not reveal whether establishments typically used a single green technology or practice, or were more likely to adopt combinations of GTPs. To address these topics, this issue of Beyond the Numbers uses a special tabulation of GTP establishment reports to supplement the published survey data with additional information on businesses’ use of multiple GTPs.
The Green Technologies and Practices survey is based on the BLS process approach to measuring green jobs, which defines “green” in terms of the environmental impact of an establishment’s production processes—rather than by the type of good or service produced.1 GTP survey data were collected from a sample of about 35,000 business establishments in the 50 states and the District of Columbia. Survey respondents were asked whether they had used the following six types of green technologies and practices during the survey reference period, the pay period that included August 12, 2011:
Generation of electricity, heat, or fuel from renewable sources, such as wind or solar, primarily for use within the establishment
Use of technologies or practices to improve energy efficiency within the establishment, such as occupying a LEED (Leadership in Energy and Environmental Design) certified building or using energy efficient lighting or programmable thermostats
Use of technologies or practices in operations to reduce greenhouse gas emissions through methods other than renewable energy generation and energy efficiency, including promotion and/or subsidy of alternative forms of transportation for employees, such as carpools or mass transit, or implementation of a telework program
Use of technologies or practices either to reduce the creation or release of pollutants or toxic compounds as a result of operations, or to remove pollutants or hazardous waste from the environment. Examples of pollutants or toxic compounds include carbon monoxide, chlorofluorocarbons (CFCs), and heavy metals.
Use of technologies or practices to reduce or eliminate the creation of waste materials as a result of operations, such as managing wastewater and collecting and reusing or recycling waste
Use of technologies or practices in operations to conserve natural resources, excluding the use of recycled inputs in production processes. Examples include managing storm water or implementing organic agriculture or sustainable forestry practices.
Respondents also were asked to provide occupational employment and wage information for workers who spent more than half their time involved in green technologies and practices. These data are available at www.bls.gov/gtp/#tables.
About 75 percent of establishments used at least one green technology or practice during the survey reference period. (See chart 1.) The most common types of green technologies and practices were improving energy efficiency within the establishment, used by more than 57 percent of establishments, and reducing or eliminating the creation of waste materials (55 percent). The remaining GTPs were much less prevalent, with usage rates ranging from 2 percent for establishments generating electricity, heat, or fuel from renewable sources primarily for use within the establishment to 19 percent for establishments using technologies and practices to conserve natural resources.
About 25 percent of all establishments used only one type of green technology or practice in August 2011. An additional 26 percent used 2 types of green technologies and practices, 15 percent used 3 GTPs, and 9 percent used 4 or more GTPs. To put it differently, among establishments that used any green technologies or practices, the majority—about two-thirds—used more than one type, split almost equally between those using exactly two GTPs and those using three or more.
Table 1 shows the percentage of all establishments using at least one green technology or practice (GTP establishments) that used each of the 15 possible combinations of two GTPs. (Because establishments may have used additional GTPs aside from those in each combination, the data in the table will sum to more than 100 percent.) Not surprisingly, the most common pairwise combination consisted of the two most frequently used individual practices, improving energy efficiency and reducing waste. More than half of all GTP establishments (54 percent) used both of these practices, either exclusively or in combination with additional GTPs. The next most commonly used combinations consisted of each of these two practices in combination with the most prevalent of the four remaining practices, using GTPs to conserve natural resources. The least common pairwise combinations involved the least common individual practice—generating electricity, heat, or fuel from renewable sources primarily for use within the establishment—in combination with each of the other three less common GTPs: reducing greenhouse gas emissions, reducing pollutants, and conserving natural resources. Each of these three combinations was used by between 1 and 2 percent of GTP establishments.
| Green technology or practice | Generating electricity, heat, or fuel from renewable sources primarily for use within the establishment | Improving energy efficiency within the establishment | Reducing greenhouse gas emissions through methods other than renewable energy generation and energy efficiency | Reducing the creation or release of pollutants or toxic compounds, or removing pollutants or hazardous waste from the environment | Reducing or eliminating the creation of waste materials |
|---|---|---|---|---|---|
|
Improving energy efficiency within the establishment |
2.7 | N/A | 13.9 | 14.1 | 54.0 |
|
Reducing greenhouse gas emissions through methods other than renewable energy generation and energy efficiency |
1.2 | 13.9 | N/A | 4.6 | 13.5 |
|
Reducing the creation or release of pollutants or toxic compounds, or removing pollutants or hazardous waste from the environment |
1.3 | 14.1 | 4.6 | N/A | 14.6 |
|
Reducing or eliminating the creation of waste materials |
2.5 | 54.0 | 13.5 | 14.6 | N/A |
|
Conserving natural resources (excluding use of recycled inputs in production processes) |
1.5 | 21.0 | 6.7 | 8.9 | 22.1 |
|
Note: Data represent establishments using each combination of two green technologies and practices, as a percentage of all establishments using at least one GTP. Percentages will add to more than 100 because establishments may use other GTPs in addition to the two in each combination. N/A: not applicable. Source: U.S. Bureau of Labor Statistics. |
|||||
The most commonly used single GTPs or specific combinations of GTPs are shown in chart 2. Data differ from those in table 1 in that they represent the percentage of GTP establishments that used only the individual practice or combination of practices shown, but no additional GTPs. Out of more than 60 possible sets of single GTPs or combinations of GTPs, the 10 in chart 2 were used by 84 percent of GTP establishments. All of these sets of activities included one or both of the two most common individual practices, improving energy efficiency and reducing waste. More than half of GTP establishments (56 percent) used these two practices either separately or in combination with one another, without using any of the less common practices. About one-quarter of GTP establishments used both practices in combination, an additional 17 percent used only GTPs to improve energy efficiency, and 14 percent used only GTPs to reduce waste. The fourth most common set of activities, used by about 8 percent of establishments, consisted of these two types of GTPs in combination with using GTPs to conserve natural resources.
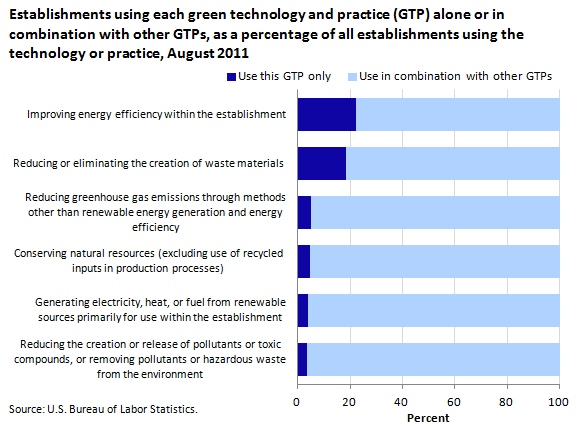
Establishments using the two most common types of GTPs were less likely to use multiple GTPs than were establishments using the less common types of practices. Chart 3 shows, for establishments using each of the six types of GTPs, the percentage breakdown between those using only that GTP and those using the given GTP in combination with others. For all types of GTPs, the majority of establishments used the GTP in combination rather than alone. However, the share of establishments using only a single GTP was much higher for the two most common GTPs than for the less common types. Twenty-two percent of establishments that used GTPs to improve energy efficiency and 18 percent of establishments that used GTPs to reduce waste used only that selected GTP, with the remainder using the GTP in combination with other practices. By comparison, among establishments using the four less common GTPs, 95 percent or more used more than one GTP.
Chart 3 shows that establishments that used certain GTPs were more likely than average to use more than one GTP. This section expands on that concept by further examining which practices are most likely to be used in combination with others. Charts 4 and 5 show specific results for the most and least commonly used practices. In general, establishments that used one of the two most common GTPs—improving energy efficiency or reducing waste—were slightly less likely than all GTP establishments to use the other common GTP, and not much more likely than average to use the remaining GTPs. On the other hand, establishments that used one of the less common GTPs were more likely than average to use other unusual GTPs, but not necessarily more likely to use the two most common GTPs.
Establishments using GTPs to improve energy efficiency were less likely than all GTP establishments to use GTPs to reduce waste, and establishments using GTPs to reduce waste were less likely than all GTP establishments to use GTPs to improve energy efficiency. Seventy percent of establishments that used GTPs to improve energy efficiency also used GTPs to reduce waste, compared with 74 percent of all GTP establishments. (See chart 4.) Approximately 73 percent of establishments using GTPs to reduce waste also used GTPs to improve energy efficiency—about 4 percentage points lower than the rate across all GTP establishments.
Establishments that used GTPs to improve energy efficiency were no more likely than average to use any of the four less common types of green technologies and practices. Establishments that used GTPs to reduce waste were no more likely than average to use two of the four less common GTPs, and were only slightly more likely to use the remaining two: 30 percent also used GTPs to conserve natural resources and 20 percent used GTPs to reduce pollutants, compared with 26 percent and 18 percent of all GTP establishments, respectively.
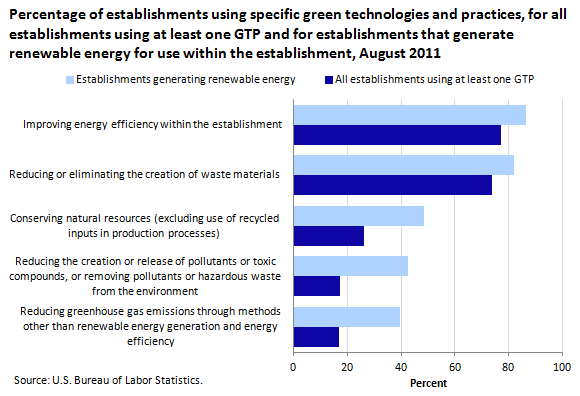
On the other hand, establishments that used one of the less common GTPs were more likely than average to use other unusual GTPs, but not necessarily more likely to use the two most common GTPs. Chart 5 contains a comparison similar to that in chart 4, but for establishments using the least common GTP: generating light, heat, or electricity from renewable sources primarily for use within the establishment. Compared with all GTP establishments, those generating renewable energy were more than twice as likely to use GTPs to reduce greenhouse gas emissions and to reduce pollutants. Forty-nine percent of establishments that generated renewable energy for use within the establishment also used GTPs to conserve natural resources, nearly double the 26 percent rate across all GTP establishments. Usage rates for the two most common types of GTPs, improving energy efficiency and reducing waste, were not significantly different from the average.
Results for the remaining three less common GTPs—reducing greenhouse gas emissions, conserving natural resources, and reducing pollutants—were similar to those shown in chart 5. Establishments performing any of these three GTPs were more likely than average to use each of the other less common GTPs and were not significantly more likely than average to use the most common GTP, improving energy efficiency. In some cases, the differences in use of the less common GTPS were quite large. For example, 34 percent of establishments that used GTPs to conserve natural resources and 27 percent of establishments that reduced greenhouse gas emissions also used GTPs to reduce pollutants, compared with 18 percent of all GTP establishments. Unlike establishments that generated renewable energy, those using any of the other less common practices were somewhat more likely than average to use the second most common GTP, reducing waste. For example, among establishments that used GTPs to conserve natural resources, 85 percent also used GTPs to reduce waste, compared with 74 percent of all GTP establishments.
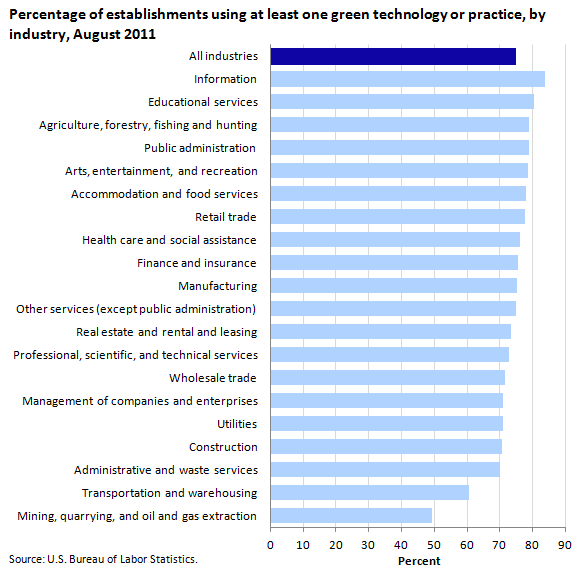
Although about 75 percent of all establishments used at least one green technology or practice in August 2011, this rate varied considerably across industries. (See chart 6.) Mining, quarrying, and oil and gas extraction had the lowest overall rate of GTP use, with 49 percent of establishments using at least one GTP. Transportation and warehousing (61 percent), administrative and waste services (70 percent), and construction (71 percent) also had below-average rates of green technologies and practices use. At the other end of the spectrum, the information and educational services industries had some of the highest rates of GTP use, with 84 percent and 81 percent of establishments, respectively, using at least one GTP.
Compared with the overall rate of GTP use, rates for individual types of GTPs tended to vary more by industry. For example, the share of establishments using GTPs to conserve natural resources ranged from around 15 percent in wholesale trade, transportation and warehousing, and other services (except public administration) to nearly 62 percent in agriculture, forestry, fishing, and hunting. These differences may reflect, in part, industry-specific differences in the environmental impact of production processes. For instance, industries that were least likely to use GTPs to reduce pollutants included finance and insurance (5 percent); professional, scientific, and technical services (8 percent); and information (8 percent). These industries’ production processes also may be less likely to release pollutants directly into the environment than those of industries that used this GTP more extensively, such as utilities (31 percent) and agriculture, forestry, fishing, and hunting (28 percent).
In some cases, differences in usage rates for individual GTPs help explain the variation in overall GTP use across industries. For example, the industry with the lowest percentage of establishments using at least one GTP—mining, quarrying, and oil and gas extraction—also had extremely low incidence rates for the two most common GTPs. Only 22 percent of establishments in this industry used GTPs to improve energy efficiency, compared with 57 percent across all industries; 37 percent of this industry’s establishments used GTPs to reduce waste, compared with 55 percent across all industries. For some industries, however, the relationship between overall usage rates and usage rates of individual GTPs was less clear. For example, the administrative and waste services industry had incidence rates above or similar to the averages for 5 of the 6 individual GTPs, but the share of establishments using at least one GTP was about 4 percentage points below the cross-industry average.
In general, industries with higher overall rates of GTP use also had higher shares of establishments using multiple GTPs. The correlation between the percentage of establishments using at least one GTP and the percentage using two or more GTPs was approximately 0.84, falling to about 0.45 when multiple GTP use was measured by the percentage using three or more GTPs. Industries with the highest percentages of establishments using two or more GTPs included educational services (65 percent), public administration (64 percent); and agriculture, forestry, fishing, and hunting (62 percent). Those with the lowest percentages using two or more GTPs included mining, quarrying, and oil and gas extraction (30 percent); transportation and warehousing (41 percent); and real estate, rental, and leasing (43 percent). The percentage of establishments using three or more GTPs varied by industry from 19 percent in professional, scientific, and technical services to 45 percent in agriculture, forestry, fishing, and hunting.
Usage rates for combinations of two GTPs showed similar patterns for most industries. The most common combination overall—improving energy efficiency in combination with reducing waste—was also the most common combination in nearly every industry. The exceptions were agriculture, in which the most common combination was conserving natural resources along with reducing waste, and mining, in which both of these combinations were about equally prevalent. Combinations involving the least common individual practice, generating renewable energy for use within the establishment, tended to be the least commonly used in most industries.
Although usage patterns for pairwise combinations of GTPs were generally similar across industries, usage rates for a given combination varied substantially. For example, usage rates for improving energy efficiency combined with reducing waste ranged from 34 percent of GTP establishments in mining, quarrying, and oil and gas extraction—an industry with very low incidence rates for both practices separately—to 72 percent for educational services. Similarly, usage rates for conserving natural resources in combination with reducing pollutants varied from 5 percent of GTP establishments in finance and insurance to 36 percent in utilities, compared with 8 percent across all industries.
This report provides an overview of data from the first BLS Green Technologies and Practices survey, supplemented by results from a special data tabulation on the use of multiple green technologies and practices. About two-thirds of businesses that used any green technologies and practices used more than one type. However, as a group, businesses that used the two most common types of GTPs—improving energy efficiency and reducing waste—appeared to behave somewhat differently from those that used the less common GTPs. Approximately 1 in 5 businesses that used either of these GTPs used no other type of GTP, compared with about 1 in 20 businesses that used any of the less common GTPs. Businesses that used either of the common GTPs also were less likely than average to use the other common GTP, and not substantially more likely than average to use the less common GTPs. By comparison, using any of the less common GTPs was associated with a greater likelihood of using other less common GTPs, but had a less pronounced relationship with the use of the two most common GTPs, possibly because these practices were already widespread among this group of establishments. Multiple GTP use tended to be more common in industries with higher overall rates of GTP use; although the most common combinations of GTPs were similar across industries, usage rates for a given combination often varied widely by industry.
This issue of BEYOND THE NUMBERS, prepared by Audrey Watson, economist, Occupational Employment Statistics program, contains information from a special tabulation of Green Technologies and Practices survey data performed specifically for the purposes of this article. Publicly available August 2011 GTP data are available from the GTP website at www.bls.gov/gtp/. Email: GTPinfo@bls.gov; Telephone: (202) 691-6599.
Information in this article will be made available to sensory-impaired individuals upon request. Voice phone: (202) 691-5200. Federal Relay Service: 1 (800) 877-8339. This article is in the public domain and may be reproduced without permission.
Audrey Watson, “Reduce, reuse, recycle: green technologies and practices at work,” Beyond the Numbers: Special Studies & Research, vol. 2, no. 7 (U.S. Bureau of Labor Statistics, March 2013), https://www.bls.gov/opub/btn/volume-2/reduce-reuse-recycle-green-technologies-and-practices-at-work.htm
1 A separate BLS survey, the Green Goods and Services survey, is based on the output approach to measuring green jobs and collects data on jobs associated with the production of goods or provision of services that benefit the environment or preserve natural resources. More information on the BLS green jobs initiative is available at www.bls.gov/green/.
Publish Date: Monday, March 25, 2013