An official website of the United States government
An official website of the United States government
The .gov means it's official.
Federal government websites often end in .gov or .mil. Before sharing sensitive information,
make sure you're on a federal government site.
The site is secure.
The
https:// ensures that you are connecting to the official website and that any
information you provide is encrypted and transmitted securely.

More articles and information on long-term unemployment can be found at the following links:
Since the start of the recent recession, which began in December 2007, many unemployed Americans have entered the ranks of the long-term unemployed (those who are unemployed for 27 weeks or more). Long-term unemployment peaked at 46 percent of total unemployment in May 2010, well after the recent recession ended in June 2009.1 In contrast, after an earlier recession, which lasted from July 1981 to November 1982, the long-term unemployed number peaked at 26 percent of total unemployment in 1983.2
These point-in-time estimates, however, do not indicate the proportion of people who have a long-term unemployment spell over their labor market career, how long it takes to find a job after their first long-term unemployment spell, or how the spell affects wages over time. This Beyond the Numbers article begins to answer these questions. Using the employment history of men in the National Longitudinal Survey of Youth 1979 (NLSY79), the article examines entry into and out of long-term spells of unemployment and looks at the effect of long-term unemployment on average wages. The men in the NLSY79 were born in the years 1957 to 1964. The analysis covers the mid-1980s through 2009, focusing on men’s employment histories from their mid-20s, after they have become integrated into the labor market, until their middle to late 40s and early 50s.
Researchers find that workers who have been unemployed due to job displacement often experience persistent subsequent earnings losses, earnings volatility, and later periods of job loss, although none of these studies looks specifically at the long-term unemployed.3 When a household member is unemployed, household finances suffer, which often leads to depleted savings, increased debt, and trouble making rent or mortgage payments.4 In addition to negative financial impacts, long-term unemployment may adversely affect the physical and mental health of the unemployed5 and may negatively affect their children’s academic achievement.6
The data used in this article are from the NLSY79, a nationally representative sample of 12,686 men and women born from 1957 to 1964 (the latter years of the baby boom) and living in the United States at the time of the initial survey in 1979. Respondents were interviewed annually from 1979 through 1994; after 1994, they were interviewed every other year. By the 2010 survey, NLSY79 respondents were ages 45 to 53.7
The NLSY79 is well-suited for studying long-term unemployment because it contains a complete work history for each respondent and it differentiates between time spent looking for work or on layoff (during which an individual is considered to be unemployed) and time spent out of the labor force. It contains a rich array of background characteristics, including educational attainment and the Armed Forces Qualifying Test (AFQT) score for respondents, which is a measure of math and verbal aptitude.8
The analysis is restricted to men, as women’s labor force participation is generally more complicated because of their role in child bearing and child care. The analysis focuses on civilian labor market experiences, so it excludes any men who have active military service from the year they turn 25 through the 2009 calendar year. For the purposes of this analysis, labor market entry occurs in the year in which a respondent begins a streak of at least 2 consecutive calendar years working at least 40 weeks per year. The earliest this streak can begin is the January of the calendar year in which the respondent turns 25. These restrictions ensure that the men in our analysis are fully integrated into the labor market, thus avoiding the labor market mobility (churning) that is common in the early years of work experience. A spell of long-term unemployment is defined as one in which a person is unemployed for 27 weeks or more.9
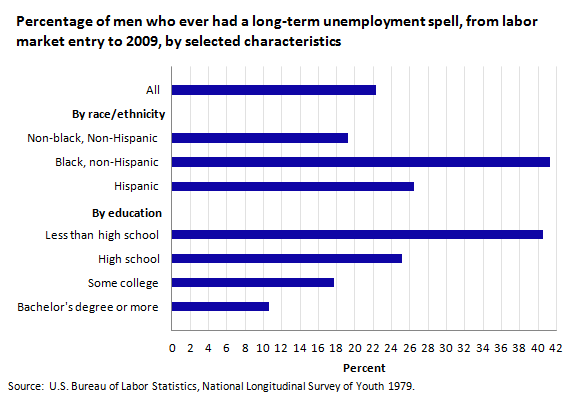
Chart 1 shows the percentage of men who have experienced a long-term unemployment spell at some point between the time of their labor market entry and 2009. Slightly more than 22 percent of men have had a long-term unemployment spell. The incidence of long-term unemployment is much higher for Black, non-Hispanic men than for non-Black, non-Hispanic men or for Hispanic men. About 41 percent of Black men have had a long-term unemployment spell, compared with 19 percent of non-Black, non-Hispanic men and 26 percent of Hispanic men.10 Those with less than a high school diploma are much more likely to have had a long-term unemployment spell than men who have attained higher education.11 For example, almost 41 percent of men with less than a high school diploma have had a long-term unemployment spell, compared with 25 percent of men with a high school diploma. Less than 11 percent of men with a bachelor’s degree or more experienced a long-term unemployment spell from the time they entered the labor market through 2009.
Table 1 focuses on the descriptive characteristics of the sample, showing the percentage of men in the survey who reported those characteristics, and whether men with those characteristics ever had a long-term unemployment spell. Compared to men who have never had a long-term unemployment spell, men who have had a long-term unemployment spell are more likely to be Black, have lower levels of education at the time they enter the labor market, and have lower average AFQT scores. Men who have had a long-term spell of unemployment average 18.5 years of employment from the year of labor market entry through 2009. In comparison, those without a long-term spell average more than 22 years of employment. Men with a long-term spell average about 2.3 years of unemployment (looking for work or on layoff) and 2.5 years out of the labor force (not working and not looking for work) from the year of entry through 2009. In contrast, men with no long-term unemployment spell only average 0.2 years (2.4 months) unemployed and 0.8 years (9.6 months) out of the labor force from their labor market entry through 2009.
| Characteristic | All | No long-term spell | Had long-term spell |
|---|---|---|---|
|
Non-black, non-Hispanic |
81.9 | 85.2 | 70.6 |
|
Black, non-Hispanic |
12 | 9.1 | 22.2 |
|
Hispanic |
6.1 | 5.7 | 7.2 |
|
Less than high school |
13.1 | 10 | 23.8 |
|
High school |
44.1 | 42.5 | 49.7 |
|
Some college |
19.5 | 20.7 | 15.5 |
|
Bachelor's degree or more |
23.3 | 26.8 | 11.1 |
|
Math-verbal standard score |
0.05 | 0.19 | -0.44 |
|
Labor-market experience from entry through 2009 |
|||
|
Years employed |
21.8 | 22.7 | 18.5 |
|
Years unemployed |
0.7 | 0.2 | 2.3 |
|
Years out of the labor force |
1.2 | 0.8 | 2.5 |
|
Source: U.S. Bureau of Labor Statistics, National Longitudinal Survey of Youth 1979. |
|||
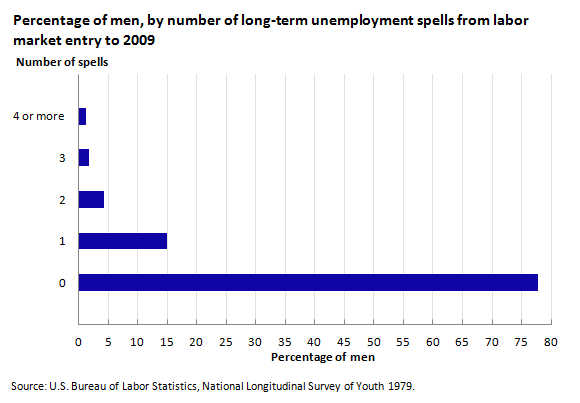
Chart 2 shows the number of long-term unemployment spells experienced by the men in this NLSY79 sample from the time they enter the labor market through 2009. More than three quarters of the sample had no spells of long-term unemployment. Almost 15 percent had only one spell of long-term unemployment, 4.3 percent had two spells, 1.8 percent had three spells, and 1.3 percent of the sample had four or more spells.
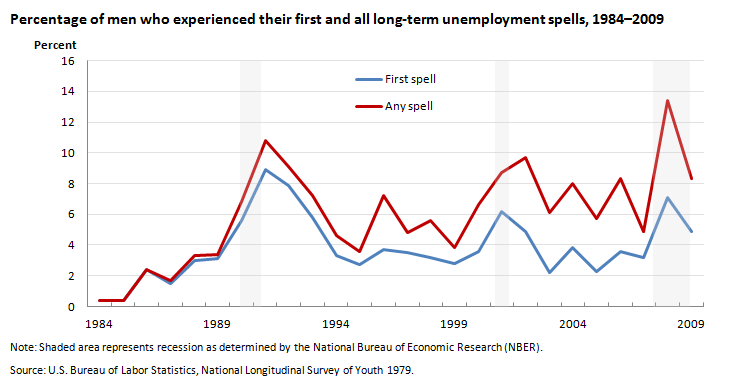
Spells of long-term unemployment and economic downturns are closely related. Chart 3 shows the percentage of men in each year who experienced the onset of their first and any long-term unemployment spells.12 The trend lines spike up around years of economic downturns. For example, during the 8-month recession in the early 1990s, there is a steep increase in first experiences of long-term unemployment. Early into their careers, 8.9 percent of the men in the survey began their first long-term unemployment spell in 1991 and in 1992, 7.9 percent of the men began their first spell. In 2001, the time of another economic downturn, 6.2 percent of men began their first long-term unemployment spell. Finally, in 2008, the time of the most recent recession, 7.1 percent of men began their first long-term unemployment spell and 13.4 percent of men began any long-term spell of unemployment.
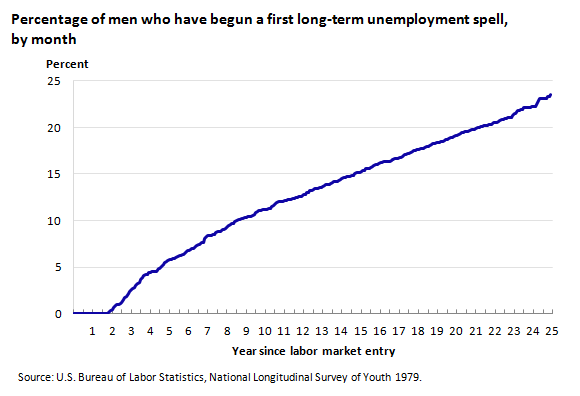
After 2 years of experience in the labor market, how long is it before men start experiencing long-term unemployment? Chart 4 shows the cumulative percentage of men who have begun their first long-term unemployment spell in each month.13 Although the data are monthly, for ease of interpretation the horizontal axis labels yearly intervals. In this article, labor market entry begins with 2 consecutive calendar years of working at least 40 weeks (starting the calendar year the respondent turns 25, at the earliest). Thus in the first 2 years, there’s almost no one beginning a long-term unemployment spell (and hence the trend line is flat at 0 percent).14
Five full years after labor market entry, almost 6 percent of the sample of men had begun a long-term unemployment spell. At the end of 10 years, the number is 11 percent. At the end of 20 years after labor market entry, 19 percent of men in the sample have begun at least one long-term spell of unemployment.
Table 2 describes typical characteristics of first long-term employments spells, restricting the sample to those who have experienced one. The table shows that, on average, the first long-term spell of unemployment lasted almost 55 weeks, well above the 27-week definition of long-term unemployment. (Note that the first long-term unemployment spell may end for two reasons: finding and starting a job or leaving the labor force.)15 Almost 89 percent of male respondents with a first long-term unemployment spell held a job by the end of 2009. There was an average of 38 weeks between the 27th week of the first long-term unemployment spell and the start date of the next job. On average, men experiencing their first long-term unemployment spell were in their 30s; about 41 percent of men were between the ages of 31 and 39 when they began their first spell.
| Description | All |
|---|---|
|
About first long-term spell |
|
|
Length of spell (weeks) (1) |
54.9 |
|
Spell ongoing in December 2009 |
8.3 |
|
Post-spell employment |
|
|
Ever employed 1 or more weeks |
88.7 |
|
Time between 27th week of long-term unemployment spell and employment start (weeks) |
38 |
|
Age at onset of first long-term spell |
|
|
30 years old and younger |
23.8 |
|
31–39 |
41.1 |
|
40 years old and older |
35 |
| Footnotes: (1) Spell could end due to leaving the labor force or finding and starting a job. The number includes those whose spell was ongoing in December 2009. |
|
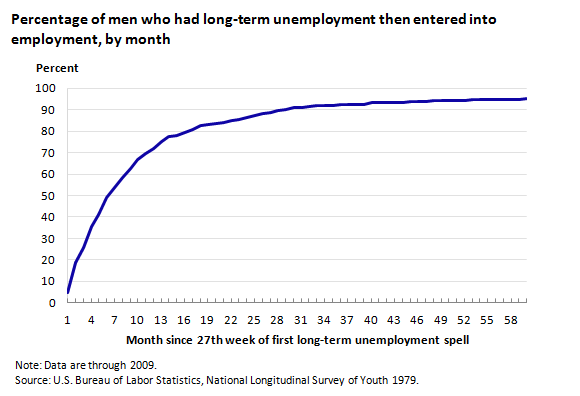
Chart 5 displays the cumulative percentage of men who enter a job in each month following the 27th week of their first long-term spell of unemployment. In the first 12 months or so, the curve rises sharply, as many men return to work. After this, the curve becomes less steep, and it flattens out at about 30 months, as fewer of the very long-term unemployed enter into an employment relationship. For example, at 6 months, 49 percent of men have returned to work, and by 12 months, almost 72 percent of the men have started working. By 24 months, almost 87 percent of men who were in a long-term unemployment spell have returned to work.
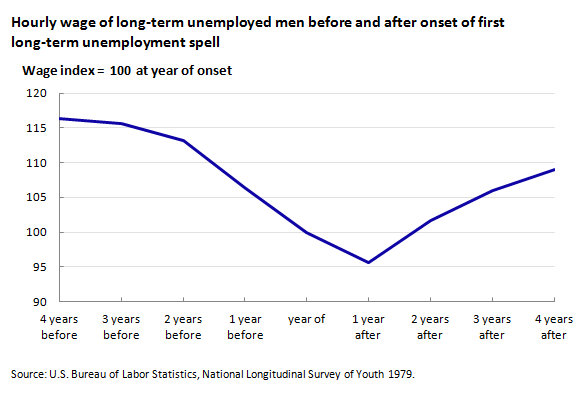
Before a long-term unemployment spell, individuals may experience deterioration in wages, whether because of declining demand conditions at the firm or because they are moving in and out of employment relationships after losing a previous job. In the first years after the long-term spell, wages might be lower as the skills and knowledge that were valued by their former company may no longer be useful in their new job, and their general human capital (skills and knowledge valued by all companies) may have depreciated. If the men who were reemployed can build up their skills and knowledge in their new job, their wages may increase again over time. However, if individuals face additional periods of joblessness, wages may not recover over time.
Chart 6 shows the average relative hourly wage trajectory of the long-term unemployed from 4 calendar years before the start of the first long-term spell to 4 calendar years after the start of the first long-term spell.16 The wage index used in chart 6 was created by dividing each respondent’s average hourly wage in a calendar year by the average hourly wage in the year the unemployment spell first began, and then multiplying by 100. Thus, the hourly wage in the year of the spell’s onset has a value of 100, and the hourly wage values before and after the spell show the average percent increase or decrease in hourly wages relative to the hourly wage in the year the spell began. For example, a value of 110 means that the hourly wage is 10 percent higher than wages in the year the spell began.
Chart 6 shows a sharp decrease in the average hourly wage in the calendar year before the first long-term unemployment spell, compared with 2 to 4 years before the spell.17 In the year that the first long-term unemployment spell started, the average hourly wage is about 13 percent lower than the average hourly wage 2 years before the first long-term spell. In the first calendar year after onset of the first long-term unemployment spell, average hourly wages continued to fall by about 4 percent. Average hourly wages then trend back up in the following years. However, average hourly wages are about 7 percent lower 4 years after the onset of the long-term unemployment spell than they were 4 years before the long-term spell. In contrast, men who do not experience a long-term unemployment spell have very significant wage growth over time. For example, over the 8-year period from 1990 to 1998, men who never had a long-term unemployment spell experienced a 41-percent increase in their real hourly wages, on average.
More than 22 percent of NLSY79 men experienced at least one long-term spell of unemployment from their labor market entry through 2009. Black men and men with lower levels of education were much more likely to have a long-term spell of unemployment. On average, the first long-term unemployment spell lasted 55 weeks. The majority of men eventually find another job. Average hourly wages decline more than 17 percent from 2 years before the beginning of the first long-term unemployment spell to the year after it began. Hourly wages begin to trend upwards in the years following the first long-term unemployment spell. However, 4 years after onset of the first long-term unemployment spell, average hourly wages are still 7 percent below what they were 4 years before the spell began.
This Beyond the Numbers article was prepared by Donna Rothstein. Email: NLS_INFO@bls.gov. Telephone: (202) 691-7410.
Upon request, information in this article will be made available to individuals with sensory-impairments. Voice phone: (202) 691-5200. Federal Relay Service: 1 (800) 877-8339. This article is in the public domain and may be reproduced without permission.
Donna S. Rothstein, “Long-term unemployment over men’s careers,” Beyond the Numbers: Employment & Unemployment, vol. 2, no. 21 (U.S. Bureau of Labor Statistics, August 2013), https://www.bls.gov/opub/btn/volume-2/long-term-unemployment-over-mens-careers.htm
1 “The Employment Situation–September 2010” (U.S. Bureau of Labor Statistics, October 8, 2010), table A12: USDL-10-1393.
2 Sylvia Allegreto and Devon Lynch, “The Composition of the Unemployed and Long-term Unemployed in Tough Labor Markets,” Monthly Labor Review, October 2010, pp. 3–18.
3 Louis Jacobson, Robert Lalonde, and Daniel Sullivan, “Earnings Losses of Displaced Workers,” American Economic Review 83, no. 3 (September 1993), pp. 685–709; Ann Huff Stevens, “Persistent Effects of Job Displacement: The Importance of Multiple Job Losses,” Journal of Labor Economics, 15, no. 1, (1997), pp. 165–188; Til Von Wachter, Jae Song, and Joyce Manchester, “Long-term Earnings Losses Due to Mass Layoffs during the 1982 Recession: An Analysis Using Administrative Data from 1974–2004,” unpublished working paper (April 2009), http://www.econ.ucla.edu/tvwachter/papers/mass_layoffs_1982.pdf.
4 Rich Morin and Rakesh Kochhar, “The Impact of Long-term Unemployment: Lost Income, Lost Friends—and Loss of Self Respect,” Pew Research Center, July 2010.
5 Ibid.; Daniel Sullivan and Til von Wachter “Job Displacement and Mortality: An Analysis Using Administrative Data,” The Quarterly Journal of Economics 124, no. 3, (2009), pp. 1265–1306.
6 Phil Oreopoulos, Marianne Page, and Ann Huff Stevens, “Intergenerational Effects of Job Displacement,” Journal of Labor Economics 26, no. 3 (2008), pp.455–83; Ann Huff Stevens and Jessamyn Schaller, “Short-run Effects of Parental Job Loss on Children’s Academic Achievement,” Economics of Education Review 30, no. 2, (2011), pp. 289–99.
7 The NLSY79 includes oversample of Black and Hispanic individuals. All statistics in this article are weighted with 2010 survey weights to make the sample representative of the population from which the NLSY79 is drawn. The NLSY79 sample was drawn in 1978, and thus the weighted sample is representative of individuals in this cohort living in the United States in 1978.
8 Because respondents were different ages when they took the test in 1980, the author standardizes the AFQT score by year of birth; the standardized score has a mean of 0 and a standard deviation of 1 in the full, weighted NLSY79 sample.
9 The NLSY79 records the dates of gaps in employment. However, if a respondent reports he was looking for work during only part of the employment gap, it does not then ask for the dates of the unemployed portion (versus the portion spent out of the labor force). The weekly work-history arrays in the public-use NLSY79 data allocate the unemployed period to the middle part of the gap in employment and the out-of-the-labor-force period to the end points. Thus, the number of long-term unemployment spells may be undercounted.
10 Note that these figures are representative of individuals living in the United States at the time the NLSY79 sample was drawn in 1978. This consideration may be especially important for the Hispanic sample, as the number of Hispanics has grown immensely since 1978.
11 In chart 1 and table 1, educational attainment is recorded at the time of labor market entry.
12 If a respondent began two spells in a particular year (rare in the data), they are only counted once for that year.
13 Percentages in charts 4 and 5 are Kaplan-Meier survival estimates, showing time until entry into a first long-term unemployment spell (chart 4) and time until exit from the spell into a job (chart 5).
14 In this article, entry into the first long-term unemployment spell occurs at the spell’s start date.
15 Those with ongoing long-term unemployment spells in December of 2009 were also used in the calculation.
16 The weekly work-history arrays in the NLSY79 were used to fill in hourly wages and hours worked per week of every job held in a particular year. The wages were deflated to 1982–1984 dollars. Hourly wage values were excluded if they were less than $2/hour or more than $200/hour. Hourly wages were then averaged over all of the weeks worked in the calendar year with valid wage observations. Yearly average hourly wage observations were excluded if more than 50 percent of the hourly wage values are missing for the weeks worked.
17 Note that sample sizes vary over the years, and the chart only includes men who have a valid average hourly wage for the calendar year of the first long-term spell’s onset.
Publish Date: Friday, August 16, 2013