An official website of the United States government
An official website of the United States government
The .gov means it's official.
Federal government websites often end in .gov or .mil. Before sharing sensitive information,
make sure you're on a federal government site.
The site is secure.
The
https:// ensures that you are connecting to the official website and that any
information you provide is encrypted and transmitted securely.

More BLS articles and information related to consumer expenditures are available online at the following links:
The United States is a nation of great diversity. Large houses and big red barns are found on the open farmlands of the Midwest while apartments and coffee shops occupy the corners of busy city streets. The varying landscapes shape the lives, customs, and spending habits of Americans. Using data from the Bureau of Labor Statistics Consumer Expenditure Survey (CE), this Beyond the Numbers article examines demographic characteristics and spending habits of urban and rural households in the United States in 2011. In total, approximately 92 percent of households were urban and 8 percent were rural.1 The following data highlight important differences between consumer expenditures by rural and urban households in 2011:
The reference persons of rural households were older than those of urban households, with average ages of 54 and 49, respectively.3 The reference persons of rural households were less likely to have a college education than their urban counterparts—49 percent compared with 63 percent, respectively. (See chart 1.) The homeownership rate for rural households was 83 percent, significantly higher than the homeownership rate of 63 percent for urban households. In addition, 49 percent of rural homeowners carried a mortgage, compared with 63 percent of urban homeowners who did. Rural households were more likely to own or lease a vehicle (93 percent) than urban households (87 percent). And rural households owned an average of 2.4 vehicles, compared with urban households’ average of 1.8 owned vehicles.
Urban households received $15,779 (32 percent) more in yearly income than rural households received. Urban households received more income in the form of wages and salaries, and interest, dividends, rental, and other property income. Rural households received $2,076, or 28 percent, more in Social Security, and in private and government retirement income.
In 2011, urban households spent $50,348, which was 18 percent more than the $42,540 spent by rural households. Urban households had higher expenditures on food, housing, apparel, and education, while rural households spent more on transportation, health care, and entertainment.4 (See chart 2.)
The principal differences in overall expenditures between rural and urban households are the amounts spent on the chief elements of housing: mortgage interest and rental payments. These expenditures are affected by many different variables, but can be understood fundamentally by supply and demand, and are often dependent on location. Land is scarce in urban areas, and many people are vying for limited housing; therefore, rent is higher and houses are more expensive. In many rural areas, land is plentiful, so prices tend to be lower. Urban households estimated that the market value of their owned home was $153,147, while rural households estimated that the market value of their owned home was $129,111, a difference of $24,036. Urban renters reported paying $699, on average, for monthly rent, while rural renters reported paying $354, on average.
| Item | Urban | Rural |
|---|---|---|
|
Housing |
$17,226 | $12,115 |
|
Shelter |
10,211 | 5,529 |
|
Owned dwellings |
6,308 | 4,362 |
|
Mortgage interest and charges |
3,282 | 2,094 |
|
Property taxes |
1,892 | 1,316 |
|
Maintenance, repairs, insurance, other expenses |
1,135 | 952 |
|
Rented dwellings |
3,228 | 824 |
|
Other lodging |
675 | 343 |
|
Utilities, fuels, and public services |
3,723 | 3,766 |
|
Natural gas |
438 | 213 |
|
Electricity |
1,403 | 1,648 |
|
Fuel oil and other fuels |
133 | 423 |
|
Telephone services |
1,230 | 1,192 |
|
Water and other public services |
520 | 290 |
|
Household operations |
1,164 | 660 |
|
Personal services |
419 | 165 |
|
Other household expenses |
744 | 496 |
|
Housekeeping supplies |
609 | 685 |
|
Laundry and cleaning supplies |
142 | 180 |
|
Other household products |
336 | 387 |
|
Postage and stationery |
131 | 118 |
|
Household furnishings and equipment |
1,519 | 1,475 |
|
Household textiles |
109 | 109 |
|
Furniture |
366 | 266 |
|
Floor coverings |
19 | 29 |
|
Major appliances |
192 | 216 |
|
Small appliances, miscellaneous housewares |
89 | 94 |
|
Miscellaneous household equipment |
743 | 761 |
| Source: U.S. Bureau of Labor Statistics, Consumer Expenditure Survey. |
Urban households were two times more likely to rent than rural households, and urban households spent $2,404 more on rented dwellings per year. Though urban households were less likely to be homeowners than rural households, they spent $1,946 more on owned homes per year. (See table 1.)
There were differences in spending on other elements of the housing budget, too. Urban households spent more on natural gas, $438 to $213, and water and other public services, $520 to $290, respectively, while rural households spent more than urban households on fuel oil and other fuels, $423 to $133, respectively.
These data underscore the relative importance of housing in the average U.S. household budget. Housing expenditures accounted for 34.2 percent of all spending in urban households and 28.5 percent of all spending in rural households. As a point of comparison, urban households spent $17,226 on housing in 2011, more than they spent on clothing, transportation, health care, and entertainment combined. Although their spending habits differ in many ways, both urban and rural households spend the greatest share of household budgets on housing.
Rural households allocated a larger share of their budgets to food, but urban households spent almost $400 more on food in 2011. (See chart 2.) Urban households spent 28 percent more on food away from home, but 5 percent less on food at home than rural households. These spending patterns provide insight into the preferences and habits of consumers. Urban households spent about $200 less than rural households on food at home, but spent about $600 more on food away from home, including meals at restaurants, meals at carry outs, and food on out-of-town trips. Interestingly, based on percent reporting, both urban and rural households reported eating out at least once a week with similar frequency, with 70 percent of urban households and 72 percent rural households eating out at least once a week. But on a weekly basis, urban households spent more at restaurants.
Whether traveling to work or school, to visit family and friends, or to go on a vacation, Americans spend a major part of their household budgets on transportation. How a household spends their money on travel is affected by different factors, such as whether they purchased a new or used vehicle, how many vehicles they own, how much money they spend on gasoline, and how much money they spend on airfare and other forms of transportation. Although transportation spending differs by less than $400 between urban and rural households, the types of transportation expenditures vary greatly.
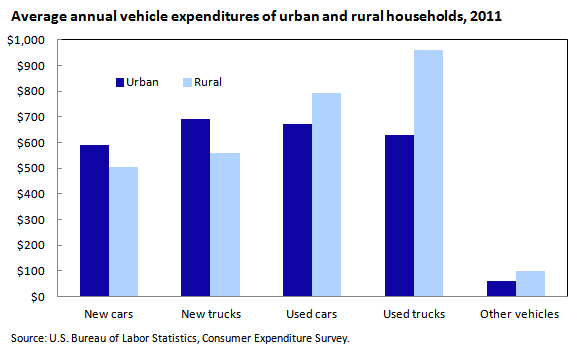
In 2011, urban and rural households spent an average of $2,586 and $2,817, respectively, on new and used cars and trucks. (See chart 3.) Rural households spent 62 percent of their car and truck budget on used cars and trucks, whereas 50 percent of the urban household’s car and truck budget was spent on used cars and trucks.
Rural households spent $3,115 on gasoline and motor oil, compared with the $2,613 spent by urban households. But urban households spent more on other categories, such as airline fares ($360 compared with $137).
Rural households reported higher spending than urban households on health care, $3,426 to $3,303. (See chart 2.) Although the total amount spent by rural households was only slightly more than urban households, rural households spent a larger portion of their total expenditures on health care. Further, rural households reported spending 32 percent more on prescription and nonprescription drugs, including vitamins, than urban households.5
Finally, a look at entertainment expenditures reveals more differences in the preferences of urban and rural households. Urban and rural households spent about the same on entertainment. Rural households reported spending $2,652 on entertainment in 2011, only $86 more than urban households. (See chart 4.) However, a major difference in entertainment spending can be found in the fees and admissions category, with urban households reporting expenditures of $621 per year, on average, and rural households reporting expenditures of $299 in this category—a difference of $322.
Although urban households spent more on health club memberships, movie tickets, and admissions to sporting events, rural households spent 48 percent more on pets than urban households.6
The data from the 2011 Consumer Expenditure Survey reveal that urban households had a higher income and higher expenditures than rural households. The results of the survey also illustrate the differences in spending between urban and rural households. This Beyond the Numbers article addresses possible explanations for these differences. In the case of housing, the concept of supply, demand, and location affects the housing costs for rural and urban areas. Data on food expenditures show that urban households spent more money on food at restaurants than rural households. Differences in transportation expenditures result from the variance in gasoline usage as well as spending on airfare. The older age of the reference person in rural households contributes to increased health care costs for rural households. Larger pet expenditures by rural households narrows the gap between entertainment spending by rural and urban households. Although rural households spent more on pets, urban households outspent rural households in a variety of other entertainment subcategories, including health club memberships, movie tickets, and admissions to sporting events.
This Beyond the Numbers report was prepared by William Hawk, economist in the Office of Prices and Living Conditions, Consumer Expenditure Survey division. Email: Hawk.William@bls.gov. Telephone: 202-691-5131.
Information in this article will be made available to sensory-impaired individuals upon request. Voice phone: (202) 691-5200. Federal Relay Service: 1-800-877-8339. This article is in the public domain and may be reproduced without permission.
William Hawk, Consumer Expenditure Program, “Expenditures of urban and rural households in 2011,” Beyond the Numbers: Prices & Spending, vol. 2, no. 5 (U.S. Bureau of Labor Statistics, February 2013), https://www.bls.gov/opub/btn/volume-2/expenditures-of-urban-and-rural-households-in-2011.htm
1 The Consumer Expenditure Survey defines urban households as all households living inside a metropolitan statistical Area (MSA) plus households living in urban areas even if they are outside of an MSA. It is important to note that using this definition means some rural areas could be considered urban areas if they reside in the MSA. For more information please see, https://www.census.gov/programs-surveys/metro-micro/about.html and the U.S. Department of Health and Human Services publication How is rural defined? (https://www.hrsa.gov/rural-health/about-us/definition/index.html).
2 This figure represents income before taxes.
3 The reference person is the first household member mentioned by the respondent when asked to "start with the name of the person or one of the persons who owns or rents the home."
4 For standard errors, please see the following table: https://www.bls.gov/cex/csxstnderror.htm.
5 Data from the Bureau of the Census show that the uninsured rate was 15.8 percent for people living inside MSAs and 15.4 percent for people living outside MSAs (https://www.census.gov/prod/2012pubs/p60-243.pdf).
6 Pet expenditures include: pet food; pet purchase, supplies, medicine; pet services; and vet services.
Publish Date: Monday, February 25, 2013